Characterization of Human Cancer Cell Lines by Reverse-phase Protein Arrays - PubMed (original) (raw)
. 2017 Feb 13;31(2):225-239.
doi: 10.1016/j.ccell.2017.01.005.
Wei Zhao 2, Rehan Akbani 1, Wenbin Liu 1, Zhenlin Ju 1, Shiyun Ling 1, Christopher P Vellano 2, Paul Roebuck 1, Qinghua Yu 2, A Karina Eterovic 2, Lauren A Byers 3, Michael A Davies 4, Wanleng Deng 5, Y N Vashisht Gopal 5, Guo Chen 5, Erika M von Euw 6, Dennis Slamon 6, Dylan Conklin 6, John V Heymach 7, Adi F Gazdar 8, John D Minna 8, Jeffrey N Myers 9, Yiling Lu 2, Gordon B Mills 10, Han Liang 11
Affiliations
- PMID: 28196595
- PMCID: PMC5501076
- DOI: 10.1016/j.ccell.2017.01.005
Characterization of Human Cancer Cell Lines by Reverse-phase Protein Arrays
Jun Li et al. Cancer Cell. 2017.
Abstract
Cancer cell lines are major model systems for mechanistic investigation and drug development. However, protein expression data linked to high-quality DNA, RNA, and drug-screening data have not been available across a large number of cancer cell lines. Using reverse-phase protein arrays, we measured expression levels of ∼230 key cancer-related proteins in >650 independent cell lines, many of which have publically available genomic, transcriptomic, and drug-screening data. Our dataset recapitulates the effects of mutated pathways on protein expression observed in patient samples, and demonstrates that proteins and particularly phosphoproteins provide information for predicting drug sensitivity that is not available from the corresponding mRNAs. We also developed a user-friendly bioinformatic resource, MCLP, to help serve the biomedical research community.
Keywords: biomarker; cancer cell lines; data portal; drug sensitivity; proteomics; reverse-phase protein array; signaling pathways.
Copyright © 2017 Elsevier Inc. All rights reserved.
Figures
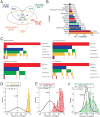
Figure 1. Overview of the MCLP cell line dataset and associated molecular and drug data
(A) Venn diagram of the MCLP cell line set with other large public cell line resources, including CCLE, COSMIC Cell Lines Project, and Genentech Cell Lines Project. (B) Distribution of MCLP cell lines in various lineages. (C) Heatmaps summarizing the publically available mRNA expression, copy number alteration, single nucleotide variation and drug sensitivity data. In the heatmaps, each vertical line in the top row represents a cell line in the MCLP set, and each line in other rows indicates the corresponding molecular data is available for that specific data type. The CTRPv2 drug sensitivity data were based on CCLE cell lines, and the GDSC data were based on COSMIC cell lines. (D) RPPA data reproducibility based on replicate samples of NCI60 cell lines. Random pairs were sampled from NCI60 cell lines only. (E) Correlations of derivative cell lines relative to random cell line pairs that were sampled from all cell lines surveyed. (F) Correlations of total- phosphorylated protein pairs relative to random protein pairs. Vertical dotted lines indicate the median values. See also Table S1 and Figure S1.
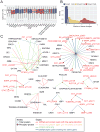
Figure 2. Comparison of protein and mRNA expression in MCLP cell lines
(A) Box plots of the expression correlations of matched mRNA and protein pairs in different lineages. Box boundaries mark the first and third quartiles, with the median in the center, and whiskers extending to 1.5 interquartile range from the boundaries. The striped box plots were based on the protein sets after excluding the 20% of proteins with the lowest coefficient of variation within each lineage. (B) Distribution of the number of lineages in which the mRNA and protein pair show a significant correlation. Three protein groups are shown in different colors. (C) Co-expression network of protein–protein expression. See also Tables S2-4 and Figure S2.
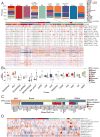
Figure 3. Clustered heatmap of MCLP cell lines based on RPPA protein expression data
(A) Distribution of different lineages in clusters based on protein expression and a heatmap showing clustered patterns of 651 MCLP cell lines based on >200 protein markers. Mutation data in key cancer genes are shown in the bars (red, mutation; white, no mutation; and grey, NA) above the heatmap, with corrected p values (FDRs) indicating the significance of correlations with the clusters. (B) Box plots of key protein markers that distinct a cluster of interest from other clusters. (C) The alignment of the RPPA clusters and the tumor subtype of breast cancer cell lines. (D) Heatmap showing pathway scores across different protein clusters, with corrected p values (FDRs) indicating the significance of correlations with the clusters. A high-resolution, interactive clustered heat map is available at the MCLP data portal. See also Table S5 and Figure S3.
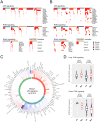
Figure 4. Effects of mutated pathways on protein expression
(A) Pattern of frequently mutated pathways in TCGA patient cohorts; red bars indicate presence of mutations in a sample. (B) Profiles of frequently mutated pathways in MCLP cell line lineages; red bars indicate presence of mutations in a sample. (C) Given the mutations of a p53 signaling pathway, a Circos plot showing proteins differentially expressed between TCGA WT and mutated breast cancer patient samples (FDR < 0.05) in the external layer and those differentially expressed between MCLP WT and mutated breast cancer cell lines in the middle layer. Color-coded fold changes: blue indicates downregulation relative to WT samples; red indicates upregulation. The inner layer: consistently up and down-regulated markers in TCGA and MCLP samples are indicated by red and blue respectively; inconsistently regulated markers are indicated by green. (D) Examples of individual proteins differentially expressed between WT and mutated samples in TCGA patients and MCLP cell lines. Box boundaries mark first and third quartiles, with the median in the center, and whiskers extending to 1.5 interquartile range from the boundaries. See also Tables S6, S7 and Figure S4.
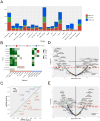
Figure 5. Predictive power of protein markers on drug sensitivity
(A) Numbers of only protein, only mRNA and both mRNA and protein markers significantly associated with different drug families (FDR < 0.1). (B) A heatmap showing the correlations of the sensitivity of EGFR pathway targeted drugs with protein, phosphoprotein and mRNA markers of their targeted genes. The color is based on the correlation direction and statistical significance, and insignificant correlations are shown in white. (C) Predictive power comparison of proteins vs. mRNAs based on multiple-marker classifiers using the AUC scores. (D) Volcano plot for EGFR_pY1068. (E) Volcano plot of EMT pathway score. Significant nodes (FDR < 0.1) are highlighted with green representing negative correlations and red representing positive correlations. See also Figure S5.
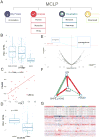
Figure 6. Utility illustration of the MCLP web platform through the example of PDL1
(A) Overview. (B) The PDL1 protein expression across lineages. (C) A positive correlation between PDL1 expression and CD49B. (D) The differential expression of PDL1 protein between the mutant and wild-type groups based on the mutation status of CCDC50. (E) Volcano plot of PDL1. (F) The co-expression pattern of PDL1 and its interacting partners in a protein–protein network view. (G) A snapshot of dynamic heatmap of the RPPA dataset.
Similar articles
- Evaluation of reverse phase protein array (RPPA)-based pathway-activation profiling in 84 non-small cell lung cancer (NSCLC) cell lines as platform for cancer proteomics and biomarker discovery.
Ummanni R, Mannsperger HA, Sonntag J, Oswald M, Sharma AK, König R, Korf U. Ummanni R, et al. Biochim Biophys Acta. 2014 May;1844(5):950-9. doi: 10.1016/j.bbapap.2013.11.017. Epub 2013 Dec 19. Biochim Biophys Acta. 2014. PMID: 24361481 - Large-Scale Characterization of Drug Responses of Clinically Relevant Proteins in Cancer Cell Lines.
Zhao W, Li J, Chen MM, Luo Y, Ju Z, Nesser NK, Johnson-Camacho K, Boniface CT, Lawrence Y, Pande NT, Davies MA, Herlyn M, Muranen T, Zervantonakis IK, von Euw E, Schultz A, Kumar SV, Korkut A, Spellman PT, Akbani R, Slamon DJ, Gray JW, Brugge JS, Lu Y, Mills GB, Liang H. Zhao W, et al. Cancer Cell. 2020 Dec 14;38(6):829-843.e4. doi: 10.1016/j.ccell.2020.10.008. Epub 2020 Nov 5. Cancer Cell. 2020. PMID: 33157050 Free PMC article. - Reverse phase protein arrays in signaling pathways: a data integration perspective.
Creighton CJ, Huang S. Creighton CJ, et al. Drug Des Devel Ther. 2015 Jul 7;9:3519-27. doi: 10.2147/DDDT.S38375. eCollection 2015. Drug Des Devel Ther. 2015. PMID: 26185419 Free PMC article. Review. - Multi-omics of 34 colorectal cancer cell lines - a resource for biomedical studies.
Berg KCG, Eide PW, Eilertsen IA, Johannessen B, Bruun J, Danielsen SA, Bjørnslett M, Meza-Zepeda LA, Eknæs M, Lind GE, Myklebost O, Skotheim RI, Sveen A, Lothe RA. Berg KCG, et al. Mol Cancer. 2017 Jul 6;16(1):116. doi: 10.1186/s12943-017-0691-y. Mol Cancer. 2017. PMID: 28683746 Free PMC article. - Reverse phase protein arrays: mapping the path towards personalized medicine.
Gallagher RI, Espina V. Gallagher RI, et al. Mol Diagn Ther. 2014 Dec;18(6):619-30. doi: 10.1007/s40291-014-0122-3. Mol Diagn Ther. 2014. PMID: 25358623 Free PMC article. Review.
Cited by
- Y-box binding protein 1/cyclin A1 axis specifically promotes cell cycle progression at G2/M phase in ovarian cancer.
Murakami Y, Katsuchi D, Matsumoto T, Kanazawa K, Shibata T, Kawahara A, Akiba J, Yanaihara N, Okamoto A, Itamochi H, Sugiyama T, Terada A, Nishio S, Tsuda N, Kato K, Ono M, Kuwano M. Murakami Y, et al. Sci Rep. 2024 Sep 17;14(1):21701. doi: 10.1038/s41598-024-72174-9. Sci Rep. 2024. PMID: 39289424 Free PMC article. - A protein expression atlas on tissue samples and cell lines from cancer patients provides insights into tumor heterogeneity and dependencies.
Li J, Liu W, Mojumdar K, Kim H, Zhou Z, Ju Z, Kumar SV, Ng PK, Chen H, Davies MA, Lu Y, Akbani R, Mills GB, Liang H. Li J, et al. Nat Cancer. 2024 Oct;5(10):1579-1595. doi: 10.1038/s43018-024-00817-x. Epub 2024 Sep 3. Nat Cancer. 2024. PMID: 39227745 - Pro-apoptotic gene BAX is a pan-cancer predictive biomarker for prognosis and immunotherapy efficacy.
Wang S, Chen X, Zhang X, Wen K, Chen X, Gu J, Li J, Wang Z. Wang S, et al. Aging (Albany NY). 2024 Jul 5;16(14):11289-11317. doi: 10.18632/aging.206003. Epub 2024 Jul 5. Aging (Albany NY). 2024. PMID: 39074253 Free PMC article. - PPAR-γ agonists reactivate the ALDOC-NR2F1 axis to enhance sensitivity to temozolomide and suppress glioblastoma progression.
Chang YC, Chan MH, Li CH, Chen CL, Tsai WC, Hsiao M. Chang YC, et al. Cell Commun Signal. 2024 May 13;22(1):266. doi: 10.1186/s12964-024-01645-3. Cell Commun Signal. 2024. PMID: 38741139 Free PMC article. - Targeting of focal adhesion kinase enhances the immunogenic cell death of PEGylated liposome doxorubicin to optimize therapeutic responses of immune checkpoint blockade.
Zhang B, Li N, Gao J, Zhao Y, Jiang J, Xie S, Zhang C, Zhang Q, Liu L, Wang Z, Ji D, Wu L, Ren R. Zhang B, et al. J Exp Clin Cancer Res. 2024 Feb 19;43(1):51. doi: 10.1186/s13046-024-02974-4. J Exp Clin Cancer Res. 2024. PMID: 38373953 Free PMC article.
References
- Byers LA, Diao L, Wang J, Saintigny P, Girard L, Peyton M, Shen L, Fan Y, Giri U, Tumula PK, et al. An epithelial-mesenchymal transition gene signature predicts resistance to EGFR and PI3K inhibitors and identifies Axl as a therapeutic target for overcoming EGFR inhibitor resistance. Clin Cancer Res. 2013;19:279–290. - PMC - PubMed
MeSH terms
Substances
Grants and funding
- P30 CA016672/CA/NCI NIH HHS/United States
- P50 CA217685/CA/NCI NIH HHS/United States
- U54 HG008100/HG/NHGRI NIH HHS/United States
- U24 CA210950/CA/NCI NIH HHS/United States
- P50 CA098258/CA/NCI NIH HHS/United States
- U01 CA168394/CA/NCI NIH HHS/United States
- U01 CA217842/CA/NCI NIH HHS/United States
- P50 CA070907/CA/NCI NIH HHS/United States
- R01 CA175486/CA/NCI NIH HHS/United States
- U01 CA176284/CA/NCI NIH HHS/United States
- U24 CA143883/CA/NCI NIH HHS/United States
- U24 CA199461/CA/NCI NIH HHS/United States
- U24 CA209851/CA/NCI NIH HHS/United States
LinkOut - more resources
Full Text Sources
Other Literature Sources
Research Materials
