The antiviral restriction factor IFN-induced transmembrane protein 3 prevents cytokine-driven CMV pathogenesis - PubMed (original) (raw)
. 2017 Apr 3;127(4):1463-1474.
doi: 10.1172/JCI84889. Epub 2017 Feb 27.
Simon Clare, Mathew Clement, Morgan Marsden, Juneid Abdul-Karim, Leanne Kane, Katherine Harcourt, Cordelia Brandt, Ceri A Fielding, Sarah E Smith, Rachael S Wash, Silvia Gimeno Brias, Gabrielle Stack, George Notley, Emma L Cambridge, Christopher Isherwood, Anneliese O Speak, Zoë Johnson, Walter Ferlin, Simon A Jones, Paul Kellam, Ian R Humphreys
- PMID: 28240600
- PMCID: PMC5373880
- DOI: 10.1172/JCI84889
The antiviral restriction factor IFN-induced transmembrane protein 3 prevents cytokine-driven CMV pathogenesis
Maria A Stacey et al. J Clin Invest. 2017.
Abstract
The antiviral restriction factor IFN-induced transmembrane protein 3 (IFITM3) inhibits cell entry of a number of viruses, and genetic diversity within IFITM3 determines susceptibility to viral disease in humans. Here, we used the murine CMV (MCMV) model of infection to determine that IFITM3 limits herpesvirus-associated pathogenesis without directly preventing virus replication. Instead, IFITM3 promoted antiviral cellular immunity through the restriction of virus-induced lymphopenia, apoptosis-independent NK cell death, and loss of T cells. Viral disease in Ifitm3-/- mice was accompanied by elevated production of cytokines, most notably IL-6. IFITM3 inhibited IL-6 production by myeloid cells in response to replicating and nonreplicating virus as well as following stimulation with the TLR ligands Poly(I:C) and CpG. Although IL-6 promoted virus-specific T cell responses, uncontrolled IL-6 expression in Ifitm3-/- mice triggered the loss of NK cells and subsequently impaired control of MCMV replication. Thus, IFITM3 represents a checkpoint regulator of antiviral immunity that controls cytokine production to restrict viral pathogenesis. These data suggest the utility of cytokine-targeting strategies in the treatment of virus-infected individuals with impaired IFITM3 activity.
Conflict of interest statement
Conflict of interest: W. Ferlin and Z. Johnson are current employees of Novimmune SA.
Figures
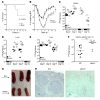
Figure 1. IFITM3 affords critical protection from MCMV infection.
WT and Ifitm3–/– mice were infected with 3 × 10⁴ PFU MCMV, and survival (A) and weight loss (B) were assessed over time. Survival data include mice culled according to UK Home Office restrictions on virus-induced weight loss. Data shown are from 14 (WT) and 21 (Ifitm3–/–) mice per group merged from 3 experiments. P value in (A) determined by Mantel Cox test. Replicating virus in spleen (C), lung (D), liver (E) and salivary glands (F) on day 4 (C–E) or 14 (F) p.i. was quantified by plaque assay. (G) Spleen morphology in WT and Ifitm3–/– mice 14 days p.i. (H) Spleens were taken 14 days p.i. and sections stained with H&E. Original magnification, ×20; scale bars: 10 μm. Data are representative of at least 3 separate experiments. *P < 0.05 and **P < 0.01, by 1-way ANOVA (B) and by Mann Whitney-U (C–F). Error bars indicate ± SEM.
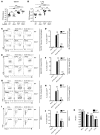
Figure 2. IFITM3 does not restrict MCMV replication.
Mixed WT/_Ifitm3_–/– bone marrow chimeras were generated and infected with MCMV, and after 4 days, PFU in spleen (A) and lung (B) were measured. Individual mice ± the median are shown from 1 of 2 experiments. M-CSF– (C and D), GM-CSF– (E and F), and FLT3L-differentiated myeloid cells (G and H) derived from WT and Ifitm3–/– bone marrow and WT and Ifitm3–/– MEFs (I and J) were infected with MCMV (using the pSM3fr-MCK-2fl BACmid) at different MOI, and MCMV m06 protein was detected 24 hours later by flow cytometry. FSC-H, forward scatter height. Data represent 2–3 experiments, and B, D, F, and H show the mean ± SEM of quadruplet wells. (K) WT and _Ifitm3_–/– MEFs, M-CSF–, GM-CSF–, and FLT3L-differentiated myeloid cells were infected with pSM3fr-MCK-2fl MCMV at an MOI of 1. Supernatant was taken 4 days later, and replicating virus was quantified by plaque assay. Results are representative of 2 to 4 experiments. **P < 0.01 and ***P < 0.001, by 1-way ANOVA with Bonferonni’s multiple comparison post-test analysis (A and B) and by 2-tailed Students t test (D, F, H, J, K). m06+ve; positive intracellular staining for MCMV m06 protein.
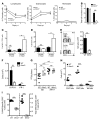
Figure 3. IFITM3 deficiency leads to impairment of cellular immunity.
WT and _Ifitm3_–/– mice were infected with MCMV. (A) On days 0, 2, and 4, the frequencies of circulating leukocyte populations in blood were quantified. Data represent the mean ± SEM of 3 mice per group for 3 experiments. (B) Viable splenocytes were quantified on day 4 p.i. Data represent the mean ± SEM of 3 to 9 mice per group for at least 5 experiments. NK1.1+CD3– cells (C) and CD3+ cells (D) were stained with 7AAD and annexin V. Data represent the mean ± SEM of 4 to 6 mice per group for at least 3 experiments. (E) Representative bivariate flow plots of NK1.1 versus CD3, gated on viable cells (left), and total viable NK cells (right) on day 4 p.i. Data represent the mean ± SEM of 3 to 9 mice per group for at least 5 experiments. (F) The total number of NK cells positive for CD107a or intracellular IFN-γ was quantified by flow cytometry on day 4 p.i. Data represent the mean ± SEM of 8 to 9 mice per group for 3 experiments. (G) WT and Ifitm3–/– mice were depleted of NK cells, and the splenic viral load was assessed by plaque assay 4 days later. Data represent individual mice ± the median for 3 experiments (2 using anti-NK1.1 [αNK1.1] and 1 using anti-ASGM1 treatment). (H) The number of CD4+, CD8+, and NK1.1+ cells was quantified in spleens on day 7 p.i. Data represent individual mice ± the mean for 3 similar experiments. (I) Percentage and total M45-specific CD8+ T cells 7 days p.i.. All results represent at least 3 experiments. *P < 0.05, **P < 0.01, and ***P < 0.001, by 2-tailed Students t test (A–D, F, H, I) and by 1-way ANOVA with Bonferonni’s multiple comparison post-test analysis (G).
Figure 4. IFITM3 suppresses MCMV-induced IL-6 production.
(A–C) WT and Ifitm3–/– mice were infected or not with MCMV. (A) Proinflammatory cytokines were measured by multiplex immunoassay in splenic homogenates 4 days p.i. Data represent the mean ± SEM of 8 to 9 mice per group. (B) Spleens were taken on days 0, 2, and 4 p.i., and IL-6 was measured by ELISA in tissue homogenates. Individual mice ± mean values are depicted, and the data represent at least 2 experiments for each time point. (C) IL-6 expression by (unstimulated ex vivo) CD11chiMHC II+ (cDCs), CD11b–CD11c+B220+Siglec H+ (pDCs), and F4/80+CD11b+ (Macs) was detected by flow cytometry. Data represent the mean ± SEM of expression values for 4 to 5 mice per group from 2 experiments. (D) Mixed WT/Ifitm3–/– bone marrow chimeras were generated and infected with MCMV. After 4 days, IL-6 in spleen supernatants was quantified by ELISA. Data from 1 of 2 experiments are shown. (E) IFITM3 expression by splenic macrophages (Macs), cDCs, and pDCs was assessed by flow cytometry (blue line = WT on day 0, green line = WT on day 2 p.i., red line = Ifitm3–/– on day 2 p.i.). (F) WT and Ifitm3–/– FLT3L-, GM-CSF– and M-CSF–generated myeloid cells and primary MEFs were infected with MCMV (MOI = 1), and IL-6 protein was measured 6 hours later. Data represent the mean ± SEM of 4 quadruplet wells for at least 3 experiments. *P < 0.05, **P < 0.01, and ***P < 0.001, by 2-tailed Students t test (A–C, F) and by 1-way ANOVA with Bonferonni’s multiple comparison post-test analysis (D).
Figure 5. Ifitm3–/– myeloid cells are hyperresponsive to replication-deficient virus and endosomal TLR ligand stimulation.
(A and B) GM-CSF– and FLT3L-differentiated myeloid cells were infected or not with irradiated MCMV, and IL-6 protein in the supernatants was analyzed by ELISA 24 hours later. (C and D) GM-CSF– and FLT3L-differentiated myeloid cells were stimulated or not with a control CPG or CPG (both 0.5 μg/ml) or with Poly(I:C) (10 μg/ml) for 24 hours, and IL-6 protein in the supernatants was analyzed by ELISA. Data represent the mean ± SEM of quadruplet wells for 2 (C and D) or 3 (A and B) experiments. *P < 0.05, **P < 0.01, and ***P < 0.001, by 2-tailed Students t test.
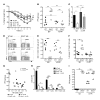
Figure 6. IL-6 is a critical regulator of MCMV-induced pathology in Ifitm3–/– mice.
WT and Ifitm3–/– mice were infected with 3 × 10⁴ PFU MCMV and treated with IgG or anti–IL-6R (2B10) on days 0 and 4 p.i. (A) Weight loss was measured over a 7-day period. Data represent the mean ± SEM of 4 to 11 mice per group. (B) Viral load in the spleen was quantified by plaque assay 4 days p.i. Data represent individual mice ± the median for 2 experiments. (C) Viable splenocytes were counted on day 4 p.i. Data represent the mean ± SEM of 2 merged experiments using 9–11 mice per group. (D) Representative bivariate plots of NK1.1 versus CD3 expression in WT (left) and Ifitm3–/– (right) mice 4 days p.i. after IgG (top) or anti–IL-6R (αIL-6R) (bottom) treatment. Viable NK cells (E) and annexin V+7AAD+ NK cells (F) were quantified 4 days p.i. (G) Correlation between viral load and NK1.1+CD3– cells in chimeric WT/Ifitm3–/– mice treated with IgG or anti–IL-6R. (H and I) After 7 days, viable splenic T cells and NK1.1+ cells were quantified and expressed as the mean ± SEM for 4 to 6 mice per group (H), and viral load in the spleen was measured (I). All results represent 2–3 experiments. *P < 0.05, **P < 0.01, and ***P < 0.001, by 1-way ANOVA (A); 1-way ANOVA with Bonferonni’s multiple comparison post-test analysis (B); 2-tailed Students t test (C, E, F); Mann Whitney-U (I); 1-way ANOVA (H); Spearman’s rank (G).
Similar articles
- Cytokine-Mediated Activation of NK Cells during Viral Infection.
Freeman BE, Raué HP, Hill AB, Slifka MK. Freeman BE, et al. J Virol. 2015 Aug;89(15):7922-31. doi: 10.1128/JVI.00199-15. Epub 2015 May 20. J Virol. 2015. PMID: 25995253 Free PMC article. - Natural Killer Cell Sensing of Infected Cells Compensates for MyD88 Deficiency but Not IFN-I Activity in Resistance to Mouse Cytomegalovirus.
Cocita C, Guiton R, Bessou G, Chasson L, Boyron M, Crozat K, Dalod M. Cocita C, et al. PLoS Pathog. 2015 May 8;11(5):e1004897. doi: 10.1371/journal.ppat.1004897. eCollection 2015 May. PLoS Pathog. 2015. PMID: 25954804 Free PMC article. - Immunoregulatory cytokine networks: 60 years of learning from murine cytomegalovirus.
Biron CA, Tarrio ML. Biron CA, et al. Med Microbiol Immunol. 2015 Jun;204(3):345-54. doi: 10.1007/s00430-015-0412-3. Epub 2015 Apr 8. Med Microbiol Immunol. 2015. PMID: 25850988 Free PMC article. Review. - Does IFITM3 link inflammation to tumorigenesis?
Lee J. Lee J. BMB Rep. 2022 Dec;55(12):602-608. doi: 10.5483/BMBRep.2022.55.12.161. BMB Rep. 2022. PMID: 36404597 Free PMC article. Review.
Cited by
- Human Cytomegalovirus Long Non-coding RNA1.2 Suppresses Extracellular Release of the Pro-inflammatory Cytokine IL-6 by Blocking NF-κB Activation.
Lau B, Kerr K, Gu Q, Nightingale K, Antrobus R, Suárez NM, Stanton RJ, Wang ECY, Weekes MP, Davison AJ. Lau B, et al. Front Cell Infect Microbiol. 2020 Jul 22;10:361. doi: 10.3389/fcimb.2020.00361. eCollection 2020. Front Cell Infect Microbiol. 2020. PMID: 32793512 Free PMC article. - IFITM3 restricts virus-induced inflammatory cytokine production by limiting Nogo-B mediated TLR responses.
Clement M, Forbester JL, Marsden M, Sabberwal P, Sommerville MS, Wellington D, Dimonte S, Clare S, Harcourt K, Yin Z, Nobre L, Antrobus R, Jin B, Chen M, Makvandi-Nejad S, Lindborg JA, Strittmatter SM, Weekes MP, Stanton RJ, Dong T, Humphreys IR. Clement M, et al. Nat Commun. 2022 Sep 8;13(1):5294. doi: 10.1038/s41467-022-32587-4. Nat Commun. 2022. PMID: 36075894 Free PMC article. - IFITM3 protects the heart during influenza virus infection.
Kenney AD, McMichael TM, Imas A, Chesarino NM, Zhang L, Dorn LE, Wu Q, Alfaour O, Amari F, Chen M, Zani A, Chemudupati M, Accornero F, Coppola V, Rajaram MVS, Yount JS. Kenney AD, et al. Proc Natl Acad Sci U S A. 2019 Sep 10;116(37):18607-18612. doi: 10.1073/pnas.1900784116. Epub 2019 Aug 26. Proc Natl Acad Sci U S A. 2019. PMID: 31451661 Free PMC article. - Genetic influences on viral-induced cytokine responses in the lung.
Forbester JL, Humphreys IR. Forbester JL, et al. Mucosal Immunol. 2021 Jan;14(1):14-25. doi: 10.1038/s41385-020-00355-6. Epub 2020 Nov 12. Mucosal Immunol. 2021. PMID: 33184476 Free PMC article. Review. - Alzheimer's genes in microglia: a risk worth investigating.
Sudwarts A, Thinakaran G. Sudwarts A, et al. Mol Neurodegener. 2023 Nov 20;18(1):90. doi: 10.1186/s13024-023-00679-4. Mol Neurodegener. 2023. PMID: 37986179 Free PMC article. Review.
References
- Powers C, DeFilippis V, Malouli D, Früh K. Cytomegalovirus immune evasion. Curr Top Microbiol Immunol. 2008;325:333–359. - PubMed
MeSH terms
Substances
LinkOut - more resources
Full Text Sources
Other Literature Sources
Molecular Biology Databases


