Replacing American snacks with tree nuts increases consumption of key nutrients among US children and adults: results of an NHANES modeling study - PubMed (original) (raw)
Replacing American snacks with tree nuts increases consumption of key nutrients among US children and adults: results of an NHANES modeling study
Colin D Rehm et al. Nutr J. 2017.
Abstract
Background: Replacing typical American snacks with tree nuts may be an effective way to improve diet quality and compliance with the 2015-2020 Dietary Guidelines for Americans (DGAs).
Objective: To assess and quantify the impact of replacing typical snacks with composite tree nuts or almonds on diet metrics, including empty calories (i.e., added sugars and solid fats), individual fatty acids, macronutrients, nutrients of public health concern, including sodium, fiber and potassium, and summary measures of diet quality.
Methods: Food pattern modeling was implemented in the nationally representative 2009-2012 National Health and Examination Survey (NHANES) in a population of 17,444 children and adults. All between-meal snacks, excluding beverages, were replaced on a per calorie basis with a weighted tree nut composite, reflecting consumption patterns in the population. Model 1 replaced all snacks with tree nuts, while Model 2 exempted whole fruits, non-starchy vegetables, and whole grains (>50% of total grain content). Additional analyses were conducted using almonds only. Outcomes of interest were empty calories (i.e., solid fats and added sugars), saturated and mono- and polyunsaturated fatty acids, fiber, protein, sodium, potassium and magnesium. The Healthy Eating Index-2010, which measures adherence to the 2010 Dietary Guidelines for Americans, was used as a summary measure of diet quality.
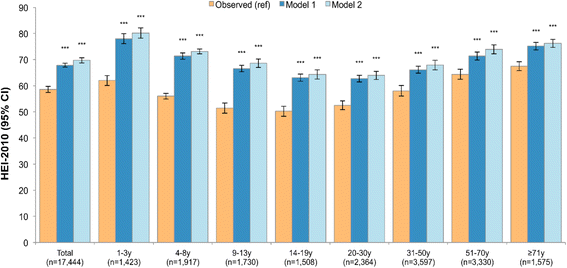
Results: Compared to observed diets, modeled food patterns were significantly lower in empty calories (-20.1% and -18.7% in Model 1 and Model 2, respectively), added sugars (-17.8% and -16.9%), solid fats (-21.0% and -19.3%), saturated fat (-6.6% and -7.1%)., and sodium (-12.3% and -11.2%). Modeled patterns were higher in oils (65.3% and 55.2%), monounsaturated (35.4% and 26.9%) and polyunsaturated fats (42.0% and 35.7%), plant omega 3 s (53.1% and 44.7%), dietary fiber (11.1% and 14.8%), and magnesium (29.9% and 27.0%), and were modestly higher in potassium (1.5% and 2.9%). HEI-2010 scores were significantly higher in Model 1 (67.8) and in Model 2 (69.7) compared to observed diets (58.5). Replacing snacks with almonds only produced similar results; the decrease in sodium was more modest and no increase in plant omega-3 fats was observed.
Conclusion: Replacing between-meal snacks with tree nuts or almonds led to more nutrient-rich diets that were lower in empty calories and sodium and had more favorable fatty acid profiles. Food pattern modeling using NHANES data can be used to assess the likely nutritional impact of dietary guidance.
Keywords: Diet quality; Nuts; Snacks.
Figures
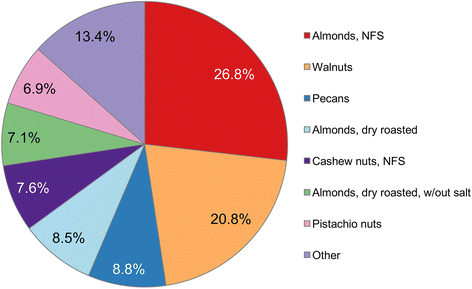
Fig. 1
Breakdown of composite tree nut. Value indicates the relative weight of each tree nut type. For example, “almonds, not formally specified” contributed 26.8% to the composite tree nut. Graph shows all tree nuts contributing more than 5%. Other nuts contributing between 1-5% include, cashews (dry roasted), almonds (unroasted), cashews (dry roasted, no salt), and almonds roasted
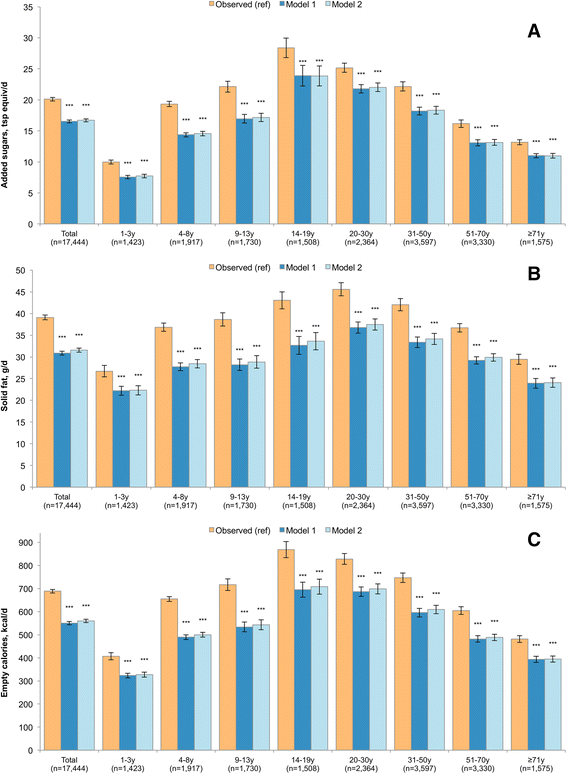
Fig. 2
Added sugars (Panel a), solid fats (Panel b) and energy from empty calories (Panel c) in observed and modeled diets, overall and by age group. Error bars are 95% confidence intervals. Model 1 is substitution of all solid snack foods with the composite tree nut and Model 2 is substitution of all solid foods except for whole fruit, non-starchy vegetables and foods where more than 50% of the total grain comes from whole grains. _P_-value of difference comparing each model to observed value is indicated by asterisk (***p < 0.001; **0.001 < _p_-value < 0.01; *0.05 < p < 0.01). Hypothesis testing comparing Model 1 to Model 2 was not conducted
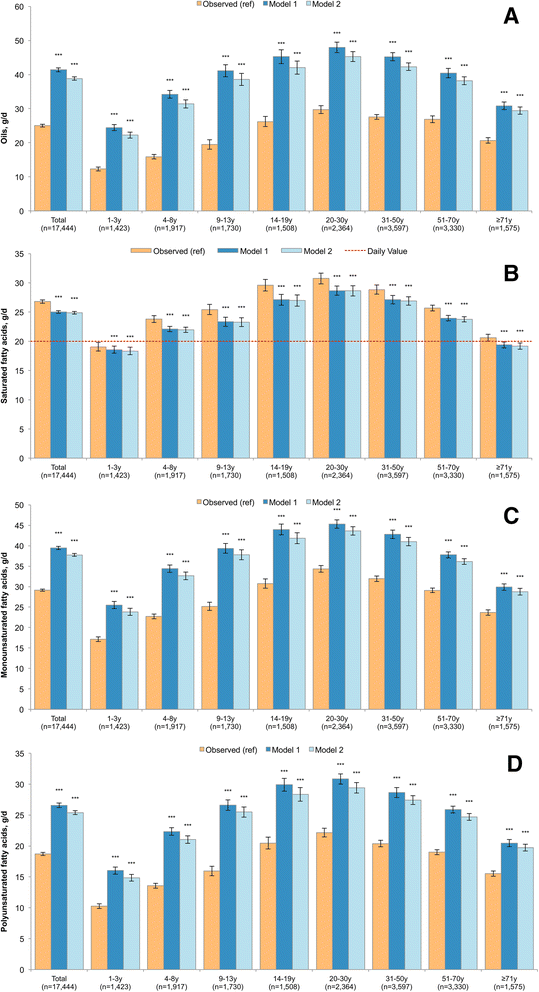
Fig. 3
Oils (Panel a), saturated fatty acids (Panel b), monounsaturated fatty acids (Panel c), and polyunsaturated fatty acids (Panel d) in observed and modeled diets, overall and by age group. Error bars are 95% confidence intervals. Model 1 is substitution of all solid snack foods with the composite tree nut and Model 2 is substitution of all solid foods except for whole fruit, non-starchy vegetables and foods where more than 50% of the total grain comes from whole grains. _P_-value of difference comparing each model to observed value is indicated by asterisk (***p < 0.001; **0.001 < _p_-value < 0.01; *0.05 < p < 0.01). Hypothesis testing comparing Model 1 to Model 2 was not conducted. A reference line is provided for saturated fatty acids, which corresponds to the Daily Value, commonly used on food labels. The Daily Value may not apply to children less than 4y and for pregnant or lactating women
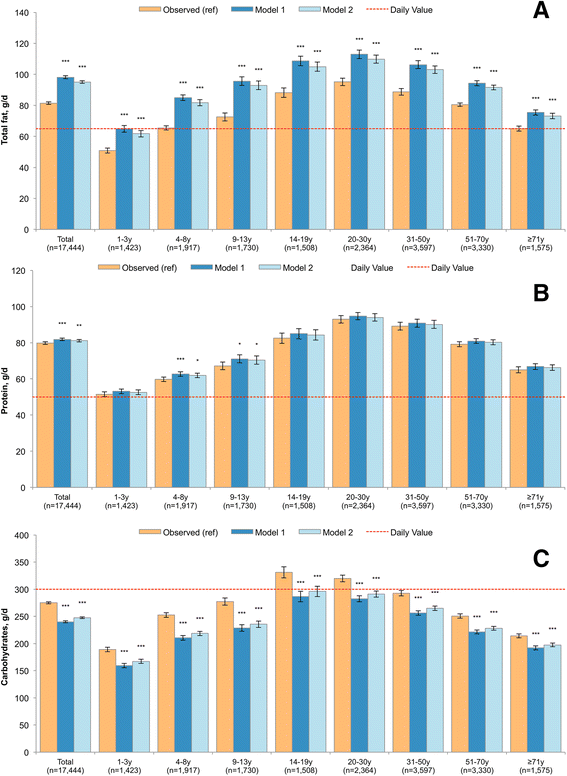
Fig. 4
Total fat (Panel a), protein (Panel b), total carbohydrates (Panel c) in modeled and observed diets, overall and by age group. Error bars are 95% confidence intervals. Model 1 is substitution of all solid snack foods with the composite tree nut and Model 2 is substitution of all solid foods except for whole fruit, non-starchy vegetables and foods where more than 50% of the total grain comes from whole grains. _P_-value of difference comparing each model to observed value is indicated by asterisk (***p < 0.001; **0.001 < _p_-value < 0.01; *0.05 < p < 0.01). Hypothesis testing comparing Model 1 to Model 2 was not conducted. A reference line is provided which corresponds to the Daily Value, commonly used on food labels. The Daily Value may not apply to children less than 4y and for pregnant or lactating women
Fig. 5
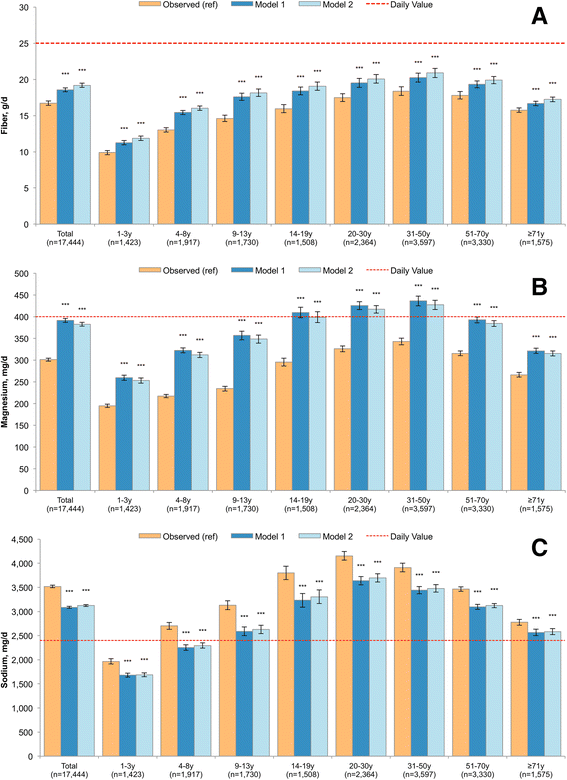
Dietary fiber (Panel a), magnesium (Panel b), and sodium (Panel c) in modeled and observed diets, overall and by age group. Error bars are 95% confidence intervals. Model 1 is substitution of all solid snack foods with the composite tree nut and Model 2 is substitution of all solid foods except for whole fruit, non-starchy vegetables and foods where more than 50% of the total grain comes from whole grains. _P_-value of difference comparing each model to observed value is indicated by asterisk (***p < 0.001; **0.001 < _p_-value < 0.01; *0.05 < p < 0.01). Hypothesis testing comparing Model 1 to Model 2 was not conducted. A reference line is provided which corresponds to the Daily Value, commonly used on food labels. The Daily Value may not apply to children less than 4y and for pregnant or lactating women
Fig. 6
Healthy Eating Index-2010 in modeled and observed diets, overall and by age group. Error bars are 95% confidence intervals. Model 1 is substitution of all solid snack foods with the composite tree nut and Model 2 is substitution of all solid foods except for whole fruit, non-starchy vegetables and foods where more than 50% of the total grain comes from whole grains. _P_-value of difference comparing each model to observed value is indicated by asterisk (***p < 0.001; **0.001 < _p_-value < 0.01; *0.05 < p < 0.01). Hypothesis testing comparing Model 1 to Model 2 was not conducted
Fig. 7
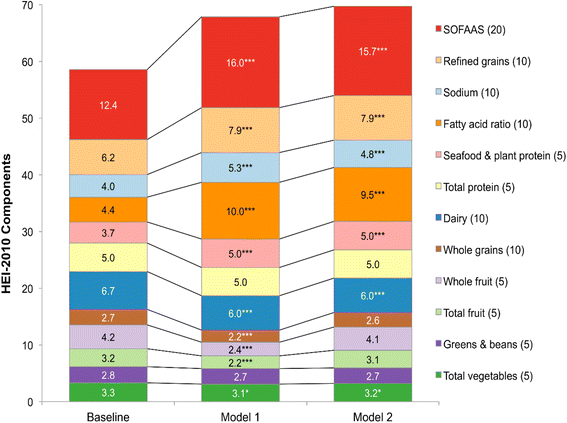
Healthy Eating Index-2010 components in modeled and observed diets. Model 1 is substitution of all solid snack foods with the composite tree nut and Model 2 is substitution of all solid foods except for whole fruit, non-starchy vegetables and foods where more than 50% of the total grain comes from whole grains. _P_-value of difference comparing each model to observed value is indicated by asterisk (***p < 0.001; **0.001 < _p_-value < 0.01; *0.05 < p < 0.01). Hypothesis testing comparing Model 1 to Model 2 was not conducted
Similar articles
- Nutrient intake, diet quality, and weight/adiposity parameters in breakfast patterns compared with no breakfast in adults: National Health and Nutrition Examination Survey 2001-2008.
O'Neil CE, Nicklas TA, Fulgoni VL 3rd. O'Neil CE, et al. J Acad Nutr Diet. 2014 Dec;114(12 Suppl):S27-43. doi: 10.1016/j.jand.2014.08.021. Epub 2014 Nov 24. J Acad Nutr Diet. 2014. PMID: 25458992 - Dietary Patterns during Pregnancy Are Associated with Risk of Gestational Diabetes Mellitus.
Shin D, Lee KW, Song WO. Shin D, et al. Nutrients. 2015 Nov 12;7(11):9369-82. doi: 10.3390/nu7115472. Nutrients. 2015. PMID: 26569302 Free PMC article. - Dietary Patterns and All-Cause Mortality: A Systematic Review [Internet].
Boushey C, Ard J, Bazzano L, Heymsfield S, Mayer-Davis E, Sabaté J, Snetselaar L, Van Horn L, Schneeman B, English LK, Bates M, Callahan E, Venkatramanan S, Butera G, Terry N, Obbagy J. Boushey C, et al. Alexandria (VA): USDA Nutrition Evidence Systematic Review; 2020 Jul. Alexandria (VA): USDA Nutrition Evidence Systematic Review; 2020 Jul. PMID: 35258870 Free Books & Documents. Review. - Development of the SoFAS (solid fats and added sugars) concept: the 2010 Dietary Guidelines for Americans.
Nicklas TA, O'Neil CE. Nicklas TA, et al. Adv Nutr. 2015 May 15;6(3):368S-75S. doi: 10.3945/an.114.007021. Print 2015 May. Adv Nutr. 2015. PMID: 25979510 Free PMC article. Review.
Cited by
- Snacking on Almonds Lowers Glycaemia and Energy Intake Compared to a Popular High-Carbohydrate Snack Food: An Acute Randomised Crossover Study.
Brown R, Ware L, Gray AR, Chisholm A, Tey SL. Brown R, et al. Int J Environ Res Public Health. 2021 Oct 19;18(20):10989. doi: 10.3390/ijerph182010989. Int J Environ Res Public Health. 2021. PMID: 34682735 Free PMC article. Clinical Trial. - An Updated Overview of Almond Allergens.
Bezerra M, Ribeiro M, Igrejas G. Bezerra M, et al. Nutrients. 2021 Jul 27;13(8):2578. doi: 10.3390/nu13082578. Nutrients. 2021. PMID: 34444737 Free PMC article. Review. - Changes in nut consumption influence long-term weight change in US men and women.
Liu X, Li Y, Guasch-Ferré M, Willett WC, Drouin-Chartier JP, Bhupathiraju SN, Tobias DK. Liu X, et al. BMJ Nutr Prev Health. 2019 Sep 23;2(2):90-99. doi: 10.1136/bmjnph-2019-000034. eCollection 2019. BMJ Nutr Prev Health. 2019. PMID: 33235963 Free PMC article. - The New Hybrid Nutrient Density Score NRFh 4:3:3 Tested in Relation to Affordable Nutrient Density and Healthy Eating Index 2015: Analyses of NHANES Data 2013-16.
Drewnowski A, Smith J, Fulgoni VL 3rd. Drewnowski A, et al. Nutrients. 2021 May 20;13(5):1734. doi: 10.3390/nu13051734. Nutrients. 2021. PMID: 34065287 Free PMC article. - Nuts and Cardiovascular Disease Prevention.
Coates AM, Hill AM, Tan SY. Coates AM, et al. Curr Atheroscler Rep. 2018 Aug 9;20(10):48. doi: 10.1007/s11883-018-0749-3. Curr Atheroscler Rep. 2018. PMID: 30094487 Review.
References
- Hickson DA, Diez Roux AV, Smith AE, Tucker KL, Gore LD, Zhang L, et al. Associations of fast food restaurant availability with dietary intake and weight among African americans in the Jackson heart study, 2000–2004. Am J Public Health. 2011;101(Sppl 1):S301–309. doi: 10.2105/AJPH.2010.300006. - DOI - PMC - PubMed
MeSH terms
Substances
LinkOut - more resources
Full Text Sources
Other Literature Sources
