Glycoproteins in Claudin-Low Breast Cancer Cell Lines Have a Unique Expression Profile - PubMed (original) (raw)
Glycoproteins in Claudin-Low Breast Cancer Cell Lines Have a Unique Expression Profile
Ten-Yang Yen et al. J Proteome Res. 2017.
Abstract
Claudin proteins are components of epithelial tight junctions; a subtype of breast cancer has been defined by the reduced expression of mRNA for claudins and other genes. Here, we characterize the expression of glycoproteins in breast cell lines for the claudin-low subtype using liquid chromatography/tandem mass spectrometry. Unsupervised clustering techniques reveal a group of claudin-low cell lines that is distinct from nonmalignant, basal, and luminal lines. The claudin-low cell lines express F11R, EPCAM, and other proteins at very low levels, whereas CD44 is expressed at a high level. Comparison of mRNA expression to glycoprotein expression shows modest correlation; the best agreement occurs when the mRNA expression level is lowest and little or no protein is detected. These findings from cell lines are compared to those for tumor samples by the Clinical Proteomic Tumor Analysis Consortium (CPTAC). The CPTAC samples contain a group low in CLDN3. The samples low in CLDN3 proteins share many differentially expressed glycoproteins with the claudin-low cell lines. In contrast to the situation for cell lines or patient samples classified as claudin-low by RNA expression, however, most of the tumor samples low in CLDN3 protein express the estrogen receptor or HER2. These tumor samples express CD44 protein at low rather than high levels. There is no correlation between CLDN3 gene expression and protein expression in these CPTAC samples; hence, the claudin-low subtype defined by gene expression is not the same group of tumors as that defined by low expression of CLDN3 protein.
Keywords: breast cancer; cell lines; claudin; glycoprotein; mass spectrometry; supervised classification.
Conflict of interest statement
Notes
The authors declare no competing financial interest.
Figures
Figure 1
Hierarchical clustering analysis of the 26 breast cancer cell lines. Color key: nonmalignant, green; claudin-low, violet; basal, blue; luminal, red.
Figure 2
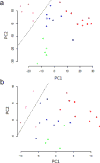
Principal components analysis of the cell lines. (a) Analysis using all 399 glycoproteins. The decision boundary separates the claudin-low cell lines from the others. (b) Principal components analysis using a random set of 50 glycoproteins. Color key: nonmalignant, green; basal, blue (HCC38 is the triangle, HCC1395 the diamond); claudin-low, violet; luminal, red. The asterisks correspond to cell lines that over-express HER2.
Figure 3
Frequency distribution for two-sample t statistics. The curve is the sum of two normal distributions with means of −1.63 and 0.82 and standard deviations of 0.77 and 0.61.
Figure 4
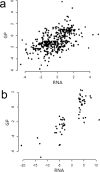
Relation between changes in expression of mRNA and glycoproteins. (a) Scatterplot of t statistics for mRNA and the claudin-low glycoproteins identified in this study. There are 391 proteins for which both mRNA and glycoprotein data are available. (b) Scatterplot of scores (logarithms of fold change) for differentially expressed mRNA from the nine cell line claudin-low predictor data set (Supplemental Data from Prat et al.) and t statistics for glycoproteins. There are 61 genes for which both mRNA and glycoprotein data are available.
Figure 5
Claudins and CD44 in a breast tumor data set (CPTAC). (a) Frequency distribution of CLDN3 and CLDN7 expression. The tail of 18 samples on the left of the CLDN3 data was used to identify the claudin-low samples. (b) Principal components plot. The claudin-low samples are identified by the violet symbols. (c) Association between CLDN3 and CD44.
Figure 6
Association between mRNA expression and protein expression for CLDN3 in the CPTAC data. The samples low in CLDN3 protein are identified by violet symbols.
Similar articles
- BRCA Mutation-Related and Claudin-Low Breast Cancer: Blood Relatives or Stepsisters.
Madaras L, Balint N, Gyorffy B, Tokes AM, Barshack I, Yosepovich A, Friedman E, Paluch-Shimon S, Zippel D, Baghy K, Timar J, Kovalszky I, Kulka J, Szasz AM. Madaras L, et al. Pathobiology. 2016;83(1):1-12. doi: 10.1159/000439135. Epub 2015 Nov 14. Pathobiology. 2016. PMID: 26566278 - Claudin expression in breast cancer: high or low, what to expect?
Ricardo S, Gerhard R, Cameselle-Teijeiro JF, Schmitt F, Paredes J. Ricardo S, et al. Histol Histopathol. 2012 Oct;27(10):1283-95. doi: 10.14670/HH-27.1283. Histol Histopathol. 2012. PMID: 22936447 - Phenotypic and molecular characterization of the claudin-low intrinsic subtype of breast cancer.
Prat A, Parker JS, Karginova O, Fan C, Livasy C, Herschkowitz JI, He X, Perou CM. Prat A, et al. Breast Cancer Res. 2010;12(5):R68. doi: 10.1186/bcr2635. Epub 2010 Sep 2. Breast Cancer Res. 2010. PMID: 20813035 Free PMC article. - A new class of protein cancer biomarker candidates: differentially expressed splice variants of ERBB2 (HER2/neu) and ERBB1 (EGFR) in breast cancer cell lines.
Omenn GS, Guan Y, Menon R. Omenn GS, et al. J Proteomics. 2014 Jul 31;107:103-12. doi: 10.1016/j.jprot.2014.04.012. Epub 2014 May 5. J Proteomics. 2014. PMID: 24802673 Free PMC article. Review. - [Is there a claudin-low phenotype of breast cancer?].
Popova OP, Kuznetsova AV, Bogomazova SY, Ivanov AA. Popova OP, et al. Arkh Patol. 2022;84(1):45-49. doi: 10.17116/patol20228401145. Arkh Patol. 2022. PMID: 35166478 Review. Russian.
Cited by
- The LQB-223 Compound Modulates Antiapoptotic Proteins and Impairs Breast Cancer Cell Growth and Migration.
Lemos LGT, Longo GMDC, Mendonça BDS, Robaina MC, Brum MCM, Cirilo CA, Gimba ERP, Costa PRR, Buarque CD, Nestal de Moraes G, Maia RC. Lemos LGT, et al. Int J Mol Sci. 2019 Oct 12;20(20):5063. doi: 10.3390/ijms20205063. Int J Mol Sci. 2019. PMID: 31614718 Free PMC article. - A computational workflow for predicting cancer neo-antigens.
Kasaragod S, Kotimoole CN, Gurtoo S, Keshava Prasad TS, Gowda H, Modi PK. Kasaragod S, et al. Bioinformation. 2022 Mar 31;18(3):214-218. doi: 10.6026/97320630018214. eCollection 2022. Bioinformation. 2022. PMID: 36518130 Free PMC article. - Expression of serine peptidase inhibitor Kunitz type 1 in differentiated thyroid cancer.
Liu CL, Yang PS, Chien MN, Chang YC, Lin CH, Cheng SP. Liu CL, et al. Histochem Cell Biol. 2018 Jun;149(6):635-644. doi: 10.1007/s00418-018-1660-2. Epub 2018 Mar 12. Histochem Cell Biol. 2018. PMID: 29532159 - Dynamic profiling of medulloblastoma surfaceome.
Bakhshinyan D, Suk Y, Kuhlmann L, Adile AA, Ignatchenko V, Custers S, Gwynne WD, Macklin A, Venugopal C, Kislinger T, Singh SK. Bakhshinyan D, et al. Acta Neuropathol Commun. 2023 Jul 10;11(1):111. doi: 10.1186/s40478-023-01609-7. Acta Neuropathol Commun. 2023. PMID: 37430373 Free PMC article.
References
- Perou CM, Sorlie T, Eisen MB, de Rijn van M, Jeffrey SS, Rees CA, Pollack JR, Ross DT, Johnsen H, Akslen LA, Fluge O, Pergamenschikov A, Williams C, Zhu SX, Lonning PE, Borresen-Dale AL, Brown PO, Botstein D. Molecular portraits of human breast tumours Nature. 2000;406(6797):747–52. - PubMed
- Sorlie T, Perou CM, Tibshirani R, Aas T, Geisler S, Johnsen H, Hastie T, Eisen MB, de Rijn van M, Jeffrey SS, Thorsen T, Quist H, Matese JC, Brown PO, Botstein D, Lonning PE, Borresen-Dale AL. Gene expression patterns of breast carcinomas distinguish tumor subclasses with clinical implications. Proc Natl Acad Sci U S A. 2001;98(19):10869–74. - PMC - PubMed
- Sorlie T, Tibshirani R, Parker J, Hastie T, Marron JS, Nobel A, Deng S, Johnsen H, Pesich R, Geisler S, Demeter J, Perou CM, Lonning PE, Brown PO, Borresen-Dale AL, Botstein D. Repeated observation of breast tumor subtypes in independent gene expression data sets. Proc Natl Acad Sci U S A. 2003;100(14):8418–23. - PMC - PubMed
- Guedj M, Marisa L, de Reynies A, Orsetti B, Schiappa R, Bibeau F, MacGrogan G, Lerebours F, Finetti P, Longy M, Bertheau P, Bertrand F, Bonnet F, Martin AL, Feugeas JP, Bieche I, Lehmann-Che J, Lidereau R, Birnbaum D, Bertucci F, de The H, Theillet C. A refined molecular taxonomy of breast cancer. Oncogene. 2012;31(9):1196–206. - PMC - PubMed
Publication types
MeSH terms
Substances
LinkOut - more resources
Full Text Sources
Other Literature Sources
Medical
Molecular Biology Databases
Research Materials
Miscellaneous


