TLR-exosomes exhibit distinct kinetics and effector function - PubMed (original) (raw)
TLR-exosomes exhibit distinct kinetics and effector function
Swetha Srinivasan et al. Sci Rep. 2017.
Abstract
The innate immune system is vital to rapidly responding to pathogens and Toll-like receptors (TLRs) are a critical component of this response. Nanovesicular exosomes play a role in immunity, but to date their exact contribution to the dissemination of the TLR response is unknown. Here we show that exosomes from TLR stimulated cells can largely recapitulate TLR activation in distal cells in vitro. We can abrogate the action-at-a-distance signaling of exosomes by UV irradiation, demonstrating that RNA is crucial for their effector function. We are the first to show that exosomes derived from poly(I:C) stimulated cells induce in vivo macrophage M1-like polarization within murine lymph nodes. These poly(I:C) exosomes demonstrate enhanced trafficking to the node and preferentially recruit neutrophils as compared to control exosomes. This work definitively establishes the differential effector function for exosomes in communicating the TLR activation state of the cell of origin.
Conflict of interest statement
The authors declare no competing financial interests.
Figures
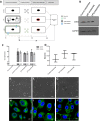
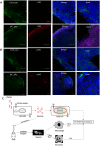
Figure 1. Experimental overview, biophysical and biochemical characterization of exosomes.
(A) Schematic showing experimental overview with local cells either unstimulated or directly stimulated with TLR agonists pIC and LPS for 6 hours. Exosomes are collected from the local cells and exposed to distal cells for 24 hours and then both local and distal cells are profiled by microarrays. (B) Western blots of CD81 and GAPDH protein expression on control-, pIC- and LPS-exosomes. The bands specific to CD81 and GAPDH is depicted here and the whole blots are shown in Supplementary Fig. 1a,b. (C) Expression of CD81 and CD63 on the surface of control, pIC and LPS exosomes as quantified by flow cytometry. (D) Size distribution profiles of control, pIC and LPS exosomes quantified on a Zetasizer. Scanning electron micrographs of (E) Control-exosomes, (F) pIC-exosomes and (G) LPS-exosomes showing characteristic spherical shape. Scale bars, 500 nm. Confocal images of distal cells showing uptake of PKH67 labeled. (H) Control-exosomes, (I) pIC-exosomes and (J) LPS-exosomes. Scale bars, 10 μm.
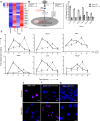
Figure 2. The LPS response in local and distal cells.
(A) Heatmap of selected inflammatory genes involved in LPS response in local cells at 6 hours and distal cells at 24 hours. (B) Classical LPS response pathway showing the key genes and inhibitors that establish the initial inflammatory phase and the subsequent refractory phase. (C) Distal cell gene expression after exposure to either LPS-exosomes or UV irradiated LPS-exosomes (24 hours post exosome addition). (D) Time course of gene expression comparing local cell response to LPS (solid line) against distal cell response to LPS-exosomes (dotted line) for the genes shown. Proximity ligation assay showing (E) NF-κB activation state in distal cells with LPS-exosome stimulation as measured by colocalization of p50-p65 subunits, (F) SIRT1 mediated inactivation of NF-κB after re-stimulating distal cells with 1 hour of LPS as measured by co-localization of NF-κB subunit p65 with SIRT1 co-localization and (G) inactivation of NF-κB by pretreating LPS-exosomes with UV. Scale bars, 20 μm.
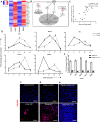
Figure 3. The pIC response in local and distal cells.
(A) Heatmap of selected antiviral genes involved in viral RNA response in local cells at 6 hours and distal cells at 24 hours. (B) Pathways of intracellular response to pIC showing both the cytoplasmic recognition pathway on the left and the endosomal pathway on the right. (C) Scatter plots showing the correlation between the fold change detected via qRT-PCR when compared to microarrays. (D) Time course of gene expression comparing local cell response to pIC (solid lines) against distal cell response to pIC-exosomes (dotted lines) for the genes shown. (E) Distal cell gene expression after exposure to either pIC-exosomes or UV irradiated pIC-exosomes (24 hours post exosome addition). Verifying NF-κB activation in (F) local cells treated with pIC for 6 hours, (G) distal cells treated with pIC-exosomes for 24 hours or (H) distal cells with UV treated pIC-exosomes for 24 hours confirming the co-localization of P50-P65 subunits using a proximity ligation assay. Scale bars, 50 μm.
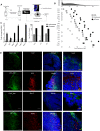
Figure 4. Effect of exosome uptake on macrophages.
(A) Schematic showing mouse study with injection of either PBS, control-, or pIC-exosomes locally followed by excision of distal draining lymph nodes, isolation of macrophages and analysis of macrophage gene expression by next generation sequencing. (B) Relative expression of key M1 and housekeeping genes in macrophages after exposure to PBS, control- or pIC-exosomes. (C) Validation of key M1 genes in macrophages with control- or pIC-exosomes as compared to PBS by qRT-PCR. (D) Validation of M1 markers Nos2 and Il12 expression in lymph node sections after exposure to control- or pIC-exosomes. White scale bars, 50 μm, yellow scale bars, 10 μm.
Figure 5. Impact of lymphatic trafficking of exosomes on draining lymph node retention.
(A) Kinetics of lymphatic vessel transport comparing control- and pIC-exosome trafficking in the dominant and non-dominant vessels. (B) Comparison of kinetics of draining lymph node retention of control- and pIC-exosomes in dominant and non-dominant nodes. (C) Lymphatic packet transport of control- and pIC-exosomes. (D) Schematic of experiment showing PBS, control- or pIC-exosomes in mouse tail, followed by lymph node extraction at 48 hours followed by RNA-Seq of whole lymph nodes. (E) Pathway analysis showing pathways enriched in pIC-exosomes in whole nodes with respect to PBS and (F) Relative expression of key neutrophil markers in whole lymph nodes after exposure to PBS, control- or pIC-exosomes. (G) Model of TLR-exosome action showing transmittance of local cell TLR activation to distal cells resulting in a pro-inflammatory response both in vitro and in vivo.
Figure 6. Validation of neutrophil recruitment to node.
(A) Immunohistochemistry of lymph node sections showing increase of neutrophil markers after pIC exosome uptake (A) GR1 expression and (B) Ly6G expression after control and pIC exosome uptake. (C) Model of exosome action showing transmittance of local cell TLR activation to distal cells resulting in a pro-inflammatory response both in vitro and in vivo.
Similar articles
- Systematic Investigation of Multi-TLR Sensing Identifies Regulators of Sustained Gene Activation in Macrophages.
Lin B, Dutta B, Fraser IDC. Lin B, et al. Cell Syst. 2017 Jul 26;5(1):25-37.e3. doi: 10.1016/j.cels.2017.06.014. Cell Syst. 2017. PMID: 28750197 Free PMC article. - RhoB induces the production of proinflammatory cytokines in TLR-triggered macrophages.
Liu S, Huang L, Lin Z, Hu Y, Chen R, Wang L, Shan Y. Liu S, et al. Mol Immunol. 2017 Jul;87:200-206. doi: 10.1016/j.molimm.2017.04.015. Epub 2017 May 12. Mol Immunol. 2017. PMID: 28505515 - Exosomes: Potential Therapies for Disease via Regulating TLRs.
Guo HY, Cheng AC, Wang MS, Yin ZQ, Jia RY. Guo HY, et al. Mediators Inflamm. 2020 May 27;2020:2319616. doi: 10.1155/2020/2319616. eCollection 2020. Mediators Inflamm. 2020. PMID: 32565722 Free PMC article. Review. - [Innate immunity: structure and function of TLRs].
Delneste Y, Beauvillain C, Jeannin P. Delneste Y, et al. Med Sci (Paris). 2007 Jan;23(1):67-73. doi: 10.1051/medsci/200723167. Med Sci (Paris). 2007. PMID: 17212934 French. - Epigenetic Mechanisms Governing Innate Inflammatory Responses.
Perkins DJ, Patel MC, Blanco JC, Vogel SN. Perkins DJ, et al. J Interferon Cytokine Res. 2016 Jul;36(7):454-61. doi: 10.1089/jir.2016.0003. J Interferon Cytokine Res. 2016. PMID: 27379867 Free PMC article. Review.
Cited by
- Update on the role of extracellular vesicles in rheumatoid arthritis.
Miao HB, Wang F, Lin S, Chen Z. Miao HB, et al. Expert Rev Mol Med. 2022 Mar 17;24:e12. doi: 10.1017/erm.2021.33. Expert Rev Mol Med. 2022. PMID: 35297366 Free PMC article. Review. - Biological membranes in EV biogenesis, stability, uptake, and cargo transfer: an ISEV position paper arising from the ISEV membranes and EVs workshop.
Russell AE, Sneider A, Witwer KW, Bergese P, Bhattacharyya SN, Cocks A, Cocucci E, Erdbrügger U, Falcon-Perez JM, Freeman DW, Gallagher TM, Hu S, Huang Y, Jay SM, Kano SI, Lavieu G, Leszczynska A, Llorente AM, Lu Q, Mahairaki V, Muth DC, Noren Hooten N, Ostrowski M, Prada I, Sahoo S, Schøyen TH, Sheng L, Tesch D, Van Niel G, Vandenbroucke RE, Verweij FJ, Villar AV, Wauben M, Wehman AM, Yin H, Carter DRF, Vader P. Russell AE, et al. J Extracell Vesicles. 2019 Nov 8;8(1):1684862. doi: 10.1080/20013078.2019.1684862. eCollection 2019. J Extracell Vesicles. 2019. PMID: 31762963 Free PMC article. - Dynamics of inflammatory cytokine expression in bovine endometrial cells exposed to cow blood plasma small extracellular vesicles (sEV) may reflect high fertility.
Abeysinghe P, Turner N, Mosaad E, Logan J, Mitchell MD. Abeysinghe P, et al. Sci Rep. 2023 Apr 3;13(1):5425. doi: 10.1038/s41598-023-32045-1. Sci Rep. 2023. PMID: 37012302 Free PMC article. - Data normalization considerations for digital tumor dissection.
Newman AM, Gentles AJ, Liu CL, Diehn M, Alizadeh AA. Newman AM, et al. Genome Biol. 2017 Jul 5;18(1):128. doi: 10.1186/s13059-017-1257-4. Genome Biol. 2017. PMID: 28679399 Free PMC article. - Lymphatic Vessel Network Structure and Physiology.
Breslin JW, Yang Y, Scallan JP, Sweat RS, Adderley SP, Murfee WL. Breslin JW, et al. Compr Physiol. 2018 Dec 13;9(1):207-299. doi: 10.1002/cphy.c180015. Compr Physiol. 2018. PMID: 30549020 Free PMC article. Review.
References
Publication types
MeSH terms
Substances
LinkOut - more resources
Full Text Sources
Other Literature Sources
Molecular Biology Databases
