TGF-β triggers rapid fibrillogenesis via a novel TβRII-dependent fibronectin-trafficking mechanism - PubMed (original) (raw)
TGF-β triggers rapid fibrillogenesis via a novel TβRII-dependent fibronectin-trafficking mechanism
Archana Varadaraj et al. Mol Biol Cell. 2017.
Abstract
Fibronectin (FN) is a critical regulator of extracellular matrix (ECM) remodeling through its availability and stepwise polymerization for fibrillogenesis. Availability of FN is regulated by its synthesis and turnover, and fibrillogenesis is a multistep, integrin-dependent process essential for cell migration, proliferation, and tissue function. Transforming growth factor β (TGF-β) is an established regulator of ECM remodeling via transcriptional control of ECM proteins. Here we show that TGF-β, through increased FN trafficking in a transcription- and SMAD-independent manner, is a direct and rapid inducer of the fibrillogenesis required for TGF-β-induced cell migration. Whereas TGF-β signaling is dispensable for rapid fibrillogenesis, stable interactions between the cytoplasmic domain of the type II TGF-β receptor (TβRII) and the FN receptor (α5β1 integrin) are required. We find that, in response to TGF-β, cell surface-internalized FN is not degraded by the lysosome but instead undergoes recycling and incorporation into fibrils, a process dependent on TβRII. These findings are the first to show direct use of trafficked and recycled FN for fibrillogenesis, with a striking role for TGF-β in this process. Given the significant physiological consequences associated with FN availability and polymerization, our findings provide new insights into the regulation of fibrillogenesis for cellular homeostasis.
© 2017 Varadaraj et al. This article is distributed by The American Society for Cell Biology under license from the author(s). Two months after publication it is available to the public under an Attribution–Noncommercial–Share Alike 3.0 Unported Creative Commons License (http://creativecommons.org/licenses/by-nc-sa/3.0).
Figures
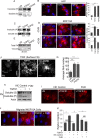
FIGURE 1:
TGF-β1 and TGF-β2 rapidly increase fibrillogenesis. (A, B) HFFs were treated with TGF-β1 or TGF-β2 for 30 min and (A) DOC extraction used to fractionate DOC-soluble (S) and -insoluble (pellet (P)) pool and immunoblotted for FN, or (B) cells were immunostained using anti-FN. Right, average fibril number (Materials and Methods) in untreated (UN), TGF-β1–, or TGF-β2–treated cells. Fibril lengths were tracked using the NeuronJ plug-in on ImageJ. (Materials and Methods). (C) MCF10A cells treated with TGF-β1 or TGF-β2 for 30 min and processed for DOC extraction and immunoblotted for (S) and (P) FN as in A. (D) MCF10A cells untreated or treated with 10 ng/ml TGF-β1 or TGF-β2 for 30 min (with or without preincubation with 20 µg/ml CHX for 2 h) and immunostained for endogenous FN. Right, average fibril number in untreated (UN), TGF-β1–, or TGF-β2–treated cells. Fibril lengths were tracked using the NeuronJ plug-in on ImageJ. Scale bar, 5 μm. (E) Total MCF10A cell lysates at the indicated treatment times were lysed in SDS buffer to solubilize total FN pools ((S) and (P) combined) and immunoblotted against FN. Vinculin was used as the loading control. (F) Cells treated as in A and imaged using TIRF microscopy (penetration depth, 110 nm). Scale bar, 5 μm. (G) Average fibril number analyzed from TIRF images in untreated (UN), TGF-β1–, or TGF-β2–treated cells. Fibril lengths from F were tracked using the NeuronJ plug-in on ImageJ. (H, I) MCF10A cells were treated with 10 ng/ml TGF-β1 for 30 min (with or without 500 nM FUD peptide or the matched control IIIC peptide) and processed either (H) for DOC extraction and immunoblotting for (S) and (P) FN (actin was the loading control from the soluble pool) or (I) immunostained for FN. (J) MCF10A cells allowed to migrate for 6 h in the presence of Rh-FN as indicated in the figure. Migrated cells are captured by fixing the cells on the Transwell filter. Images of Rh-FN are representative of at least four different fields on the filter from two independent biological trials. Scale bar, 5 µm. (K) Transwell migration through FN-coated Transwells of MCF10A for 12 h either untreated or in the presence of TGF-β1 alone or with either control IIIC peptide or FUD peptide as in J and as indicated. Migrated cells were counted and plotted relative to untreated filters. Asterisks indicate significant differences as indicated (*p < 0.05, **p < 0.01, ***p < 0.001). Quantitation of blots is representative of a minimum of three independent trials.
FIGURE 2:
TβRII is required for fibrillogenesis. (A) MCF10A cells were preincubated with 3 μM SB431542 for 30 min before treatment with 10 ng/ml TGF-β1 for 30 min. Lysates were DOC fractionated and immunoblotted for FN. Actin was the loading control for the (S) fraction. (B, C) Either (B) Mink lung epithelial cells MV1Lu (wild type [WT] for type I, II, III TGF-β receptors), R1b (WT for type II, III), and DR (WT for type III)) were immunostained for FN or (C) cell lysates were DOC fractionated and immunoblotted for FN in the soluble (S) and insoluble (P) pools. Arrowheads indicate short fibrils and focal contacts. Scale bar, 5 µm. Immunoblot below in C shows total FN levels ((S) and (P) fractions combined) in the Mink lung cell lines. Vinculin was the loading control. (D) TβRII levels in MCF10A cells transfected with shRNAs to TβRII (shTβRII-1 and 2) or shScr to examine efficacy of knockdown. (E) Indicated MCF10A cells were treated with TGF-β1 (10 ng/ml for 30 min), DOC extracted into the (S) and (P) fractions, and immunoblotted for FN. Numbers for soluble (S) fraction are normalized to actin and pellet (P) relative to the normalized soluble pool in untreated conditions. Quantitation of blots is representative of three independent trials. (F) Cells transfected with shRNAs to TβRII (shTβRII-1 and 2) or shScr were left untreated or treated with TGF-β1 (10 ng/ml for 30 min) and immunostained for FN. Representative images. Scale bar, 3.7 µm. (G) Percentage of fibril-containing cells in the indicated conditions were quantified and plotted. Asterisks indicate significant differences (t test) between untreated and TGF-β1–treated samples in shScr transfectants (*p < 0.001) and between untreated and TGF-β1–treated samples in shTβRII (shTβRII-1 and 2) transfectants (*p < 0.001). Data are representative of two independent experiments.
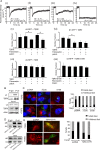
FIGURE 3:
TβRII’s cytoplasmic domain is required for steady-state interactions with integrin α5β1 and fibrillogenesis. (A) COS7 cells were cotransfected with expression vectors encoding myc-TβRII, myc-TβRII S199, or myc-TβRI and integrin α5-RFP or β1-GFP. In control experiments, the integrin construct was replaced by empty vector. At 48 h after transfection, live cells were incubated without or with FN and subjected (or not) to IgG-mediated patching/cross-linking of myc-TβRII or myc-TβRI (Materials and Methods), resulting in Alexa 488 (or 546)–labeled myc–TGF-β receptor patched and laterally immobile (iv). In control experiments without cross-linking, the IgG labeling of the myc-TGF-β receptor was replaced by exclusive Fab’ labeling (replacing the cross-linking IgGs by their respective Fab’ fragments). FRAP studies were conducted on integrin α5–RFP or β1–GFP at 15°C to minimize internalization. The confocal nature of the FRAP experimental setup enabled the measurement of integrin fluorescence recovery exclusively at the plasma membrane (avoiding internal vesicles or ER fluorescence). The laser beam was focused on the upper cell surface and away from cell edges, thus avoiding focal adhesions. Solid lines are the best fit of a nonlinear regression analysis to the lateral diffusion equation (Rechtman et al., 2009). (i) Representative FRAP curve of the lateral diffusion of integrin α5-RFP in a cell coexpressing myc-TβRII (no IgG cross-linking). (ii) A FRAP curve of integrin α5-RFP in a cell coexpressing myc-TβRII immobilized by IgG cross-linking. (iii) A FRAP curve of the lateral diffusion of myc-TβRII. (iv) A FRAP curve of the lateral diffusion of myc-TβRII immobilized by IgG cross-linking. (v–viii) Average Rf values derived from multiple patch/FRAP measurements (coexpressed receptor pairs are indicated above each graph). Because the D values were unaffected in all cases (0.1 ± 0.02 μm2/s), they are not shown. Bars are mean ± SEM of 30–50 measurements in each case. Asterisks indicate significant differences between the Rf values of the pair indicated by brackets (*p < 0.001; Student’s _t_ test). (B) MCF10A cells were immunoprecipitated with integrin α5 antibody or IgG as control and immunoblotted as indicated for endogenous TβRII and integrin α5. Input loading control was actin. (C) MCF10A cells transfected with empty vector or TβRII ∆Cyto or TβRII S199 were treated with TGFβ1 (10 ng/ml for 30 min) and coimmunostained using anti-HA (green) to identify transfected cells and anti-FN to endogenous FN (red). Scale bar, 5 µm. Quantitation of percentage of fibril-containing cells (_Materials and Methods_) in the indicated conditions; _N_ > 200. (D) COS7 cells transfected for 48 h with indicated TβRII constructs followed by immunoprecipitation with anti-α5 antibody and immunoblotted using either anti-HA or anti-α5 as indicated. (E) MCF10A cells transfected with empty vector or TβRII K277R were treated with TGFβ1 (10 ng/ml for 30 min) and coimmunostained using anti-HA (green) to identify transfected cells and anti-FN to endogenous FN (red). Scale bar, 4 µm. Quantitation of percentage of fibril-containing cells (Materials and Methods) in the indicated conditions; N > 50.
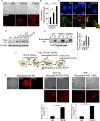
FIGURE 4:
TGF-β increases FN internalization and recycling for fibrillogenesis. (A) Rh-FN at 20 µg/ml was added to MCF10A cells either untreated or in the presence of TGF-β1 and TGF-β2 for 30 min, followed by stripping of cell surface Rh-FN (Materials and Methods). Representative fluorescence images of Rh-FN. Scale bar, 5 µm. Arrows indicate internalized Rh-FN. (B) Quantification of integrated fluorescence intensity of Rh-FN normalized to cell area from cells in A; N > 100/condition. Significance was calculated between untreated samples and TGF-β1– (*p < 0.05) and TGF-β2–treated (**p < 0.01) samples using the Mann–Whitney U test. Data are representative of at least three independent experiments. (C) MCF10A cells treated with TGF-β1/TGF-β2 (10 ng/ml, 30 min) were coimmunostained using anti-LAMP1 and anti-FN; images acquired using confocal microscopy. Scale bar, 5 µm. (D) MCF10A cells were treated with TGF-β1 or TGF-β2 for 6 h with or without 100 µM CQ. Lysates were immunoblotted for total FN. Vinculin was used as loading control. (E) Representative DOC-fractionated biotinylated FN (FN-biotin; Materials and Methods) in MCF10A cells. FN-biotin at 20 µg/ml was added to cells for 30 min and washed to remove nonspecific FN-biotin binding on the cell surface. The cells were then reincubated in FN-biotin–free medium for 1 h with or without TGF-β1 or TGF-β2, DOC fractionated into (S) and (P) fractions, and immunoblotted using streptavidin-conjugated IR dye to detect FN-biotin. Actin was used as the loading control for the (S) fraction. Right, quantitation showing fold difference between the amounts of FN-biotin in the DOC-fractionated (P) fraction in untreated and TGF-β1– or TGF-β2–treated cells. Data represent quantitation from two independent experiments. Error bars represent SEM. (F) Schematic of the recycling assay using Rh-FN upon incubation of cells with 20 µg/ml Rh-FN for 30 min at 37°C in the absence of TGF-β1 or TGF-β2. Cells are acid stripped to remove surface-bound Rh-FN (Internalized Rh-FN), followed by reincubation of cells in Rh-FN–free medium at 37°C for 1 h in the presence of TGF-β1 or TGF-β2. (G) Recycling assay as described in F; left, Rh-FN internalized by cells imaged after acid stripping using the Epi illumination and TIRF modes (90-nm penetration depth) as indicated to confirm removal of cell surface Rh-FN. Right, images taken under TIRF mode in either MCF10A or HFF cells, showing the reappearance of surface FN in cells untreated or treated with TGF-β1. Images are representative of at least three independent trials. Scale bar, 5 µm. Quantitation presented below was carried out using the 3D object counter on ImageJ as described in Materials and Methods after subtracting background from the cell-free regions. N = 10/condition. ***p < 0.001.
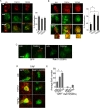
FIGURE 5:
FN recycling and fibrillogenesis require the recycling protein Rab11. (A, B) MCF10A cells either untreated (serum alone) or treated with TGF-β1/TGF-β2 (10 ng/ml for 30 min) were coimmunostained using anti-FN and either (A) anti-Arf6 or (B) anti-Rab11 and imaged using confocal microscopy. Scale bar, 5 µm (main image), 1 µm (inset). Percentage colocalization from A and B was determined using the Coloc2 plug-in in ImageJ (Materials and Methods) from single _z_-plane between FN and either Arf6 or Rab11 in untreated compared with TGF-β1– or TGF-β2–treated cells. Asterisk indicates significant differences in percentage colocalization (N > 15) between untreated compared with TGF-β1– or TGF-β2–treated cells (*p < 0.001, t test). Images are representative of at least three independent experiments. (C) Recycling assay as described in Figure 4F in the presence of Rh-FN in pEGFP and Rab11 (S25N)-GFP–transfected MCF10A cells. Cells either untreated (UN) or treated with 10 ng/ml TGF-β1 for 30 min were imaged. Only constructs expressing EGFP or Rab11(S25N)-GFP (as monitored by GFP expression) were imaged, and representative images are presented showing abrogated recycling of Rh-FN in Rab11 (S25N) transfectants. Arrowheads indicate fibrils. Scale bar, 2 µm. (D) MCF10A cells were transfected with pEGFP or Rab11 (S25N)-GFP as in C, immunostained using anti-FN after treatments with TGF-β1 or TGF-β2 (10 ng/ml for 30 min), and imaged using TIRF microscopy (penetration depth, 110 nm). Scale bar, 5 µm. (E) Average fibril number/cell analyzed as described in Materials and Methods from TIRF images in GFP and Rab11 (S25N) mutants in untreated (UN) cells or cells treated with TGF-β1 or TGF-β2. Fibril lengths were tracked using the NeuronJ plug-in on ImageJ. Asterisk indicates significant differences (N = 10 [ANOVA]) in fibril number between untreated GFP transfectants for untreated (UN) cells and cells treated with TGF-β1 or TGF-β2 (*p < 0.001).
Similar articles
- ILK supports RhoA/ROCK-mediated contractility of human intestinal epithelial crypt cells by inducing the fibrillogenesis of endogenous soluble fibronectin during the spreading process.
Gagné D, Benoit YD, Groulx JF, Vachon PH, Beaulieu JF. Gagné D, et al. BMC Mol Cell Biol. 2020 Mar 17;21(1):14. doi: 10.1186/s12860-020-00259-0. BMC Mol Cell Biol. 2020. PMID: 32183701 Free PMC article. - Reduction of fibroblast size/mechanical force down-regulates TGF-β type II receptor: implications for human skin aging.
Fisher GJ, Shao Y, He T, Qin Z, Perry D, Voorhees JJ, Quan T. Fisher GJ, et al. Aging Cell. 2016 Feb;15(1):67-76. doi: 10.1111/acel.12410. Epub 2015 Oct 8. Aging Cell. 2016. PMID: 26780887 Free PMC article. - Transforming growth factor-β signalling: role and consequences of Smad linker region phosphorylation.
Kamato D, Burch ML, Piva TJ, Rezaei HB, Rostam MA, Xu S, Zheng W, Little PJ, Osman N. Kamato D, et al. Cell Signal. 2013 Oct;25(10):2017-24. doi: 10.1016/j.cellsig.2013.06.001. Epub 2013 Jun 11. Cell Signal. 2013. PMID: 23770288 Review. - Fibronectin: Molecular Structure, Fibrillar Structure and Mechanochemical Signaling.
Dalton CJ, Lemmon CA. Dalton CJ, et al. Cells. 2021 Sep 16;10(9):2443. doi: 10.3390/cells10092443. Cells. 2021. PMID: 34572092 Free PMC article. Review.
Cited by
- Fibronectin as a multiregulatory molecule crucial in tumor matrisome: from structural and functional features to clinical practice in oncology.
Spada S, Tocci A, Di Modugno F, Nisticò P. Spada S, et al. J Exp Clin Cancer Res. 2021 Mar 17;40(1):102. doi: 10.1186/s13046-021-01908-8. J Exp Clin Cancer Res. 2021. PMID: 33731188 Free PMC article. Review. - AGAP2: Modulating TGFβ1-Signaling in the Regulation of Liver Fibrosis.
Navarro-Corcuera A, Ansorena E, Montiel-Duarte C, Iraburu MJ. Navarro-Corcuera A, et al. Int J Mol Sci. 2020 Feb 19;21(4):1400. doi: 10.3390/ijms21041400. Int J Mol Sci. 2020. PMID: 32092977 Free PMC article. Review. - Interplay between Cell-Surface Receptors and Extracellular Matrix in Skin.
Kleiser S, Nyström A. Kleiser S, et al. Biomolecules. 2020 Aug 11;10(8):1170. doi: 10.3390/biom10081170. Biomolecules. 2020. PMID: 32796709 Free PMC article. Review. - BKCa Mediates Dysfunction in High Glucose Induced Mesangial Cell Injury via TGF-_β_1/Smad2/3 Signaling Pathways.
Wu Z, Yin W, Sun M, Si Y, Wu X, Chen M. Wu Z, et al. Int J Endocrinol. 2020 Apr 29;2020:3260728. doi: 10.1155/2020/3260728. eCollection 2020. Int J Endocrinol. 2020. PMID: 32411221 Free PMC article. - Differential regulation of fibronectin expression and fibrillogenesis by autocrine TGF-β1 signaling in malignant and benign mammary epithelial cells.
Sofroniou MM, Lemmon CA. Sofroniou MM, et al. Int J Biochem Cell Biol. 2023 Dec;165:106478. doi: 10.1016/j.biocel.2023.106478. Epub 2023 Oct 21. Int J Biochem Cell Biol. 2023. PMID: 37866655 Free PMC article.
References
- Abraham LC, Vorrasi J, Kaplan DL. Impact of collagen structure on matrix trafficking by human fibroblasts. J Biomed Mater Res A. 2004;70:39–48. - PubMed
- Anders RA, Dore JJ, Jr, Arline SL, Garamszegi N, Leof EB. Differential requirement for type I and type II transforming growth factor beta receptor kinase activity in ligand-mediated receptor endocytosis. J Biol Chem. 1998;273:23118–23125. - PubMed
- Bhatia R, Munthe HA, Verfaillie CM. Role of abnormal integrin-cytoskeletal interactions in impaired beta1 integrin function in chronic myelogenous leukemia hematopoietic progenitors. Exp Hematol. 1999;27:1384–1396. - PubMed
MeSH terms
Substances
LinkOut - more resources
Full Text Sources
Other Literature Sources
Research Materials
Miscellaneous


