Defects in ER-endosome contacts impact lysosome function in hereditary spastic paraplegia - PubMed (original) (raw)
. 2017 May 1;216(5):1337-1355.
doi: 10.1083/jcb.201609033. Epub 2017 Apr 7.
James R Edgar 1 3, Guy Pearson 1 2, Tania Rizo 4, Timothy Newton 1 2, Sven Günther 5, Fiamma Berner 1, Jennifer Hague 1 2, James W Connell 1 2, Jürgen Winkler 6, Jennifer Lippincott-Schwartz 7, Christian Beetz 5, Beate Winner 4 8, Evan Reid 9 2
Affiliations
- PMID: 28389476
- PMCID: PMC5412567
- DOI: 10.1083/jcb.201609033
Defects in ER-endosome contacts impact lysosome function in hereditary spastic paraplegia
Rachel Allison et al. J Cell Biol. 2017.
Abstract
Contacts between endosomes and the endoplasmic reticulum (ER) promote endosomal tubule fission, but the mechanisms involved and consequences of tubule fission failure are incompletely understood. We found that interaction between the microtubule-severing enzyme spastin and the ESCRT protein IST1 at ER-endosome contacts drives endosomal tubule fission. Failure of fission caused defective sorting of mannose 6-phosphate receptor, with consequently disrupted lysosomal enzyme trafficking and abnormal lysosomal morphology, including in mouse primary neurons and human stem cell-derived neurons. Consistent with a role for ER-mediated endosomal tubule fission in lysosome function, similar lysosomal abnormalities were seen in cellular models lacking the WASH complex component strumpellin or the ER morphogen REEP1. Mutations in spastin, strumpellin, or REEP1 cause hereditary spastic paraplegia (HSP), a disease characterized by axonal degeneration. Our results implicate failure of the ER-endosome contact process in axonopathy and suggest that coupling of ER-mediated endosomal tubule fission to lysosome function links different classes of HSP proteins, previously considered functionally distinct, into a unifying pathway for axonal degeneration.
© 2017 Allison et al.
Figures
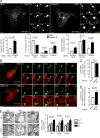
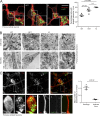
Figure 1.
Spastin promotes endosomal tubule fission at ER tubules. (A) Stills from Video 1 of MRC5 cells stably expressing GFP-SNX1, showing tubule fission in control cell or cell depleted of spastin by siRNA knockdown (KD). The main panels show an overview of the cell; the small panels illustrate a single fission event. Yellow arrowheads track the tip of the elongating endosomal tubule and the fissioned domain. Time 0 corresponds to the frame in which the tubules first emerge. Corresponding histograms show mean tubule duration (left), mean percentage of tubules with different fates (middle), and duration of tubules with each fate (right). left, n = 6 experiments; middle and right, n = 5; see Materials and methods for numbers of tubules analyzed in these and subsequent live cell experiments. Bars in small panels, 2 µm. (B) Stills from Video 3 of MRC5 cells stably expressing GFP-SNX1 and transiently expressing RFP-KDEL, showing mock-transfected (top) or spastin KD (bottom) cell. The main panels show an overview of the cell; the small panels illustrate a single fission event. White arrowhead marks approximate site of fission. Time 0 corresponds to the frame in which the tubules first emerge. Bars in small panels, 1 μm. The corresponding histograms show percentage of fission events occurring at site of ER tubule overlap (C) and the duration of overlap between ER and endosomal tubule before breakage or collapse (D); n = 3 experiments. (E) EM of early endosome (EE) and multivesicular body (MVB) structures in MEFs from spastinwt/wt (WT), spastinwt/N384K (HET), and spastinN384K/N384K (KI) animals. Arrows indicate points of ER contact, and the mean number of contacts is quantified (pooled, EE and MVB results combined). n = 3 experimental repeats. See Materials and methods for number of structures analyzed. Bars: (light micrographs, large panels) 10 µm; (EM) 500 nm. All histograms show mean ± SEM. P-values generated by two-tailed Student’s t test (A, C, and D) or ANOVA for effect of genotype (E).
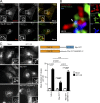
Figure 2.
Spastin–IST1 interaction drives endosomal tubule fission. (A) Wild-type HeLa cells or HeLa cells stably expressing Myc-M1-spastin were imaged by confocal immunofluorescence microscopy (IF) with the antibodies indicated. Arrowheads indicate colocalized puncta. In cells labeled with endogenous spastin, soluble cytosolic signal was removed using a prefixation cytosol extraction buffer. (B) MRC5 cells stably expressing GFP-M1 spastin and mCherry-SNX1 were labeled with IST1 and GFP antibodies and imaged with Airyscan IF. Small panels show individual channels. Arrowheads indicate a region of colocalization between IST1 and spastin at the base of a SNX1 tubule. (C) Wild-type HeLa cells or cells expressing the siRNA-resistant proteins indicated (see schematic) were subjected to endogenous IST1 KD, then fixed and visualized by IF for endogenous SNX1. Mean ± SEM number per cell of SNX1 tubules >2 µm long is shown in the histogram (n = 5). Bars: (A and C, main image) 10 µm; (A and C, magnified insets) 5 µm; (B) 500 nm. P-values generated by two-tailed Student’s t test.
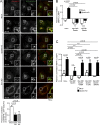
Figure 3.
Spastin and IST1 regulate endosome-to-Golgi traffic. (A) Anti-CD8 antibody uptake experiments in HeLa cells stably expressing CD8-ciM6PR and GFP-GOLPH3 (a Golgi marker), and subjected to IST1 or spastin KD. Cells were fixed at the times indicated, and CD8 and GFP signal were visualized by confocal immunofluorescence microscopy. Mean ± SEM colocalization between the markers (Pearson’s correlation) at 30 min is shown in the histogram (n = 6). Bars, 10 µm. (B and C) Wild-type HeLa cells or HeLa cells stably expressing the siRNA-resistant spastin proteins indicated were subjected to endogenous spastin KD, fixed, and visualized for M6PR and LAMP1. Mean ± SEM colocalization was plotted. n = 4 (B) or 5 (C). In B and C, p-values between the HeLa mock and all other mock conditions were not significant. P-values generated by two-tailed Student’s t test.
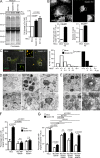
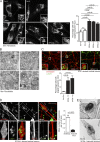
Figure 4.
Spastin and IST1 regulate lysosomal enzyme traffic and lysosome morphology. (A) HeLa cells were subjected to spastin or IST1 KD, then protein precipitated from collected culture medium was immunoblotted for pro–cathepsin D (Pro-CatD). Coomassie staining validates equal loading. Blots were quantified, and the mean ± SEM fold-change in Pro-CatD secretion was plotted (n = 5). (B) HeLa cells were subjected to spastin KD, fixed, and labeled for LAMP1, then the diameter of the largest lysosome was measured in 100 cells/condition. The mean ± SEM percentage of cells with largest lysosome >1.8 µm and mean diameter of the largest lysosome are shown (n = 4). (C) HeLa cells were subjected to spastin KD and incubated in culture medium with dextran-Oregon Green (DexOG; fluorescence is acid quenched) or dextran-tetramethylrhodamine (DexRhod; fluorescence is pH insensitive) for a 4-h pulse, which was chased into the terminal degradative compartment for 20 h with dextran-free medium. Living cells were then imaged, and the ratio of red to green pixels in 300 labeled puncta was measured and used to calculate pH, as described in Materials and methods. In the image, the differential interference contrast channel is shown to allow definition of the cell boundaries. The pH distribution of puncta from a single experiment is shown in the corresponding histograms. (D) Top, EM of HeLa cells subjected to spastin or IST1 KD, showing abnormal endolysosomal structures with abnormal dense membrane (arrowheads). Bottom, EM of MEFs from spastinN384K mice with genotypes indicated. Abnormal lysosomes indicated by arrowheads. (E) EM after BSA-gold uptake in mock-transfected or spastin-depleted HeLa cells. Right panels show the boxed areas indicated in the left panels; gold indicated by arrowheads. (F and G) Wild-type HeLa cells or HeLa cells stably expressing the siRNA-resistant spastin proteins indicated were subjected to endogenous spastin KD, fixed, and labeled for LAMP1. Mean ± SEM percentage of cells with largest lysosome >1.8 µm is plotted (n = 6, 100 cells/condition in each). All p-values generated by two-tailed Student’s t test, except C, in which differences in pH were analyzed using a two-tailed Mann–Whitney U test. Bars in light micrographs: (main image) 10 µm; (magnified insets) 5 µm. Bars in EM: 500 nm; (magnified images in E) 250 nm.
Figure 5.
Abnormal lysosomes in spastin-HSP mouse neurons. (A) Primary cortical neurons derived from spastinwt/wt (WT), spastinwt/N384K (HET), and spastinN384K/N384K (KI) animals were processed for immunofluorescence microscopy with the neuronal marker βIII-tubulin (red) and LAMP1 (green). The percentage of cells with largest lysosome >2 µm diameter was plotted for each animal (100 cells/animal). Bars indicate mean ± SEM. (B) EM of primary neuron cell bodies and neurites from animals with spastinN384K genotypes indicated. Boxed areas are in higher magnification on the right. (C) Confocal immunofluorescence microscopy (IF) of axonal swelling in spastinN384K/N384K mouse primary cortical neuron, labeled for LAMP1 and the axonal marker tau. Boxed areas shown in higher power in bottom panels. The mean ± SEM number of LAMP1-positive vesicles/µm of axonal length in 20 swellings versus adjacent axonal segments is plotted for three animals. Bars: (EM) 500 nm; (IF main panels) 10 µm; (IF magnified insets) 5 µm. P-values generated by two-tailed Student’s t test.
Figure 6.
Lysosomal abnormalities in human spastin-HSP patients. (A) Skin fibroblasts from control subjects (top) or three spastin-HSP patients (SPG4; bottom) were fixed and visualized by confocal immunofluorescence microscopy (IF) for LAMP1. In each image, the inset panels show higher-magnification views of the boxed region. The diameter of the largest lysosome was measured in 100 fibroblast cells from each subject, and the mean percentage of cells with largest lysosome >2 µm was plotted in the corresponding histogram (n = 3 experimental repeats). Histogram shows mean ± SEM. (B) EM of fibroblasts from spastin-HSP patient and control (bottom, magnified views of boxed areas). (C) Cells from two human cortical neuron lines (SPG4-111 and 112) and a control line (Ctrl-231) were fixed and labeled for βIII-tubulin (as a marker of neuronal differentiation) and LAMP1. The diameter of the largest lysosome was measured in βIII-tubulin–positive cells, and the mean ± SEM percentage of neurons with largest lysosome >2 µm was plotted in the corresponding histogram (n = 3/line, 100 cells/repeat). The two SPG4 neuronal lines were differentiated from separate NPC cultures derived from patient SPG4-1 iPSCs. (D) Cells from two human cortical neuron lines (SPG4-111 and 112) were labeled for βIII-tubulin and LAMP1. The images show a typical axonal swelling. The number of lysosomes in swellings (box 1) and adjacent axonal segments (box 2) was counted and normalized for segment length, and the mean ± SEM number of LAMP1-positive vesicles/µm of axonal length are presented in the corresponding histogram (n = 20 swellings). (E) EM of lysosomal structures in patient SPG4-1 iPSC-derived cortical neurons. Bars: (EM) 500 nm; (IF main panels) 10 µm; (IF magnified insets) 5 µm. P-values generated by two-tailed Student’s t test.
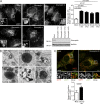
Figure 7.
Abnormal lysosomes in strumpellin HSP models. (A) HeLa cells were depleted of strumpellin using four individual siRNAs (strumpellin 1–4), fixed, and labeled for LAMP1, then the diameter of the largest lysosome in each cell was measured. The mean ± SEM percentage of cells with a largest lysosome >1.8 µm is shown (n = 6 repeats, 100 cells/repeat). The immunoblot verifies strumpellin depletion. (B) EM of endolysosomal structures in wild-type HeLa cells (mock) or HeLa cells subjected to strumpellin depletion using siRNAs 1–4. With each of the siRNAs, abnormal endolysosomal structures encompassing a range of appearances, from those containing very dense networks of membrane to looser coils of membrane, were observed (compare the two images shown for strumpellin siRNA 1). (C) HeLa cells were mock-transfected or depleted with strumpellin siRNA, then fixed and visualized for M6PR and LAMP1. Colocalization between the two markers was quantified and plotted in the corresponding histogram (n = 3 repeats, 15 cells per condition in each repeat). Bars: (EM) 500 nm; (confocal immunofluorescence microscopy [IF] main panels) 10 µm; (IF magnified insets) 5 µm. P-values generated by two-tailed Student’s t test.
Figure 8.
Lysosomal abnormalities in REEP1 knockout mice. (A) Primary cortical neurons from REEP1 KO or wild-type littermates were labeled with the neuronal marker βIII-tubulin (red) and LAMP1 (green). The diameter of the largest lysosome was measured, and the mean ± SEM percentage of cells with a largest lysosome >2 µm is shown (n = 3 repeats, at least 50 cells/repeat). (B) EM of primary cortical neurons from REEP1 KO mice or wild-type littermate controls. Middle panels are higher-magnification views of the boxed regions. Bars: (EM) 500 nm; (confocal immunofluorescence microscopy [IF] main panels) 10 µm; (IF magnified insets) 5 µm.
Figure 9.
Model for spastin mode of action and a proposed HSP cellular pathway. (A) Schematic of the proposed ER–endosome contacts mediated by spastin and IST1. The CHMP1B and IST1 complex implicated in fission coats the endosomal tubule. A spastin hexameric complex is in orange, with the ATPase domains positioned to cut a microtubule, but for clarity the N-terminal tails of a single M87-spastin and M1-spastin molecule are shown. (B) Schematic diagram of key trafficking pathways influenced by spastin and IST1. Spastin and IST1 drive ER-mediated fission of tubules, decorated by sorting nexins, from the early sorting endosome, thus promoting endosome-to-Golgi traffic of ciM6PR and recycling of TfnR. CiM6PR then captures newly synthesized lysosomal enzymes at the Golgi, and the complex is then trafficked back to endosomes, to deliver lysosomal enzymes to the late endosomal/lysosomal degradative compartment. For simplicity, only a single ER tubule is shown. Inset, 3D view of the relationship between endosomal tubules, ER tubules, microtubules, and spastin (orange) and IST1 (purple). (C) In cells lacking spastin, fission of endosomal tubules is inhibited (black rectangles), so ciM6PR and TfnR are not efficiently sorted away from the endosome and instead are trafficked to the degradative compartment. Reduced availability of ciM6PR at the Golgi apparatus results in increased secretion and reduced delivery to the endosomal pathway of lysosomal enzymes. This causes lysosomal morphological and functional abnormalities, including increased lysosomal size and the presence of abnormal arrays of dense membrane. (D) Proposed sites of action of selected HSP proteins involved in membrane traffic, overlaid onto the trafficking pathways shown in B.
Similar articles
- Atlastin-1 regulates endosomal tubulation and lysosomal proteolysis in human cortical neurons.
Zlamalova E, Rodger C, Greco F, Cheers SR, Kleniuk J, Nadadhur AG, Kadlecova Z, Reid E. Zlamalova E, et al. Neurobiol Dis. 2024 Sep;199:106556. doi: 10.1016/j.nbd.2024.106556. Epub 2024 Jun 6. Neurobiol Dis. 2024. PMID: 38851544 Free PMC article. - An ESCRT-spastin interaction promotes fission of recycling tubules from the endosome.
Allison R, Lumb JH, Fassier C, Connell JW, Ten Martin D, Seaman MN, Hazan J, Reid E. Allison R, et al. J Cell Biol. 2013 Aug 5;202(3):527-43. doi: 10.1083/jcb.201211045. Epub 2013 Jul 29. J Cell Biol. 2013. PMID: 23897888 Free PMC article. - Spastin MIT Domain Disease-Associated Mutations Disrupt Lysosomal Function.
Allison R, Edgar JR, Reid E. Allison R, et al. Front Neurosci. 2019 Nov 8;13:1179. doi: 10.3389/fnins.2019.01179. eCollection 2019. Front Neurosci. 2019. PMID: 31787869 Free PMC article. - Hereditary spastic paraplegia SPG4: what is known and not known about the disease.
Solowska JM, Baas PW. Solowska JM, et al. Brain. 2015 Sep;138(Pt 9):2471-84. doi: 10.1093/brain/awv178. Epub 2015 Jun 20. Brain. 2015. PMID: 26094131 Free PMC article. Review. - ER morphology and endo-lysosomal crosstalk: Functions and disease implications.
Lee CA, Blackstone C. Lee CA, et al. Biochim Biophys Acta Mol Cell Biol Lipids. 2020 Jan;1865(1):158544. doi: 10.1016/j.bbalip.2019.158544. Epub 2019 Oct 31. Biochim Biophys Acta Mol Cell Biol Lipids. 2020. PMID: 31678515 Free PMC article. Review.
Cited by
- Deciphering anomalous heterogeneous intracellular transport with neural networks.
Han D, Korabel N, Chen R, Johnston M, Gavrilova A, Allan VJ, Fedotov S, Waigh TA. Han D, et al. Elife. 2020 Mar 24;9:e52224. doi: 10.7554/eLife.52224. Elife. 2020. PMID: 32207687 Free PMC article. - Complex Interactions Between Membrane-Bound Organelles, Biomolecular Condensates and the Cytoskeleton.
Koppers M, Özkan N, Farías GG. Koppers M, et al. Front Cell Dev Biol. 2020 Dec 21;8:618733. doi: 10.3389/fcell.2020.618733. eCollection 2020. Front Cell Dev Biol. 2020. PMID: 33409284 Free PMC article. Review. - Protrudin-deficient mice manifest depression-like behavior with abnormalities in activity, attention, and cued fear-conditioning.
Shirane M, Shoji H, Hashimoto Y, Katagiri H, Kobayashi S, Manabe T, Miyakawa T, Nakayama KI. Shirane M, et al. Mol Brain. 2020 Nov 10;13(1):146. doi: 10.1186/s13041-020-00693-3. Mol Brain. 2020. PMID: 33172474 Free PMC article. - Here, there, and everywhere: The importance of ER membrane contact sites.
Wu H, Carvalho P, Voeltz GK. Wu H, et al. Science. 2018 Aug 3;361(6401):eaan5835. doi: 10.1126/science.aan5835. Science. 2018. PMID: 30072511 Free PMC article. Review. - Hereditary Spastic Paraplegia: From Genes, Cells and Networks to Novel Pathways for Drug Discovery.
Mackay-Sim A. Mackay-Sim A. Brain Sci. 2021 Mar 22;11(3):403. doi: 10.3390/brainsci11030403. Brain Sci. 2021. PMID: 33810178 Free PMC article. Review.
References
- Beetz, C., Schüle R., Deconinck T., Tran-Viet K.N., Zhu H., Kremer B.P., Frints S.G., van Zelst-Stams W.A., Byrne P., Otto S., et al. . 2008. REEP1 mutation spectrum and genotype/phenotype correlation in hereditary spastic paraplegia type 31. Brain. 131:1078–1086. 10.1093/brain/awn026 - DOI - PMC - PubMed
Publication types
MeSH terms
Grants and funding
- 093026/WT_/Wellcome Trust/United Kingdom
- 082381/WT_/Wellcome Trust/United Kingdom
- 086598/WT_/Wellcome Trust/United Kingdom
- 100140/WT_/Wellcome Trust/United Kingdom
- MR/M00046X/1/MRC_/Medical Research Council/United Kingdom
LinkOut - more resources
Full Text Sources
Other Literature Sources
Molecular Biology Databases
