Quantitative proteomics identify Tenascin-C as a promoter of lung cancer progression and contributor to a signature prognostic of patient survival - PubMed (original) (raw)
. 2017 Jul 11;114(28):E5625-E5634.
doi: 10.1073/pnas.1707054114. Epub 2017 Jun 26.
Alexandra Naba 3 2, Arjun Bhutkar 1, Talia Guardia 1 2, Kathryn M Miller 1 2, Carman Man-Chung Li 1 2, Talya L Dayton 1 2, Francisco J Sanchez-Rivera 1 2, Caroline Kim-Kiselak 1 2, Noor Jailkhani 1 2, Monte M Winslow 1 2, Amanda Del Rosario 1, Richard O Hynes 1 2 4, Tyler Jacks 3 2 4
Affiliations
- PMID: 28652369
- PMCID: PMC5514763
- DOI: 10.1073/pnas.1707054114
Quantitative proteomics identify Tenascin-C as a promoter of lung cancer progression and contributor to a signature prognostic of patient survival
Vasilena Gocheva et al. Proc Natl Acad Sci U S A. 2017.
Abstract
The extracellular microenvironment is an integral component of normal and diseased tissues that is poorly understood owing to its complexity. To investigate the contribution of the microenvironment to lung fibrosis and adenocarcinoma progression, two pathologies characterized by excessive stromal expansion, we used mouse models to characterize the extracellular matrix (ECM) composition of normal lung, fibrotic lung, lung tumors, and metastases. Using quantitative proteomics, we identified and assayed the abundance of 113 ECM proteins, which revealed robust ECM protein signatures unique to fibrosis, primary tumors, or metastases. These analyses indicated significantly increased abundance of several S100 proteins, including Fibronectin and Tenascin-C (Tnc), in primary lung tumors and associated lymph node metastases compared with normal tissue. We further showed that Tnc expression is repressed by the transcription factor Nkx2-1, a well-established suppressor of metastatic progression. We found that increasing the levels of Tnc, via CRISPR-mediated transcriptional activation of the endogenous gene, enhanced the metastatic dissemination of lung adenocarcinoma cells. Interrogation of human cancer gene expression data revealed that high TNC expression correlates with worse prognosis for lung adenocarcinoma, and that a three-gene expression signature comprising TNC, S100A10, and S100A11 is a robust predictor of patient survival independent of age, sex, smoking history, and mutational load. Our findings suggest that the poorly understood ECM composition of the fibrotic and tumor microenvironment is an underexplored source of diagnostic markers and potential therapeutic targets for cancer patients.
Keywords: Tenascin-C; extracellular matrix; lung cancer; quantitative proteomics; tumor microenvironment.
Conflict of interest statement
The authors declare no conflict of interest.
Figures
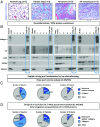
Fig. 1.
Enrichment of ECM from lung tissues and tumors and quantitative proteomic analysis of ECM-enriched samples. (A) Masson's trichrome staining of sections of normal murine lung, fibrotic lung, lung tumor, and lung tumor metastasis to the lymph node shows increased deposition of collagen (blue) in diseased lung samples compared with normal lung. (B) The sequential removal of intracellular components (steps 1–4) and resulting ECM protein enrichment were monitored in each sample (normal lung, fibrotic lung, primary lung tumor, and lung metastasis) by immunoblotting for collagen I and Fn (ECM markers), actin (cytoskeletal marker), GAPDH (cytosolic marker), and histones (nuclear marker). The insoluble fraction remaining after serial extraction (highlighted in blue) was enriched for ECM proteins and largely depleted for intracellular components. (C) Pie charts represent the relative distribution of ECM and non-ECM components in terms of number of spectra (Left), number of peptides (Middle), and proteins (Right) identified in the TMT mix composed of peptides from all 12 samples in two technical replicates. (D) Pie charts represent the relative distribution of ECM and non-ECM components in terms of number of spectra (Left), number of peptides (Middle), and proteins (Right) identified in the TMT mix composed of peptides from all 12 samples after integrating data from two additional technical replicates conducted after implementing a spectral exclusion list (Materials and Methods).
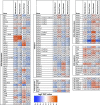
Fig. 2.
List of 113 quantified ECM proteins in normal and diseased lung samples. For each protein, the average log2 TMT ratio was calculated for the following comparisons: fibrotic lung samples/normal lung sample, fibrotic lung samples/lung tumor samples, lung tumor samples/normal lung sample, and lymph node metastasis samples/lung tumor samples. The proteins are divided into categories constituting the matrisome: ECM glycoproteins (Left), collagens and proteoglycans (Middle), and ECM-associated proteins including ECM regulators, ECM-affiliated proteins, and ECM-associated secreted factors (Right).
Fig. S1.
Detailed quantitative proteomic analysis of ECM-enriched samples. (A) Bar charts represent the number of spectra, unique peptides, and proteins identified in two technical replicates before (replicates 1 and 2) and after (replicates 3 and 4) implementing an exclusion list aimed at ignoring peptides already detected in replicates 1 and 2 to identify peptides of lower abundance. (B) Bar charts represent the number of spectra and unique peptides corresponding to ECM and ECM-associated proteins, and the number of ECM and ECM-associated proteins identified in two technical replicates before (replicates 1 and 2) and after implementation of a peptide exclusion list (replicates 3 and 4).
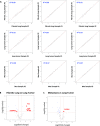
Fig. S2.
Reproducibility of the proteomic data between biological replicates. (A) The median-centered reporter ion intensities (log10) are plotted pairwise to assess reproducibility between biological replicates within each condition. The correlation coefficient. _R_2, is indicated for each comparison. (B and C) Volcano plots illustrate pairwise differential expression changes (using log2 median-centered expression values) between fibrotic lung and lung tumors (B) and between metastases and primary lung tumors (C). Each dot represents a protein. The _x_-axis indicates the log2 fold change over the normal sample (positive values represent up-regulation compared with the normal sample). The _y_-axis is −log10 of the two-sided t test P value indicating the significance of differential gene expression compared with the normal sample. The horizontal red dashed line represents P < 0.05 significance threshold. The vertical dashed red lines represent up and down fold change thresholds of 1.5×. Blue dots represent significant differentially expressed genes (_P_ < 0.05) and antibodies (FC > 1.5×). Genes of interest are highlighted in red.
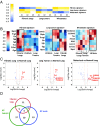
Fig. 3.
ECM signatures distinguish fibrotic, primary tumor, and metastatic states. (A) Analysis of proteomic data reveals three distinct statistically significant signatures (P < 0.01) characterizing fibrosis, primary lung tumor, and metastatic samples. Although each signature in the row-normalized heatmap is characterized by low protein levels (blue), each signature is two-sided, allowing for identification of proteins with high levels that characterize each of the states. Blue indicates lower protein levels compared with yellow (higher levels). (_B_) Heat maps for each of the three signatures show representation of enriched or depleted proteins (|_z_| > 1.75). Rows represent standardized median-centered values for a given protein, where blue indicates relatively lower levels than red. (C) Volcano plots illustrate pairwise differential expression changes (using log2 median-centered values) between each of fibrotic, lung tumor, and metastatic samples compared with the normal lung. Each dot represents a protein. The x axis indicates a log2-fold change over the normal sample (positive values represent up-regulation compared with the normal sample). The y axis is −log10 of the two-sided t test P value indicating the significance of differential gene expression compared with the normal sample. The horizontal red dashed line represents the P < 0.05 significance threshold. The vertical dashed red lines represent up and down fold change thresholds of 1.5× . Blue dots represent significant differentially expressed genes (_P_ < 0.05 and FC > 1.5×). Several proteins of interest (all significant) are highlighted in red; a complete list is provided in Dataset S3. (D) Venn diagram represents the overlap between ECM and ECM-associated proteins found in significantly altered abundance in lung fibrosis, lung tumor, and metastasis. The three proteins found in significantly different abundance in all three conditions are Fn, Tnc, and S100A11 (a complete list is provided in Dataset S3F).
Fig. 4.
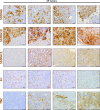
Validation of significantly up-regulated ECM proteins by IHC. Representative images of IHC for the indicated proteins in normal lung, primary lung tumor, and lung metastases to the lymph node, stained under identical conditions. Positive signals are shown in brown; hematoxylin (blue) was used as a counterstain. LN indicates the normal lymph node region, and Met is the area occupied by lung metastasis. All pictures were taken under the same magnification. (Scale bar: 50 μm.)
Fig. S3.
Additional examples of IHC staining of S100A6, S100A10, S100A11, Fn, and Tnc in KP lung tumors, showing the heterogeneity of expression of the indicated factors in primary KP tumors. Positive signals are shown in brown; hematoxylin (blue) was used as a counterstain. (Scale bar: 50 μm.)
Fig. 5.
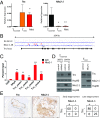
Nkx2-1 represses Tnc expression. (A) qRT-PCR analysis of Tnonmet (n = 3), Tmet (n = 4), and Met (n = 6) cell lines for Tnc (Left) and Nkx2-1 (Right) expression relative to GAPDH used as control. *P < 0.05, **_P_ < 0.01, unpaired _t_ test. (_B_) Analysis of ChIP-Seq data (20) reveals binding of Nkx2-1 in the _Tnc_ genomic locus at four distinct areas near the transcription start site. (_C_) ChIP-qPCR analysis of the enrichment of Nkx2-1 binding at the _Tnc_ genomic locus. Data represent mean ± SEM of three independent experiments. _Sftpa_ serves as a positive control. Negative control mapping to a gene desert region on murine chromosome 8 (GD8). The Tnc peak numbers correspond to those in _B_. **_P_ < 0.01, ***_P_ < 0.001, unpaired _t_ test. (_D_) Western blots showing that Nkx2-1 knockdown in two different Tnonmet cell lines allows Tnc expression, while Nkx2-1 overexpression in Tmet cells represses Tnc. Hsp90 was used as a loading control. (_E_) Nkx2-1 and Tnc IHC of KP lung adenocarcinomas shows reciprocal staining. Quantitation of Nkx2-1 and Tnc expression in early-stage (4–6 wk after initiation) and late-stage KP tumors (>12 wk after initiation).
Fig. S4.
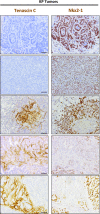
Additional examples of the reciprocal expression of Tnc and Nkx2-1 in KP lung tumors. Positive signals areshown in brown; hematoxylin (blue) was used as a counterstain. All pictures were taken under the same magnification. (Scale bar: 50 μm.)
Fig. S5.
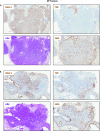
H&E and IHC staining for Tnc, Nkx2-1, and smooth muscle actin in KP lung tumors. Positive signals are shown in brown; hematoxylin (blue) was used as a counterstain. (Scale bars: 700 μm in A; 500 μm in B.)
Fig. 6.
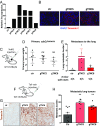
Overexpression of Tnc in lung adenocarcinoma cells promotes metastasis in vivo. (A) Expression of Tnc mRNA in 1233 KP cells using the SAM system. (B) Immunofluorescence analysis of Tnc in control KP cells compared with cells overexpressing Tnc. Tnc protein is shown in red; DAPI (blue) staining highlights the nuclei. (C) Experimental schematic: 1233 control or Tnc-overexpressing KP cells were injected s.c. into the flanks of WT C57BL/6J mice. (D) At 4 wk after injections, primary tumors were excised and weighed. (E) The lung metastatic burden was quantified as the ratio of the metastases area/ total lung area and the number below the graph show the number of mice that developed lung metastases. Each dot represents a mouse (n = 5 for each group). Data represent mean ± SEM. *P < 0.05, unpaired t test. (F) Experimental schematic: 1233 control or Tnc-overexpressing KP cells were injected via the lateral tail vein into WT C57BL/6J mice. (G) Representative IHC images of Tnc in the lung metastases. Positive signals are shown in brown; hematoxylin (blue) was used as a counterstain. (H) The area covered by metastases was quantified and divided over total lung area. Data represent mean ± SEM. **P < 0.01.
Fig. S6.
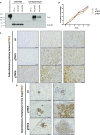
Further analysis of control or Tnc-overexpressing KP cells and implanted tumors. (A) Western blot analysis for TNC expression in 1233 KP control and TNC-overexpressing cell lines. Equal numbers of cells were seeded into six-well plates and grown for 5 d. The supernatant and lysates were then collected. Recombinant TNC was included as a positive control. Actin served as a loading control. (B) Growth curve analysis of control or Tnc-overexpressing 1233 KP cells, used in Fig. 5. (C) Representative images of Tnc IHC in the primary s.c. tumors from Fig. 5 C and D. Positive signals are shown in brown; hematoxylin (blue) was used as a counterstain. (Scale bar: 50 μm.) (D) Representative images of Tnc IHC in the spontaneous lung metastases arising from the primary s.c. tumors. Positive signals are shown in brown; hematoxylin (blue) was used as a counterstain. (Scale bar: 50 μm.)
Fig. S7.
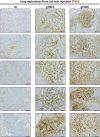
Further analysis of control or Tnc-overexpressing tail vein-injected metastases. Positive signals are shown in brown; hematoxylin (blue) was used as a counterstain. (Scale bar: 50 μm.)
Fig. 7.
Prognostic value of matrisome factors within the LUAD patient cohort. (A) Gene expression values (RNA-seq normalized counts standardized for mean = 0, SD = 1) for a subset of the validated matrisome factors in matched normal lung tissue and primary lung tumors of patients with lung adenocarcinoma (n = 57). Two-sided P values (Kolmogorov–Smirnov test) are shown. (B) Kaplan–Meier 5-y survival analysis comparing patients in the top 25th percentile of expression for each gene (n = 114; red) and those in the bottom 75th percentile (n = 344; blue). Log-rank test P values are shown. (C) Kaplan-Meier 5-y survival analysis in TCGA LUAD using an expression metric to quantify the combined expression levels of S100A10, S100A11, and TNC (three-gene signature). Specifically, the geometric mean of the expression levels was used to score and rank patients. Shown are the top 45% scoring patients (n = 206) vs. the rest (n = 252). Log-rank test P value is shown (median survival, 1,043 d for the high-scoring patient subpopulation and 1,725 d for the remainder of the cohort). (D) Results of univariate and multivariable Cox proportional hazards model on overall survival in the LUAD cohort (all patients). Increasing three-gene signature score shows a significant association with poorer survival after controlling for other characteristics.
Fig. S8.
Prognostic value of matrisome factors within the TCGA LUAD cohort. (A) Expression of TNC, S100A6, S100A10 and S100A11 in normal lung tissue (n = 58) and primary lung adenocarcinomas (n = 488) within the TCGA lung adenocarcinoma cohort. Two-sided P values (Kolmogorov–Smirnov test) are shown. (B) Expression of FN1 in normal lung and primary lung tumors across the entire lung adenocarcinoma cohort in the TCGA cohort (Left) or in matched tissue from the same patient (n = 57; Right). Two-sided P values (Kolmogorov–Smirnov test) are shown. (C) Kaplan–Meier 5-y survival analysis comparing patients with lung adenocarcinoma in the top 25th percentile of FN1 expression (n = 114, shown in red) and those in the bottom 75th percentile (n = 344; blue). Log-rank test P values are shown. (D) Kaplan–Meier 5-y survival analysis in the TCGA LUAD cohort using an expression metric to quantify the combined expression levels of S100A10, S100A11, and TNC (three-gene signature). Specifically, the geometric mean of the expression levels was used to score and rank patients. Shown are the top 25% scoring patients (n = 114) vs. the rest (n = 344). Log-rank test P values are shown. (E) Kaplan–Meier 5-y survival analysis comparing patients with lung adenocarcinoma in the top 45th percentile of TNC, S100A10, or S100A11 expression (n = 206; in red) and those in the bottom 55th percentile (n = 252; blue). Log-rank test P values are shown. (F) Kaplan–Meier 5-y survival analysis comparing patients with colon adenocarcinoma in the top 45th percentile of the three-gene signature score (TNC, S100A10, and S100A11 expression) (n = 197; red) and those in to the bottom 55th percentile (n = 243; blue). Log-rank test P values are shown.
Comment in
- Tumor microenvironment as a potential source of clinical biomarkers in non-small cell lung cancer: can we use enemy territory at our advantage?
Genova C, Rijavec E, Grossi F. Genova C, et al. J Thorac Dis. 2017 Nov;9(11):4300-4304. doi: 10.21037/jtd.2017.10.66. J Thorac Dis. 2017. PMID: 29268496 Free PMC article. No abstract available.
Similar articles
- Tenascin C and annexin II expression in the process of pancreatic carcinogenesis.
Esposito I, Penzel R, Chaib-Harrireche M, Barcena U, Bergmann F, Riedl S, Kayed H, Giese N, Kleeff J, Friess H, Schirmacher P. Esposito I, et al. J Pathol. 2006 Apr;208(5):673-85. doi: 10.1002/path.1935. J Pathol. 2006. PMID: 16450333 - High Co-expression of Large Tenascin C Splice Variants in Stromal Tissue and Annexin A2 in Cancer Cell Membranes is Associated with Poor Prognosis in Pancreatic Cancer.
Hagiwara K, Harimoto N, Yokobori T, Muranushi R, Hoshino K, Gantumur D, Yamanaka T, Ishii N, Tsukagoshi M, Igarashi T, Tanaka H, Watanabe A, Kubo N, Araki K, Hosouchi Y, Shirabe K. Hagiwara K, et al. Ann Surg Oncol. 2020 Mar;27(3):924-930. doi: 10.1245/s10434-019-07708-x. Epub 2019 Aug 28. Ann Surg Oncol. 2020. PMID: 31463696 - Proteomic Profiling of Extracellular Matrix Components from Patient Metastases Identifies Consistently Elevated Proteins for Developing Nanobodies That Target Primary Tumors and Metastases.
Jailkhani N, Clauser KR, Mak HH, Rickelt S, Tian C, Whittaker CA, Tanabe KK, Purdy SR, Carr SA, Hynes RO. Jailkhani N, et al. Cancer Res. 2023 Jun 15;83(12):2052-2065. doi: 10.1158/0008-5472.CAN-22-1532. Cancer Res. 2023. PMID: 37098922 Free PMC article. - Tenascin C in metastasis: A view from the invasive front.
Lowy CM, Oskarsson T. Lowy CM, et al. Cell Adh Migr. 2015;9(1-2):112-24. doi: 10.1080/19336918.2015.1008331. Cell Adh Migr. 2015. PMID: 25738825 Free PMC article. Review. - Interaction between cell and extracellular matrix in heart disease: multiple roles of tenascin-C in tissue remodeling.
Imanaka-Yoshida K, Hiroe M, Yoshida T. Imanaka-Yoshida K, et al. Histol Histopathol. 2004 Apr;19(2):517-25. doi: 10.14670/HH-19.517. Histol Histopathol. 2004. PMID: 15024713 Review.
Cited by
- Advances on the roles of tenascin-C in cancer.
Yilmaz A, Loustau T, Salomé N, Poilil Surendran S, Li C, Tucker RP, Izzi V, Lamba R, Koch M, Orend G. Yilmaz A, et al. J Cell Sci. 2022 Sep 15;135(18):jcs260244. doi: 10.1242/jcs.260244. Epub 2022 Sep 14. J Cell Sci. 2022. PMID: 36102918 Free PMC article. - Involvement of Integrin-Activating Peptides Derived from Tenascin-C in Cancer Aggression and New Anticancer Strategy Using the Fibronectin-Derived Integrin-Inactivating Peptide.
Fujita M, Sasada M, Iyoda T, Fukai F. Fujita M, et al. Molecules. 2020 Jul 16;25(14):3239. doi: 10.3390/molecules25143239. Molecules. 2020. PMID: 32708610 Free PMC article. Review. - Tenascin-C in the early lung cancer tumor microenvironment promotes progression through integrin αvβ1 and FAK.
Samson SC, Rojas A, Zitnay RG, Carney KR, Hettinga W, Schaelling MC, Sicard D, Zhang W, Gilbert-Ross M, Dy GK, Cavnar MJ, Furqan M, Browning RF Jr, Naqash AR, Schneider BP, Tarhini A, Tschumperlin DJ, Venosa A, Marcus AI, Emerson LL, Spike BT, Knudsen BS, Mendoza MC. Samson SC, et al. bioRxiv [Preprint]. 2024 Sep 21:2024.09.17.613509. doi: 10.1101/2024.09.17.613509. bioRxiv. 2024. PMID: 39345541 Free PMC article. Preprint. - Identification and validation of a 21-mRNA prognostic signature in diffuse lower-grade gliomas.
Song LR, Weng JC, Huo XL, Wang L, Li H, Li D, Wu Z, Zhang JT. Song LR, et al. J Neurooncol. 2020 Jan;146(1):207-217. doi: 10.1007/s11060-019-03372-z. Epub 2019 Dec 18. J Neurooncol. 2020. PMID: 31853837 - S100A11 Promotes Metastasis via AKT and ERK Signaling Pathways and Has a Diagnostic Role in Hepatocellular Carcinoma.
Zheng M, Meng H, Li Y, Shi J, Han Y, Zhao C, Chen J, Han J, Liang J, Chen Y, Liu Q, Wang Y. Zheng M, et al. Int J Med Sci. 2023 Jan 31;20(3):318-328. doi: 10.7150/ijms.80503. eCollection 2023. Int J Med Sci. 2023. PMID: 36860671 Free PMC article.
References
Publication types
MeSH terms
Substances
Grants and funding
- P30 CA014051/CA/NCI NIH HHS/United States
- U54 CA126515/CA/NCI NIH HHS/United States
- U54 CA163109/CA/NCI NIH HHS/United States
- HHMI/Howard Hughes Medical Institute/United States
LinkOut - more resources
Full Text Sources
Other Literature Sources
Medical
Molecular Biology Databases
Research Materials
Miscellaneous
