Collagen-derived proline promotes pancreatic ductal adenocarcinoma cell survival under nutrient limited conditions - PubMed (original) (raw)
doi: 10.1038/ncomms16031.
Orianne Olivares 1 2 3 4 5, Victoire Gouirand 1 2 3 4, Margaret E Torrence 6, Tristan Gicquel 1 2 3 4, Laurence Borge 1 2 3 4, Sophie Lac 1 2 3 4, Julie Roques 1 2 3 4, Marie-Noëlle Lavaut 1 2 3 4, Patrice Berthezène 1 2 3 4, Marion Rubis 1 2 3 4, Veronique Secq 1 2 3 4, Stéphane Garcia 1 2 3 4, Vincent Moutardier 1 2 3 4, Dominique Lombardo 7, Juan Lucio Iovanna 1 2 3 4, Richard Tomasini 1 2 3 4, Fabienne Guillaumond 1 2 3 4, Matthew G Vander Heiden 6 8, Sophie Vasseur 1 2 3 4
Affiliations
- PMID: 28685754
- PMCID: PMC5504351
- DOI: 10.1038/ncomms16031
Collagen-derived proline promotes pancreatic ductal adenocarcinoma cell survival under nutrient limited conditions
Orianne Olivares et al. Nat Commun. 2017.
Abstract
Tissue architecture contributes to pancreatic ductal adenocarcinoma (PDAC) phenotypes. Cancer cells within PDAC form gland-like structures embedded in a collagen-rich meshwork where nutrients and oxygen are scarce. Altered metabolism is needed for tumour cells to survive in this environment, but the metabolic modifications that allow PDAC cells to endure these conditions are incompletely understood. Here we demonstrate that collagen serves as a proline reservoir for PDAC cells to use as a nutrient source when other fuels are limited. We show PDAC cells are able to take up collagen fragments, which can promote PDAC cell survival under nutrient limited conditions, and that collagen-derived proline contributes to PDAC cell metabolism. Finally, we show that proline oxidase (PRODH1) is required for PDAC cell proliferation in vitro and in vivo. Collectively, our results indicate that PDAC extracellular matrix represents a nutrient reservoir for tumour cells highlighting the metabolic flexibility of this cancer.
Conflict of interest statement
M.G.V.H is a consultant and advisory board member of Agios Pharmaceuticals. The remaining authors declare no competing financial interests.
Figures
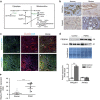
Figure 1. Collagen types I and IV and their associated collagenases are abundant in the stromal compartment of PDAC.
(a) Collagen by Masson’s trichrome staining and (b) immunohistochemistry (IHC) of collagen proteins type I and IV in human and mouse tumour sections. Representative images and their relative insets from _n_=4 patients and _n_=3 Pdx1-Cre;KrasG12D;Ink4a−/− (PKI) mice are illustrated. The percentage of total collagen and collagen types I and IV staining intensity calculated relative to total tumour area, expressed as mean±s.e.m., is indicated. Scale bar, 100 μm. (c) mRNA levels of the collagen specific MMP 13, 9 and 2 and prolidase (Pepd gene) measured by quantitative RT–PCR in PDAC from PKI mice (_n_=3) versus control pancreases from KrasG12D;Ink4a−/− (KI) mice (_n_=3). Data are mean±s.e.m. *P<0.05, **P<0.01, ***P<0.001; two-tailed unpaired Student’s _t_-test. (d) Prolidase localization in human and PKI mice tumours revealed by IHC (left) or immunofluorescence (IF, right), respectively. Representative images from _n_=4 patients and from _n_= 3 PKI mice. Scale bar, 100 μm. (e) Prolidase levels in supernatant from PK4A cells cultured during 24 or 48 h with coated collagen I in complete media. Total loaded protein was determined by Ponceau red staining (Std: standard). Marker sizes are indicated in kDa. Photos are representative of _n_=3 independent experiments. Uncropped images of blots are shown in Supplementary Fig. 10. MMP, matrix metalloproteases; RT–PCR, PCR with reverse transcription.
Figure 2. PDAC expresses proline metabolic enzymes.
(a) Free proline is metabolized in the mitochondrial matrix, first by proline oxidase (PRODH1), to generate 1-pyrroline-5-carboxylic acid (P5C) before conversion into glutamic-γ-semialdehyde (GSA). P5C dehydrogenase (P5CDH) metabolizes GSA into glutamate and NADH. Free proline is synthesized from P5C via pyrroline carboxylases 1 and 2 (PYCR1, 2) in the mitochondrion and PYCR3 in the cytosol. Proline incorporated into collagen (proline-Col) can be modified into hydroxyproline (OH-proline) by prolyl-4-Hydroxylases (P4H). (b,c) Localization of PRODH1 and P4HA3 in human and PKI mice PDAC by IHC (b) and in epithelial compartment by IF co-staining with the wide-spectrum cytokeratin (Ws KRT) epithelial marker in PKI mice (c). Representative images from _n_=4 patients (b) and _n_=3 PKI mice (b,c). Tumour glands and disseminated cells are indicated by asterisks and arrows, respectively. Scale bar, 100 μm. (d) Quantification of PRODH1 and P4HA3 protein levels in PKI mouse PDAC and in KI mouse control pancreas revealed by western blot analysis (upper panel, with marker size indicated in kDa). Protein levels in each tissue samples (histograms, lower panel, from n_=3 control KI mice and n_=3 PDAC PKI mice) are normalized to total loaded-proteins (Amido black staining). Data expressed as mean±s.e.m. (***P<0.001; two-tailed unpaired Student’s _t_-test). Uncropped images of blots are shown in Supplementary Fig. 10. (e) Quantification of PRODH1 protein levels in normal human pancreas (_n_=11) and human PDAC samples (_n_=10). PRODH1 levels are normalized to one normal pancreas used as a reference. Data are illustrated as mean±95% CI, *** P<0.001; Mann–Whitney test. Images of human PDAC and normal pancreas macroarray are displayed in Supplementary Fig. 1. CI, confidence interval.
Figure 3. Nutrient stress induces PDAC cells to take up collagen through macropinocytosis-dependent and independent mechanisms.
FACS analysis of collagen I or collagen type IV uptake by PK4A cells (a and b (upper) respectively). Cells were cultured 48 h in normoxia (21% oxygen (O2)) in complete (25 mM glucose, 4 mM glutamine), glucose-free or glutamine-free media with or without DQ-fluorescein-conjugated collagen I or IV (Col I or IV DQ). For each culture condition, either vehicle (DMSO) or 30 μM EIPA was added. Light grey peaks represent PKA cells not exposed to collagen I or IV DQ and dark grey peaks shifted to the right side reveal cells taking up collagen I or IV DQ. The percentage of positive cells in the dark grey shifted distributions, delimited by vertical bar, was indicated as mean±s.e.m. and represented as bar graph in charts below (lower a and b panels respectively). (c) Col I or (d) Col IV DQ MFI relative to each culture conditions during 48 h in normoxia. Data represent mean±s.e.m. (n_=6 independent experiments). P values, indicated by asterisks, show statistical significance relative to respective culture media without EIPA, while letters indicate statistical significance relative to complete media without EIPA. (c_P<0.05, b_P_<0.01, a_P_<0.001; two-tailed unpaired Student's _t_-test). (e,f) Comparison of the percentage (left panels) and MFI (right panels) between normoxic and hypoxic (1% oxygen (O2)) PK4A cells taking up Col I (e) or Col IV (f) DQ in each 48 h culture conditions. Data represent mean±s.e.m. (normoxia _n_=6 independent experiments; hypoxia _n_=3 independent experiments). *P<0.05, **P<0.01, two-tailed unpaired Student’s _t_-test. (g,h) Representative co-staining of Col IV DQ and Lamp1 lysosomal marker in PK4A cells cultured in glucose-free (g) or glutamine-free (h) media under normoxic conditions with or without EIPA. Insets show magnification of Col IV, Lamp1 or Col IV/Lamp1 (merge) PKA4 cells in each condition. Images are representative of _n_=3 independent experiments. Scale bar: 50 μm. FACS, fluorescence-activated cell sorting. MFI, mean fluorescence intensity.
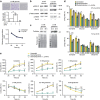
Figure 4. Collagen uptake promotes survival and proline promotes both survival and proliferation.
(a) PK4A cell survival in indicated media supplemented with vehicle or water-soluble collagen IV alone or in combination with EIPA treatment (upper). After treatments, cells were submitted to crystal violet assay. (upper) Representative crystal violet images (_n_=3 independent experiments). (middle) Crystal violet intensity, expressed as mean±s.e.m. (_n_=3 independent experiments) is presented as fold-induction relative to intensity in glucose-free condition without EIPA and without col IV. ND: Value below detection level. **P<0.01, two-tailed unpaired Student’s _t_-test. (lower) Glutamine concentration in media of PK4A cells cultured in glucose-free medium supplemented or not with water-soluble collagen IV over 72 h. Data represent mean±s.e.m. (_n_=3 independent experiments). Two-way ANOVA followed by Bonferroni post-hoc test revealed no significant difference in PK4A glutamine uptake between the two culture conditions. (b) ERK1/2 and p70S6K phosphorylation status in PK4A cells cultured with or without water-soluble collagen IV in indicated media during 72 h. (c) Prolidase levels in supernatant from PK4A cells cultured with coated collagen I in indicated media. Total protein loading was determined by Ponceau red staining. (b,c) marker sizes are indicated in kDa. Photos are representative of _n_=2 (b) and _n_=3 (c) independent experiments. Uncropped images of blots are shown in Supplementary Fig. 10. (d) Survival of PK4A cells cultured under normoxic (21% O2) or hypoxic (1% O2) conditions (upper and lower charts, respectively) in indicated nutrient conditions, in media alone or supplemented with either DHP (1 mM) or with DHP and
L
-proline (500 μM). Living cells, determined 24 h after treatment, are expressed as percentage of untreated cells in complete media (mean±s.e.m., _n_=4 independent experiments). *P<0.05, **P<0.01, ***P<0.001; two-tailed unpaired Student's t_-test. (e) Proliferation of PK4A cells cultured for 24–96 h under normoxia as in d. Data are mean±s.e.m., n_=4 independent experiments. P value, is relative to corresponding untreated value at each time point.*P<0.05, **P<0.01, ***P<0.001; two-way ANOVA followed by Bonferroni post-hoc test. ANOVA, analysis of variance.
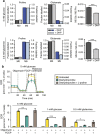
Figure 5. Proline catabolism diminishes glycolytic flux under glutamine deprivation.
(a) Glutamine and (b) glucose (upper) and lactate (lower) concentration in supernatant of subconfluent PK4A cells cultured for 8–24 h under gradual decrease of glutamine concentration (4, 2, 0.5 and 0 mM). Data are mean±s.e.m., _n_=3 independent experiments. P value, indicated by green and dark asterisks in b, is relative to glucose or lactate value in 4 mM glutamine at each time point. **P<0.01, ***P<0.001; two-way ANOVA followed by Bonferroni post-hoc test. (c) Fractional labelling (M3) of lactate from U-13C-glucose at 1, 3, 6 and 24 h under various glutamine concentrations (4 mM, 2 mM, 0.5 mM). All data were presented as mean±s.e.m. (_n_=3 independent experiments). (d) Glucose consumption and lactate production by PK4A cells cultured during 24 h in 0.5 mM glutamine media alone, or supplemented with DHP (1 mM) or with DHP and L-proline (500 μM). Data are presented as fold induction (mean±s.e.m., _n_=3 independent experiments) relative to untreated media values. *P<0.05, ***P<0.001; two-tailed unpaired Student’s _t_-test. ANOVA, analysis of variance.
Figure 6. Proline supports TCA metabolism under nutrient limited conditions.
(a) Schematic representation of the protocol used to create extracellular matrix (ECM) containing U-13C-proline. MEFs: mouse embryonic fibroblasts. (b) GCMS analysis of acid hydrolysis of de-cellularized ECM proteins from experiment outline in part a. Data is from _n_=1 experiment and is representative of _n_=2 experiments. (c) Fractional labelling of free U-13C-proline pools inside PK4A cells after 24 h on labelled ECM under indicated nutrient conditions. (d) U-13C-proline tracing by GCMS analysis into TCA intermediates in PK4A cells for 24 h under indicated nutrient conditions. M0 represents the unlabelled molecule with each increasing number representing another labelled carbon. Empty circles represent unlabelled 12C-species, while filled circles represent 13C-labelled carbons. For c and d data are mean±s.e.m. of _n_=3 biological replicates and representative of at least _n_=2 independent experiments. (e) Fractional labelling of proline from U-13C-proline after 24 h at the indicated conditions at normoxia (21% O2) and hypoxia (1% O2) (upper panels). All data are presented as mean±s.e.m. _n_=3 per condition. Complete mass isotopomer distribution (MID) of citrate from U-13C-proline after 24 h at the indicated conditions at normoxia (21% O2) and hypoxia (1% O2) (lower panel). All data are presented as mean±s.e.m. _n_=3 per condition. GCMS, gas chromatography-mass spectrometry.
Figure 7. DHP limits production of proline-derived glutamate and mitochondrial respiration.
(a) Fractional labelling of proline and glutamate from U-13C-proline after 24 h at 5 mM glucose (upper charts) or 0.5 mM glutamine (lower charts) media alone or supplemented with DHP (1 mM). Ratio of M5 glutamate (Glu) to M5 proline (Pro) at 5 mM glucose or 0.5 mM glutamine are presented next to labelled fractions. All data are presented as mean±s.e.m. _n_=3 per condition. ***P<0.001; two-tailed unpaired Student’s _t_-test. (b) Representative oxygen consumption rate (OCR) profile of PK4A cells cultured in 5 mM glucose media alone, or supplemented with DHP (1 mM) or with DHP and L-proline (500 μM) (upper panel). Sequential injections of 1 μM oligomycin, 1 μM FCCP and 0.5 μM rotenone/antimycin A mix are indicated. Maximal respiration was determined under indicated limited-nutrient conditions (lower panel). Data are mean±s.e.m., _n_=3 independent experiments. *P<0.05, ***P<0.001; two-tailed unpaired Student’s _t_-test.
Figure 8. PRODH1 inhibition limits pancreatic cancer cell resistance to nutrient limitation and impedes pancreatic tumour growth.
(a) Representative clonogenic assay and quantification of sg-Control and sg-PRODH1_clone9 and _clone3 PK4A cells colony-forming area in 5 and 1 mM glucose media. Data are mean±s.e.m. (_n_=3 independent experiments) and are expressed in percentage of 5 mM glucose sg-Control value. **P<0.01, ***P<0.001; two-tailed unpaired Student's _t_-test. Scale bar: 5 mm. (b) Tumour regression measured in sg-PRODH1_clone9 and _clone3 mice as compared to sg-Control one. Mice were subcutaneously implanted with sg-Control or sg-PRODH1_clone9 or _clone3 PK4A cells and caliper measurement of tumour size was performed over 15 post-implantation days. Data are mean±s.e.m. (_n_=10 mice per group). P value, indicated by green and blue asterisks, is relative to sg-Control tumour volume after 15 days post-implantation. **P<0.01, *** P< 0.001; two-way ANOVA followed by Bonferroni post-hoc test. (c) Ki67 IHC staining in sg-Control, sg-PRODH1_clone9 or _clone3 subcutaneous pancreatic tumour sections. Representative images from _n_=4 mice per group are illustrated. Scale bar: 100 μm. Chart represents quantification of Ki67 stained area/ quantified tumor area (_n_=7 fields quantified per tumour). *P<0.05, **P<0.01; two-tailed unpaired Student’s _t_-test. (d) Schematic summary. Upon nutrient limitation PDAC cells degrade collagen-rich PDAC extracellular matrix proteins and take up free proline through membrane transporters (SLC) as well as collagen fragments through macropinocytosis-dependent and independent processes. Internalized vesicles fuse with lysosome and collagen I and IV (ColI and ColIV) fragments undergo further degradation towards free amino acids. Collagen-derived proline (Pro) is further metabolized by the tricarboxylic acid (TCA) cycle to promote PDAC cell survival. MMPs: Matrix metalloproteases, Glu: Glutamate, α-KG: α-ketoglutarate, Asp: Aspartate. Mito: Mitochondria. ANOVA, analysis of variance.
Similar articles
- Collagen regulation of let-7 in pancreatic cancer involves TGF-β1-mediated membrane type 1-matrix metalloproteinase expression.
Dangi-Garimella S, Strouch MJ, Grippo PJ, Bentrem DJ, Munshi HG. Dangi-Garimella S, et al. Oncogene. 2011 Feb 24;30(8):1002-8. doi: 10.1038/onc.2010.485. Epub 2010 Nov 8. Oncogene. 2011. PMID: 21057545 Free PMC article. - P4HA1/HIF1α feedback loop drives the glycolytic and malignant phenotypes of pancreatic cancer.
Cao XP, Cao Y, Li WJ, Zhang HH, Zhu ZM. Cao XP, et al. Biochem Biophys Res Commun. 2019 Aug 27;516(3):606-612. doi: 10.1016/j.bbrc.2019.06.096. Epub 2019 Jun 22. Biochem Biophys Res Commun. 2019. PMID: 31239153 - Crosstalk between FTH1 and PYCR1 dysregulates proline metabolism and mediates cell growth in KRAS-mutant pancreatic cancer cells.
Park JM, Su YH, Fan CS, Chen HH, Qiu YK, Chen LL, Chen HA, Ramasamy TS, Chang JS, Huang SY, Chang WW, Lee AY, Huang TS, Kuo CC, Chiu CF. Park JM, et al. Exp Mol Med. 2024 Sep;56(9):2065-2081. doi: 10.1038/s12276-024-01300-4. Epub 2024 Sep 18. Exp Mol Med. 2024. PMID: 39294443 Free PMC article. - Harnessing metabolic dependencies in pancreatic cancers.
Encarnación-Rosado J, Kimmelman AC. Encarnación-Rosado J, et al. Nat Rev Gastroenterol Hepatol. 2021 Jul;18(7):482-492. doi: 10.1038/s41575-021-00431-7. Epub 2021 Mar 19. Nat Rev Gastroenterol Hepatol. 2021. PMID: 33742165 Free PMC article. Review. - Proline metabolism shapes the tumor microenvironment: from collagen deposition to immune evasion.
Kay EJ, Zanivan S, Rufini A. Kay EJ, et al. Curr Opin Biotechnol. 2023 Dec;84:103011. doi: 10.1016/j.copbio.2023.103011. Epub 2023 Oct 20. Curr Opin Biotechnol. 2023. PMID: 37864905 Review.
Cited by
- Proline metabolism and transport in retinal health and disease.
Du J, Zhu S, Lim RR, Chao JR. Du J, et al. Amino Acids. 2021 Dec;53(12):1789-1806. doi: 10.1007/s00726-021-02981-1. Epub 2021 Apr 19. Amino Acids. 2021. PMID: 33871679 Free PMC article. Review. - The roles of arginases and arginine in immunity.
Canè S, Geiger R, Bronte V. Canè S, et al. Nat Rev Immunol. 2024 Oct 17. doi: 10.1038/s41577-024-01098-2. Online ahead of print. Nat Rev Immunol. 2024. PMID: 39420221 Review. - Fibroblast pyruvate carboxylase is required for collagen production in the tumour microenvironment.
Schwörer S, Pavlova NN, Cimino FV, King B, Cai X, Sizemore GM, Thompson CB. Schwörer S, et al. Nat Metab. 2021 Nov;3(11):1484-1499. doi: 10.1038/s42255-021-00480-x. Epub 2021 Nov 11. Nat Metab. 2021. PMID: 34764457 Free PMC article. - Protease-Mediated Growth of Staphylococcus aureus on Host Proteins Is opp3 Dependent.
Lehman MK, Nuxoll AS, Yamada KJ, Kielian T, Carson SD, Fey PD. Lehman MK, et al. mBio. 2019 Apr 30;10(2):e02553-18. doi: 10.1128/mBio.02553-18. mBio. 2019. PMID: 31040245 Free PMC article. - High-grade mesenchymal pancreatic ductal adenocarcinoma drives stromal deactivation through CSF-1.
Steins A, van Mackelenbergh MG, van der Zalm AP, Klaassen R, Serrels B, Goris SG, Kocher HM, Waasdorp C, de Jong JH, Tekin C, Besselink MG, Busch OR, van de Vijver MJ, Verheij J, Dijk F, van Tienhoven G, Wilmink JW, Medema JP, van Laarhoven HW, Bijlsma MF. Steins A, et al. EMBO Rep. 2020 May 6;21(5):e48780. doi: 10.15252/embr.201948780. Epub 2020 Mar 16. EMBO Rep. 2020. PMID: 32173982 Free PMC article.
References
- Ferlay J. et al.. Cancer incidence and mortality worldwide: sources, methods and major patterns in GLOBOCAN 2012. Int. J. Cancer 136, E359–E386 (2015). - PubMed
- Malvezzi M., Bertuccio P., Levi F., La Vecchia C. & Negri E. European cancer mortality predictions for the year 2014. Ann. Oncol. 25, 1650–1656 (2014). - PubMed
- Konstantinidis I. T. et al.. Pancreatic ductal adenocarcinoma: is there a survival difference for R1 resections versus locally advanced unresectable tumors? What is a "true" R0 resection. Ann. Surg. 257, 731–736 (2013). - PubMed
- Hustinx S. R. et al.. Concordant loss of MTAP and p16/CDKN2A expression in pancreatic intraepithelial neoplasia: evidence of homozygous deletion in a noninvasive precursor lesion. Mod. Pathol. 18, 959–963 (2005). - PubMed
Publication types
MeSH terms
Substances
Grants and funding
- ETM/374/CSO_/Chief Scientist Office/United Kingdom
- F30 CA183474/CA/NCI NIH HHS/United States
- P30 CA014051/CA/NCI NIH HHS/United States
- T32 GM007753/GM/NIGMS NIH HHS/United States
LinkOut - more resources
Full Text Sources
Other Literature Sources
Medical
Molecular Biology Databases
Research Materials
Miscellaneous


