ER phospholipid composition modulates lipogenesis during feeding and in obesity - PubMed (original) (raw)
. 2017 Oct 2;127(10):3640-3651.
doi: 10.1172/JCI93616. Epub 2017 Aug 28.
Affiliations
- PMID: 28846071
- PMCID: PMC5617651
- DOI: 10.1172/JCI93616
ER phospholipid composition modulates lipogenesis during feeding and in obesity
Xin Rong et al. J Clin Invest. 2017.
Abstract
Sterol regulatory element-binding protein 1c (SREBP-1c) is a central regulator of lipogenesis whose activity is controlled by proteolytic cleavage. The metabolic factors that affect its processing are incompletely understood. Here, we show that dynamic changes in the acyl chain composition of ER phospholipids affect SREBP-1c maturation in physiology and disease. The abundance of polyunsaturated phosphatidylcholine in liver ER is selectively increased in response to feeding and in the setting of obesity-linked insulin resistance. Exogenous delivery of polyunsaturated phosphatidylcholine to ER accelerated SREBP-1c processing through a mechanism that required an intact SREBP cleavage-activating protein (SCAP) pathway. Furthermore, induction of the phospholipid-remodeling enzyme LPCAT3 in response to liver X receptor (LXR) activation promoted SREBP-1c processing by driving the incorporation of polyunsaturated fatty acids into ER. Conversely, LPCAT3 deficiency increased membrane saturation, reduced nuclear SREBP-1c abundance, and blunted the lipogenic response to feeding, LXR agonist treatment, or obesity-linked insulin resistance. Desaturation of the ER membrane may serve as an auxiliary signal of the fed state that promotes lipid synthesis in response to nutrient availability.
Conflict of interest statement
Conflict of interest: The authors have declared that no conflict of interest exists.
Figures
Figure 1. The Lxr/LPCAT3 pathway regulates SREBP-1c processing in hepatocytes.
(A) Primary mouse hepatocytes from C57BL/6 mice were infected with adenovirus expressing HSV-tagged SREBP-1c for 36 hours and treated with GW3965 (GW, 1 μM) for the last 24 hours. SREBP-1c from membrane fraction (precleaved SREBP-1 [pSREBP-1]) and nuclear fraction (mature SREBP-1 [mSREBP-1]) were analyzed by immunoblotting with anti-HSV antibody. HMGB1 served as internal loading controls for nuclear fractions. (B) Primary mouse hepatocytes from Lpcat3fl/fl (F/F) and Lpcat3fl/fl albumin-Cre+ (L-Lpcat3–/–) mice were infected with adenovirus expressing HSV-tagged SREBP-1c for 36 hours and treated with GW3965 for the last 24 hours. SREBP-1c from membrane fraction (pSREBP-1) and nuclear fraction (mSREBP-1) was analyzed by immunoblotting with anti-HSV antibody. (C) Primary mouse hepatocytes from Lpcat3fl/fl (F/F) and Lpcat3fl/fl albumin-Cre+ (L-Lpcat3–/–) mice were treated with DMSO (veh) or GW3965 (1 μM) for 24 hours. Endogenous SREBP-1 from membrane and nuclear fractions was analyzed by immunoblotting (upper panel) and quantified by ImageJ. The ratio of mSREBP-1 to pSREBP-1 was shown (lower panel). HMGB1 served as an internal loading control for the nuclear fraction. (D) Gene expression in primary hepatocytes treated as in C was analyzed by real-time PCR. (E) Primary mouse hepatocytes from C57BL/6 mice were infected with adenoviral shRNA vectors targeting LPCAT3 (shLPCAT3) or control (shCtrl) for 36 hours and treated with GW3965 (1 M) for the last 24 hours. Gene expression was analyzed by real-time PCR. *P < 0.05; **P < 0.01. Values are shown as mean ± SD.
Figure 2. The LXR/LPCAT3 pathway regulates SREBP-1c processing in mouse liver.
(A) Lpcat3fl/fl (F/F) and Lpcat3fl/fl albumin-Cre+ (L-Lpcat3–/–) mice were gavaged with GW3965 at 40 mg/kg body weight once per day for 3 days. Liver gene expression was analyzed by real-time PCR. n = 5 per group. (B) Lpcat3fl/fl (F/F) and Lpcat3fl/fl albumin-Cre+ (L-Lpcat3–/–) mice were gavaged with GW3965 at 40 mg/kg body weight once per day for 3 days. Liver protein was analyzed by immunoblotting. n = 3 per group. (C) C57BL/6 mice were transduced with adenoviral shLPCAT3 or shCtrl vectors for 8 days and gavaged with GW3965 at 40 mg/kg body weight once per day on days 6, 7, and 8. Liver gene expression was analyzed by real-time PCR. n = 5 per group. Statistical analysis was by 2-way ANOVA with Bonferroni’s post hoc tests. The post hoc test results between shCtrl and shLPCAT3 in GW3965-treated groups are shown in the figure. (D) 293T cells were transfected with plasmids expressing GFP control or truncated nuclear form of SREBP-1c and treated with GW3965 at 1 μM as described in Methods. Total cell lysate was analyzed by immunoblotting with anti–SREBP-1 antibody. (E) Immunoblotting results of transfected truncated nuclear SREBP-1c from D were quantified from 4 independent experiments by ImageJ. Statistical analysis was by Student’s t test. *P < 0.05; **P < 0.01. Values are shown as mean ± SEM.
Figure 3. PC acyl chain composition regulates SREBP-1c processing.
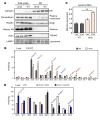
(A) Analysis of intracellular distribution fluorescently labeled PC following administration of ER-targeting liposomes. Fluorescently labeled ER-targeting liposomes enriched for different PC species were formulated as described in Methods. The PE, PS, and PI components were identical between liposomes, and the PC component was contributed by defined species as indicated. Liposomes were labeled with 1% bodipy-conjugated PC (green). DAPI (blue, left panels) and ER tracker (red, right panels) were used for costaining. Scale bars: 20 μm. (B) Quantification of ER-targeting liposome uptake. Cells were treated with fluorescently labeled carrier liposome enriched for either 18:0/18:0 PC or 18:0/20:4 PC for 1 hour. Cells were washed with PBS and lysed in RIPA buffer and fluorescence was measured with a plate reader. (C) Primary hepatocytes from C57BL/6 mice were infected with adenovirus expressing HSV–tagged SREBP-1c for 24 hours and treated with the indicated ER-targeting liposome (30 μM total phospholipid concentration) for the last 3.5 hours. Membrane and nuclear fractions were isolated and analyzed by immunoblotting. (D) Quantification of Western blot results from 3 independent experiments shown in part C. *P < 0.05, Student’s t test. (E) Primary hepatocytes from C57BL/6 mice were infected with adenovirus expressing HSV-tagged SREBP-1c for 24 hours and treated with liposomes composed of the indicated single PC species at 30 μM for the last 3.5 hours. Membrane and nuclear fractions were isolated and analyzed by immunoblotting. (F) Primary hepatocytes from Scapfl/fl mice were infected with adenoviral GFP or Cre recombinase and treated with GW3965 (1 μM) for 24 hours. Protein from total cell lysates was analyzed by immunoblotting.
Figure 4. Liver ER membrane composition is dynamically regulated during feeding.
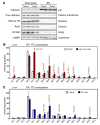
(A) Validation of ER fractionation of mouse liver extracts by immunoblot analysis of subcellular markers. (B) ESI-MS/MS analysis of PC species in the ER fraction from livers of C57BL/6 mice fasted 12 hours or fasted 12 hours and refed 12 hours with a high-carbohydrate diet (21). Indicated (_sn_-1/_sn_-2) molecular species were confirmed by product ion scanning for aliphatic composition. n = 6 per group. Statistical analysis was by Student’s t test with correction for multiple comparisons using the Holm-Šidák method. *P < 0.05. Values are shown as mean ± SEM. (C) ESI-MS/MS analysis of PC species in the ER fraction from livers of C57BL/6 mice fasted 12 hours or fasted 12 hours and refed 12 hours with a high-fat diet (60% fat). Indicated (_sn_-1/_sn_-2) molecular species were confirmed by product ion scanning for aliphatic composition. n = 6 per group. Statistical analysis was by Student’s t test with correction for multiple comparisons using the Holm-Šidák method. *P < 0.05. Values are shown as mean ± SEM.
Figure 5. LPCAT3 modulates the lipogenic response to feeding.
(A) Lpcat3fl/fl (F/F) and Lpcat3fl/fl albumin-Cre+ (L-Lpcat3–/–) mice were fasted 12 hours or fasted 12 hours and refed 12 hours with a high-carbohydrate diet. Gene expression was analyzed by real-time PCR. n = 6 per group. Statistical analysis was by 2-way ANOVA with Bonferroni’s post hoc tests. (B) Membrane and nuclear fractions were prepared from fresh livers from mice treated as in A. Samples of 4 mice from each condition were pooled for measurement of endogenous SREBP-1 and SREBP-2 protein. (C) Lpcat3fl/fl mice were transduced with adenoviral vector control or adenoviral-Cre for 7 days and then administered vehicle or 0.75 unit/kg body weight insulin as indicated. Liver gene expression was analyzed by real-time PCR after 3 hours. n = 4 per group. *P < 0.05; **P < 0.01. Values are shown as mean ± SEM.
Figure 6. LPCAT3 mediates changes in ER phospholipid composition in obesity.
(A) Validation of ER fractionation of mouse liver extracts by immunoblot analysis of subcellular markers. (B) ESI-MS/MS analysis of PC species in the ER fraction from C57BL/6 and ob/ob mouse liver. Indicated (_sn_-1/_sn_-2) molecular species were confirmed by product ion scanning for aliphatic composition. n = 6 per group. Statistical analysis was by Student’s t test with correction for multiple comparisons using the Holm-Šidák method. *P < 0.05. Values are shown as mean ± SEM. (C) Lpcat3 expression in livers of C57BL/6 and ob/ob mice at 4 weeks and 12 weeks of age analyzed by real-time PCR. n = 5 per group. Statistical analysis was by 1-way ANOVA with Bonferroni’s post hoc tests. **P < 0.01. Values are shown as mean ± SEM. (D) ESI-MS/MS analysis of liver PC species from ob/ob mice transduced with adenoviral shCtrl or shLPCAT3 vectors for 7 days. Indicated (_sn_-1/_sn_-2) molecular species were confirmed by product ion scanning for aliphatic composition. n = 6 per group. Statistical analysis was by Student’s t test with correction for multiple comparisons using the Holm-Šidák method. *P < 0.05. Values are shown as mean ± SEM.
Figure 7. LPCAT3 promotes SREBP-1c processing and hepatic lipogenesis in obesity.
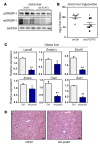
(A) Levels of precleaved SREBP-1 and mature SREBP-1 were analyzed in livers from ob/ob mice transduced with adenoviral shRNA targeting LPCAT3 (shLPCAT3) or control for 7 days. GAPDH was used as internal loading control. (B) Hepatic triglyceride levels of mice used for A. (C) Liver gene expression was determined by real-time PCR in mice used for A. n = 6 per group. Statistical analysis was by 1-way ANOVA with Bonferroni’s post hoc tests. (D) H&E staining of liver sections from ob/ob mice transduced with adenoviral vectors expressing shRNA targeting LPCAT3 (shLPCAT3) or control LPCAT for 7 days. Original magnification: ×100. *P < 0.05; **P < 0.01. Values are shown as mean ± SEM.
Figure 8. Enhances LPCAT3 activity drives hepatic lipogenesis.
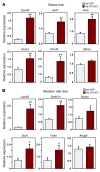
(A) ob/ob mice were transduced with adenoviral vectors expressing LPCAT3 or GFP for 7 days. n = 5 per group. (B) C57BL/6 mice were fed a western diet for 12 weeks and transduced with adenoviral vectors expressing LPCAT3 or GFP for 7 days. n = 5 per group. Gene expression was analyzed by real-time PCR. Statistical analysis was by Student’s t test. *P < 0.05; **P < 0.01. Values are shown as mean ± SEM.
Similar articles
- Hepatic steatosis: a role for de novo lipogenesis and the transcription factor SREBP-1c.
Ferré P, Foufelle F. Ferré P, et al. Diabetes Obes Metab. 2010 Oct;12 Suppl 2:83-92. doi: 10.1111/j.1463-1326.2010.01275.x. Diabetes Obes Metab. 2010. PMID: 21029304 Review. - Docosahexaenoic acid inhibits proteolytic processing of sterol regulatory element-binding protein-1c (SREBP-1c) via activation of AMP-activated kinase.
Deng X, Dong Q, Bridges D, Raghow R, Park EA, Elam MB. Deng X, et al. Biochim Biophys Acta. 2015 Dec;1851(12):1521-9. doi: 10.1016/j.bbalip.2015.08.007. Epub 2015 Aug 29. Biochim Biophys Acta. 2015. PMID: 26327595 - GRP78 expression inhibits insulin and ER stress-induced SREBP-1c activation and reduces hepatic steatosis in mice.
Kammoun HL, Chabanon H, Hainault I, Luquet S, Magnan C, Koike T, Ferré P, Foufelle F. Kammoun HL, et al. J Clin Invest. 2009 May;119(5):1201-15. doi: 10.1172/JCI37007. Epub 2009 Apr 13. J Clin Invest. 2009. PMID: 19363290 Free PMC article. - SREBP-1c and lipogenesis in the liver: an update1.
Ferré P, Phan F, Foufelle F. Ferré P, et al. Biochem J. 2021 Oct 29;478(20):3723-3739. doi: 10.1042/BCJ20210071. Biochem J. 2021. PMID: 34673919 Review.
Cited by
- PNPLA3 is a triglyceride lipase that mobilizes polyunsaturated fatty acids to facilitate hepatic secretion of large-sized very low-density lipoprotein.
Johnson SM, Bao H, McMahon CE, Chen Y, Burr SD, Anderson AM, Madeyski-Bengtson K, Lindén D, Han X, Liu J. Johnson SM, et al. Nat Commun. 2024 Jun 6;15(1):4847. doi: 10.1038/s41467-024-49224-x. Nat Commun. 2024. PMID: 38844467 Free PMC article. - Nuclear receptors and liver disease: Summary of the 2017 basic research symposium.
Tran M, Liu Y, Huang W, Wang L. Tran M, et al. Hepatol Commun. 2018 Jun 14;2(7):765-777. doi: 10.1002/hep4.1203. eCollection 2018 Jul. Hepatol Commun. 2018. PMID: 30129636 Free PMC article. Review. - Endoplasmic Reticulum Stress in Metabolic Disorders.
Ghemrawi R, Battaglia-Hsu SF, Arnold C. Ghemrawi R, et al. Cells. 2018 Jun 19;7(6):63. doi: 10.3390/cells7060063. Cells. 2018. PMID: 29921793 Free PMC article. Review. - Liver X receptors and liver physiology.
Russo-Savage L, Schulman IG. Russo-Savage L, et al. Biochim Biophys Acta Mol Basis Dis. 2021 Jun 1;1867(6):166121. doi: 10.1016/j.bbadis.2021.166121. Epub 2021 Mar 11. Biochim Biophys Acta Mol Basis Dis. 2021. PMID: 33713792 Free PMC article. Review. - PIDDosome-SCAP crosstalk controls high-fructose-diet-dependent transition from simple steatosis to steatohepatitis.
Kim JY, Wang LQ, Sladky VC, Oh TG, Liu J, Trinh K, Eichin F, Downes M, Hosseini M, Jacotot ED, Evans RM, Villunger A, Karin M. Kim JY, et al. Cell Metab. 2022 Oct 4;34(10):1548-1560.e6. doi: 10.1016/j.cmet.2022.08.005. Epub 2022 Aug 29. Cell Metab. 2022. PMID: 36041455 Free PMC article.
References
MeSH terms
Substances
Grants and funding
- F32 DK109601/DK/NIDDK NIH HHS/United States
- P01 HL030568/HL/NHLBI NIH HHS/United States
- P30 DK041301/DK/NIDDK NIH HHS/United States
- P30 DK063491/DK/NIDDK NIH HHS/United States
LinkOut - more resources
Full Text Sources
Other Literature Sources
Medical
Molecular Biology Databases
Research Materials


