SLAMF1 is required for TLR4-mediated TRAM-TRIF-dependent signaling in human macrophages - PubMed (original) (raw)
SLAMF1 is required for TLR4-mediated TRAM-TRIF-dependent signaling in human macrophages
Maria Yurchenko et al. J Cell Biol. 2018.
Abstract
Signaling lymphocytic activation molecule family 1 (SLAMF1) is an Ig-like receptor and a costimulatory molecule that initiates signal transduction networks in a variety of immune cells. In this study, we report that SLAMF1 is required for Toll-like receptor 4 (TLR4)-mediated induction of interferon β (IFNβ) and for killing of Gram-negative bacteria by human macrophages. We found that SLAMF1 controls trafficking of the Toll receptor-associated molecule (TRAM) from the endocytic recycling compartment (ERC) to Escherichia coli phagosomes. In resting macrophages, SLAMF1 is localized to ERC, but upon addition of E. coli, it is trafficked together with TRAM from ERC to E. coli phagosomes in a Rab11-dependent manner. We found that endogenous SLAMF1 protein interacted with TRAM and defined key interaction domains as amino acids 68 to 95 of TRAM as well as 15 C-terminal amino acids of SLAMF1. Interestingly, the SLAMF1-TRAM interaction was observed for human but not mouse proteins. Overall, our observations suggest that SLAMF1 is a new target for modulation of TLR4-TRAM-TRIF inflammatory signaling in human cells.
© 2018 Yurchenko et al.
Figures
Graphical abstract
Figure 1.
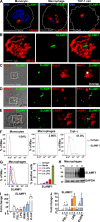
SLAMF1 is enriched in the Rab11-positive ERCs in unstimulated macrophages, and SLAMF1 expression is induced by LPS and several other TLR ligands in primary human monocytes and macrophages. (A) Monocytes, macrophages, and differentiated THP-1 cells stained with antibodies against SLAMF1 (green) and GM130 (red) and imaged by confocal microscopy. (B) 3D model of cis-Golgi (GM130) and SLAMF1 in THP-1 cells. Z stacks from the GM130 and SLAMF1 channels were obtained using high-resolution confocal microscopy followed by 3D modeling in IMARIS software. (C) Macrophages stained for SLAMF1 and Rab11 (ERC marker). Representative image. Overlapping pixels for SLAMF1 and Rab11 are shown in the white overlap. tM1 = 0.683 ± 0.08 (mean with SD) for z stacks of ERCs as ROIs (30 ROIs analyzed per donor) where tM1 was the Manders’s colocalization coefficient with thresholds calculated in the Coloc 2 Fiji plugin with anti-SLAMF1 staining as first channel. (D) Macrophages costained for SLAMF1 and EEA1. (E) Macrophages costained for SLAMF1 and LAMP1. Colocalization accessed for z stacks for at least 30 cells for each experiment (four total) showing no colocalization for markers in both D and E. (F) Flow cytometry analysis of SLAMF1 surface expression by primary macrophages and differentiated THP-1 cells. Cells were costained for SLAMF1 and CD14 and gated for CD14-positive cells (primary cells) or stained for SLAMF1 (THP-1 cells). (G) Flow cytometry analysis of SLAMF1 surface expression by human macrophages stimulated by ultrapure K12 LPS (100 ng/ml) for 2, 4, and 6 h. (H) Western blot analysis of lysates from primary human macrophages stimulated by LPS for 2, 4, and 6 h. Graphs present mean values for three biological replicates with SD. Molecular weight is given in kilodaltons. (I and J) Quantification of SLAMF1 mRNA expression by qPCR in monocytes (I) and macrophages (J) stimulated by TLRs’ ligands FSL-1 (20 ng/ml), K12 LPS (100 ng/ml), and CL075 (1 μg/ml; both I and J) as well as R848 (1 μg/ml), Pam3Cys (P3C; 1 μg/ml), or K12 E. coli particles (20/cell; I only). Results are presented as means with SD. Statistical significance between groups was evaluated by a two-tailed t test. *, P < 0.01. Results are representative of at least four independent experiments/donors (A–H) or combined data for at least three donors (I and J).
Figure 2.
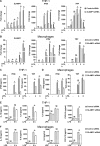
Knockdown of SLAMF1 in macrophages results in strongly reduced TLR4-mediated IFNβ mRNA expression and protein secretion as well as some decrease of TNF, IL-6, and CXCL10 secretion. (A and B) Quantification of SLAMF1, IFNβ, and TNF mRNA expression by qPCR in THP-1 cells (A) and macrophages (B) treated by 100 ng/ml ultrapure K12 LPS. (C and D) IFNβ and TNF secretion levels by THP-1 cells (C) and macrophages (D) in response to LPS (4 and 6 h) assessed by ELISA. (E and F) Secretion levels of IL-1β, IL-6, IL-8, and CXCL-10 (6 h LPS) analyzed by multiplex assays. Data are presented as means with SD for combined data from three independent experiments (A, C, and E), for three biological replicates from one of six donors (B and D), or one of three donors (F). *, P < 0.01.
Figure 3.
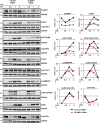
SLAMF1 silencing in macrophages impairs TLR4-mediated phosphorylation of TBK1, IRF3, and TAK1. Western blotting of lysate macrophages treated with a control nonsilencing oligonucleotide or _SLAMF1_-specific siRNA oligonucleotides and stimulated with 100 ng/ml LPS. The antibodies used are indicated in the figure. An antibody toward SLAMF1 was used to control for SLAMF1 silencing, and GAPDH was used as an equal loading control. Same GAPDH controls are presented for pTBK1, total TBK1, and phospho-p38MAPK, for total IRF3 and total TAK1, and for pTAK1 and pIκBα because they were probed on the same membranes. Western blots are representative of one of five donors. Molecular weight is given in kilodaltons. Graphs (right) show quantifications of protein levels relative to GAPDH levels obtained with Odyssey software.
Figure 4.
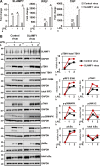
Lentiviral transduction of SLAMF1 in macrophages results in the increase of IRF3 and TBK1 phosphorylation in response to LPS and upregulation of IFNβ and TNF expression. (A) Quantification of SLAMF1, IFNβ, and TNF mRNA expression by qPCR in macrophages transduced by Flag-tagged SLAMF1 coding or control virus and treated by LPS. The qPCR data are presented as means and SD for three biological replicates of one of three experiments. Significance was calculated by two-tailed t tests. *, P < 0.01. (B) Western blots showing LPS-induced phosphorylation of signaling molecules in cells transduced with the SLAMF1-expressing virus versus control virus. Dividing lines were added where the time point of 4 h was excised. The same GAPDH controls are presented for total IRF3 and total IκBα and for pIκBα and pTAK1 because they were probed on the same membranes. Molecular weight is given in kilodaltons. Graphs (right) show quantifications of protein levels relative to GAPDH levels obtained with Odyssey software.
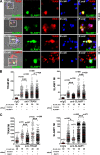
Figure 5.
SLAMF1 regulates TRAM recruitment to E. coli phagosomes. (A) SLAMF1 costaining with TRAM, EEA1, or LAMP1 in primary macrophages coincubated with E. coli pHrodo particles for indicated time points. SLAMF1 (green), E. coli (blue), and TRAM, EEA1, or LAMP1 (red) are shown. The data shown are representative of one out of four donors. Bars, 10 μm. (B and C) TRAM and SLAMF1 MIs on E. coli phagosomes upon SLAMF1 silencing (B) or simultaneous Rab11a and Rab11b silencing (C) in primary human macrophages quantified from xyz images. The scatter plots are presented as median values of TRAM voxel intensity, and numbers of phagosomes are shown at the top. The nonparametric Mann-Whitney test was used to evaluate statistical significance. *, P < 0.01; ***, P ≤ 0.0001. Human macrophages were incubated with E. coli particles for indicated time points, fixed, and costained for SLAMF1 and TRAM, normal rabbit (rIgG), or mouse IgG (mIgG). The data shown are representative for one out of five (B) or four (C) donors.
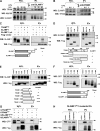
Figure 6.
SLAMF1 interacts with TRAM protein. (A) Endogenous IPs using specific anti-SLAMF1 mAbs from macrophages stimulated by LPS. (B) Endogenous IPs using anti-TRAM polyclonal antibodies from macrophages stimulated by LPS. (C) TRAMFlag-precipitated SLAMF1 and SLAMF1ct was needed for interaction with TRAM. (D) Coprecipitation of TRAM deletion mutants: TIR domain (68–235), short TRAM TIR domain (68–176 aa), and N-terminal (1–68 aa) or C-terminal (158–235 aa) domains with SLAMF1 protein. (E) Coprecipitation of TRAM deletion mutants containing the N-terminal part of TRAM TIR domain with SLAMF1. (F) Coprecipitation of SLAMF1Flag deletion mutants with TRAMYFP. (G) Coprecipitation of human SLAMF1Flag with human TRAMYFP and of mouse SLAMF1Flag with mouse TRAMEGFP. Black dashed lines indicate that intervening lanes have been spliced out. (H) Human SLAMF1 cytoplasmic tail coprecipitation with TRAMYFP with or without amino acid substitutions at 321–324. Graphs under C–F summarize the IPs’ results. Indicated constructs were transfected to HEK293T cells, and anti-Flag agarose was used for the IPs. For endogenous IPs, specific SLAMF1 or TRAM antibodies were covalently coupled to beads. At least three independent experiments were carried out for anti-Flag IPs, and five independent experiments were carried out for the endogenous IPs, and one representative experiment is shown for each. Molecular weight is given in kilodaltons. WB, Western blot; WCL, whole-cell lysate.
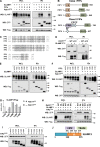
Figure 7.
SLAMF1 interacts with all class I Rab11 FIPs. (A) Anti-Flag IPs for Rab11aFlag with EGFP-tagged Rab11FIPs (1–5) and SLAMF1. (B) Schematic figure for class I and class II Rab11 FIPs domain structure. C2, phospholipid-binding C2 domain; EF, EF-hand domain; PRR, proline-rich region; RBD, Rab11 binding domain. (C) Homologous protein sequence in class I FIPs, which follow the C2 domain. Identical amino acids in all three class I FIPs are highlighted. (D) Coprecipitation of SLAMF1Flag with FIP2EGFP WT or FIP2 deletion mutant lacking the C2 domain (ΔC2). (E and F) Coprecipitation of untagged SLAMF1 with FIP2Flag (1–512 aa) and Flag-tagged FIP2 deletion mutants in anti-Flag IPs in the absence (E) or presence (F) of overexpressed Rab11CFP. (G) Quantification of coprecipitations in E and F between SLAMF1 and FIP2Flag variants correlated with the amount of Flag-tagged protein on the blot and Flag-tagged protein sizes. Error bars represent means ± SD for three independent experiments. (H) Coprecipitation of FIP2Flag with SLAMF1 and Rab11a WT, Rab11a Q70L mutant (QL), or Rab11a S25N mutant (SN). (I) Coprecipitation of SLAMF1Flag deletion mutants with FIP2EGFP. Molecular weight is given in kilodaltons. WB, Western blot; WCL, whole-cell lysate. (J) Scheme for FIP2- and TRAM-interacting domains in SLAMF1ct. The results are representative of at least three independent experiments.
Figure 8.
TRAM acts as a bridge between the SLAMF1 and TLR4 signaling complex. (A and B) Coprecipitations of SLAMF1Flag with TLR4Cherry (A) or TRIFHA (B) with or without TRAMYFP overexpression. (C) Coprecipitation of TLR4Flag with SLAMF1 with or without TRAMYFP overexpression. (D) TLR4Flag interaction with TRAMYFP and TRIFHA with or without SLAMF1 coexpression. (E) Coprecipitation of SLAMF1 with or without TRIFHA in the presence of TRAMYFP by TLR4Flag. Indicated constructs were transfected to HEK293T cells. pDuo-CD14/MD-2 vector was cotransfected to all wells (A and C–E). Anti-Flag agarose was used for IPs. At least three independent experiments were performed. Molecular weight is given in kilodaltons. WB, Western blot; WCL, whole-cell lysate.
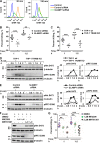
Figure 9.
TRAM and SLAMF1 are essential for the killing of E. coli by human macrophages. (A) Flow cytometry analysis of dihydrorhodamine 123 (DHR-123) fluorescence to access ROS activation in control siRNA or SLAMF1 siRNA human macrophages upon stimulation by E. coli red pHrodo particles. One of three experiments shown. (B and C) Bacterial killing assays by SLAMF1-silenced and control THP-1 cells (B) as well as TRAM KO and control THP-1 cells (C) infected with a DH5α strain at MOI 40. (D and E) Western blot analysis of pAkt (S473) and pIRF3 (S396) levels induced by E. coli particles in THP-1 WT and TRAM KO cells (D) as well as SLAMF1-silenced or control oligonucleotide–treated cells (E). Graphs (right) on Western blotting show quantification of protein levels relative to β-tubulin obtained with Odyssey software. (F) Western blot showing phospho-(S396) IRF3 and phospho-(S473) Akt levels in lysates of THP-1 cells coincubated with E. coli particles for 1 h in the presence or absence of TBK1-IKKε inhibitor (MRT67307), pan-Akt allosteric inhibitor (MK2206), or DMSO. Molecular weight is given in kilodaltons. (G) Bacterial killing assays by THP-1 cells with DMSO (<0.01%), 1 μM Akt inhibitor MK2206, or 2 μM TBK1-IKKε inhibitor MRT67307 upon infection by DH5α at MOI 40. Percent killing was calculated as 100 − (number of CFUs at time X/number of CFUs at time 0) × 100 for average values of technical replicates, and each dot on the graphs in B, C, and G represents a biological replicate from three independent experiments. Median values are shown by lines. Statistical significance was calculated by a Mann-Whitney nonparametric test. **, P < 0.01; ***, P < 0.001.
Similar articles
- A role for the adaptor proteins TRAM and TRIF in toll-like receptor 2 signaling.
Nilsen NJ, Vladimer GI, Stenvik J, Orning MP, Zeid-Kilani MV, Bugge M, Bergstroem B, Conlon J, Husebye H, Hise AG, Fitzgerald KA, Espevik T, Lien E. Nilsen NJ, et al. J Biol Chem. 2015 Feb 6;290(6):3209-22. doi: 10.1074/jbc.M114.593426. Epub 2014 Dec 11. J Biol Chem. 2015. PMID: 25505250 Free PMC article. - CD14, TLR4 and TRAM Show Different Trafficking Dynamics During LPS Stimulation.
Klein DC, Skjesol A, Kers-Rebel ED, Sherstova T, Sporsheim B, Egeberg KW, Stokke BT, Espevik T, Husebye H. Klein DC, et al. Traffic. 2015 Jul;16(7):677-90. doi: 10.1111/tra.12274. Epub 2015 Mar 24. Traffic. 2015. PMID: 25707286 - CD14 dependence of TLR4 endocytosis and TRIF signaling displays ligand specificity and is dissociable in endotoxin tolerance.
Rajaiah R, Perkins DJ, Ireland DD, Vogel SN. Rajaiah R, et al. Proc Natl Acad Sci U S A. 2015 Jul 7;112(27):8391-6. doi: 10.1073/pnas.1424980112. Epub 2015 Jun 23. Proc Natl Acad Sci U S A. 2015. PMID: 26106158 Free PMC article. - Functional interfaces between TICAM-2/TRAM and TICAM-1/TRIF in TLR4 signaling.
Funami K, Matsumoto M, Oshiumi H, Inagaki F, Seya T. Funami K, et al. Biochem Soc Trans. 2017 Aug 15;45(4):929-935. doi: 10.1042/BST20160259. Epub 2017 Jun 19. Biochem Soc Trans. 2017. PMID: 28630139 Review. - TLR4 and CD14 trafficking and its influence on LPS-induced pro-inflammatory signaling.
Ciesielska A, Matyjek M, Kwiatkowska K. Ciesielska A, et al. Cell Mol Life Sci. 2021 Feb;78(4):1233-1261. doi: 10.1007/s00018-020-03656-y. Epub 2020 Oct 15. Cell Mol Life Sci. 2021. PMID: 33057840 Free PMC article. Review.
Cited by
- An integrated analysis of human myeloid cells identifies gaps in in vitro models of in vivo biology.
Rajab N, Angel PW, Deng Y, Gu J, Jameson V, Kurowska-Stolarska M, Milling S, Pacheco CM, Rutar M, Laslett AL, Lê Cao KA, Choi J, Wells CA. Rajab N, et al. Stem Cell Reports. 2021 Jun 8;16(6):1629-1643. doi: 10.1016/j.stemcr.2021.04.010. Epub 2021 May 13. Stem Cell Reports. 2021. PMID: 33989517 Free PMC article. - Plasma Exosomal miRNA Levels after Radiotherapy Are Associated with Early Progression and Metastasis of Cervical Cancer: A Pilot Study.
Cho O, Kim DW, Cheong JY. Cho O, et al. J Clin Med. 2021 May 13;10(10):2110. doi: 10.3390/jcm10102110. J Clin Med. 2021. PMID: 34068397 Free PMC article. - Mannan Enhances IL-12 Production by Increasing Bacterial Uptake and Endosomal Degradation in L. acidophilus and S. aureus Stimulated Dendritic Cells.
Mathiesen R, Eld HMS, Sørensen J, Fuglsang E, Lund LD, Taverniti V, Frøkiær H. Mathiesen R, et al. Front Immunol. 2019 Nov 15;10:2646. doi: 10.3389/fimmu.2019.02646. eCollection 2019. Front Immunol. 2019. PMID: 31803184 Free PMC article. - An alternative model for type I interferon induction downstream of human TLR2.
Oosenbrug T, van de Graaff MJ, Haks MC, van Kasteren S, Ressing ME. Oosenbrug T, et al. J Biol Chem. 2020 Oct 16;295(42):14325-14342. doi: 10.1074/jbc.RA120.015283. Epub 2020 Aug 12. J Biol Chem. 2020. PMID: 32796029 Free PMC article. - Single-cell transcriptomic landscape reveals tumor specific innate lymphoid cells associated with colorectal cancer progression.
Qi J, Crinier A, Escalière B, Ye Y, Wang Z, Zhang T, Batista L, Liu H, Hong L, Wu N, Zhang M, Chen L, Liu Y, Shen L, Narni-Mancinelli E, Vivier E, Su B. Qi J, et al. Cell Rep Med. 2021 Jul 27;2(8):100353. doi: 10.1016/j.xcrm.2021.100353. eCollection 2021 Aug 17. Cell Rep Med. 2021. PMID: 34467243 Free PMC article.
References
Publication types
MeSH terms
Substances
LinkOut - more resources
Full Text Sources
Other Literature Sources
Molecular Biology Databases
Research Materials
Miscellaneous

