Phospholipid-flipping activity of P4-ATPase drives membrane curvature - PubMed (original) (raw)
Phospholipid-flipping activity of P4-ATPase drives membrane curvature
Naoto Takada et al. EMBO J. 2018.
Abstract
P4-ATPases are phospholipid flippases that translocate phospholipids from the exoplasmic/luminal to the cytoplasmic leaflet of biological membranes. All P4-ATPases in yeast and some in other organisms are required for membrane trafficking; therefore, changes in the transbilayer lipid composition induced by flippases are thought to be crucial for membrane deformation. However, it is poorly understood whether the phospholipid-flipping activity of P4-ATPases can promote membrane deformation. In this study, we assessed membrane deformation induced by flippase activity via monitoring the extent of membrane tubulation using a system that allows inducible recruitment of Bin/amphiphysin/Rvs (BAR) domains to the plasma membrane (PM). Enhanced phosphatidylcholine-flippase activity at the PM due to expression of ATP10A, a member of the P4-ATPase family, promoted membrane tubulation upon recruitment of BAR domains to the PM This is the important evidence that changes in the transbilayer lipid composition induced by P4-ATPases can deform biological membranes.
Keywords: BAR domain; curvature; flippase; lipid; plasma membrane.
© 2018 The Authors.
Figures
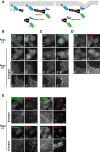
Figure EV1. Membrane tubulation is induced by recruitment of the N‐BAR domain, but not of the ΔN‐BAR or F‐BAR domain, to the PM
- A
Schematic illustration of the CID system that allows acute recruitment of BAR domains to the PM following treatment with rapamycin. FP, fluorescent protein; FKBP, FK506‐binding protein; FRB, FKBP–rapamycin‐binding domain. - B–D
HeLa cells were transiently co‐transfected with expression vectors for Lyn‐TagBFP2‐FRB (PM) and EGFP‐FKBP‐N‐BAR (N‐BAR), EGFP‐FKBP‐ΔN‐BAR (ΔN‐BAR), or mCherry‐FKBP‐F‐BAR (F‐BAR). After 24 h, cells were treated with vehicle alone [Rapa(−)] or 200 nM rapamycin [Rapa(+)] for 15 min, fixed, and observed using an epifluorescence microscope. Panels b′, b″, d′, and d″ show enlarged images of the insets in b and d. Scale bars, 20 μm. Scale bars in enlarged images, 2 μm. - E
HeLa cells were transiently co‐transfected with expression vectors for Lyn‐TagBFP2‐FRB (PM) and EGFP‐FKBP‐N‐BAR (N‐BAR). After 24 h, cells were treated with 200 nM rapamycin for 15 min, fixed, and stained with an antibody against EEA1, Lamp‐1, sorting nexin 1 (SNX1), or GM130 (markers of early endosomes, late endosomes/lysosomes, endosomes, and the Golgi complex, respectively) followed by an Alexa Fluor 555‐conjugated anti‐mouse secondary antibody. Insets were enlarged. Scale bars, 20 μm. Scale bars in enlarged images, 2 μm.
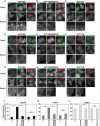
Figure 1. Enhancement of PC‐flippase activity at the PM upon expression of ATP10A triggers membrane tubulation by PM‐recruited ΔN‐BAR and F‐BAR domains
- A–I
HeLa cells stably expressing C‐terminally HA‐tagged ATP10A, ATP10A(E203Q), and ATP11A were transiently co‐transfected with expression vectors for Lyn‐TagBFP2‐FRB (PM) and EGFP‐FKBP‐N‐BAR (N‐BAR), EGFP‐FKBP‐ΔN‐BAR (ΔN‐BAR), or mCherry‐FKBP‐F‐BAR (F‐BAR). Cells were treated with vehicle alone [Rapa(−)] or 200 nM rapamycin [Rapa (+)] for 15 min and fixed. Fixed cells were stained for an anti‐HA primary antibody, followed by a Cy3‐conjugated (A–C, G–I) or Alexa Fluor 488‐conjugated (D–F) anti‐rat secondary antibody. Panels b′ and d′ show enlarged images of the insets in b and d, respectively. Scale bars, 20 μm. Scale bars in enlarged images, 2 μm. - J–L
Cells containing membrane tubules were counted [420–672 cells (ΔN‐BAR), 417–527 cells (F‐BAR), and 422–805 cells (N‐BAR) per sample]. Graphs display means ± SD of three independent experiments. **P < 0.01; ***P < 0.005; Welch's _t_‐test.
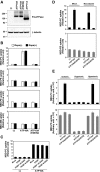
Figure EV2. Flippase activity in ATP10A‐expressing cells
- A
HeLa cells stably expressing HA‐tagged P4‐ATPases were lysed and subjected to SDS–PAGE and immunoblotting with an anti‐HA or anti‐β‐tubulin antibody to determine the total level of the P4‐ATPase protein. - B–E
Cells were then incubated with the indicated NBD‐labeled lipids at 15°C for 15 min. After extraction with fatty acid‐free BSA, the residual fluorescence intensity associated with cells was determined by flow cytometry. The fold increase in NBD‐lipid uptake relative to that in vector‐infected control cells (−) (B and D) or mCherry‐FKBP‐transfected cells (FKBP, (−)) (C) is shown. Graphs display means ± SD of three independent experiments. (B) HeLa cells stably expressing P4‐ATPases were treated with vehicle alone [Rapa(−)] or 200 nM rapamycin [Rapa(+)] for 15 min. (C) HeLa cells stably expressing ATP10A were mock‐transfected (Mock) or transiently co‐transfected with expression vectors for Lyn‐TagRFP‐FRB (PM) and mCherry‐FKBP, mCherry‐FKBP‐ΔN‐BAR (ΔN‐BAR), or mCherry‐FKBP‐N‐BAR (N‐BAR). After 24 h, cells were treated with 200 nM rapamycin. (D, E) HeLa cells stably expressing P4‐ATPases were treated with vehicle alone (Mock), or 16.7 μM of nocodazole or incubated in isotonic, hypotonic, or hypertonic medium.
Figure 2. Expression of ATP10A does not affect the integrity of the actin cytoskeleton or microtubules
- A, B
HeLa cells stably expressing C‐terminally HA‐tagged ATP10A or ATP10A(E203Q) were transiently co‐transfected with expression vectors for Lyn‐TagBFP2‐FRB (PM) and EGFP‐FKBP‐ΔN‐BAR (ΔN‐BAR). Cells were treated with 200 nM rapamycin for 15 min and fixed. Fixed cells were permeabilized and incubated with Alexa Fluor 555‐conjugated phalloidin (A) or stained with an anti‐β‐tubulin primary antibody followed by an Alexa Fluor 555‐conjugated anti‐mouse secondary antibody (B). Panels a′ and d′–i′ show enlarged images of the insets in a and d–i, respectively. Scale bars, 20 μm. Scale bars in enlarged images, 2 μm.
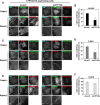
Figure 3. Disruption of microtubules reduced tubular structures caused by PM‐recruited BAR domains
- A–G
(A, B, E) HeLa cells were transiently co‐transfected with expression vectors for Lyn‐TagBFP2‐FRB (PM) and EGFP‐FKBP‐N‐BAR (N‐BAR), or EGFP‐FKBP‐ΔN‐BAR (ΔN‐BAR). (C, D, F, G) HeLa cells stably expressing HA‐tagged ATP10A were transiently co‐transfected with expression vectors for Lyn‐TagBFP2‐FRB (PM) and EGFP‐FKBP‐ΔN‐BAR (ΔN‐BAR), or mCherry‐FKBP‐F‐BAR (F‐BAR). (A–G) Transfected cells were pretreated with vehicle alone (Mock) or nocodazole (Noz). The cells were further treated with vehicle alone or nocodazole in the presence of rapamycin. Cells were fixed, permeabilized, and stained with antibody against β‐tubulin followed by Alexa Fluor 555‐ or Alexa Fluor 488‐conjugated anti‐mouse secondary antibody. Panels of b′, c′, e′, e″, f′, and f″ are enlarged images of insets in b, c, e, and f. Scale bars, 20 μm. Scale bars in enlarged images, 2 μm. (E–G) Cells containing membrane tubules were counted [429–492 cells (E), 397–479 cells (F), and 404–436 cells (G) in each sample]. Graphs display means ± SD from three independent experiments. *P < 0.05; ****P < 0.001; Welch's _t_‐test. The experiments of (G) were performed together with Fig 5F, and thus, the graph of Mock is equivalent to that of Fig 5F.
Figure 4. Hypotonic treatment of HeLa cells prevents membrane tubulation induced by the PM‐recruited N‐BAR domain
HeLa cells were transiently co‐transfected with expression vectors for Lyn‐TagBFP2‐FRB (PM) and EGFP‐FKBP‐N‐BAR (N‐BAR) or EGFP‐FKBP‐ΔN‐BAR (ΔN‐BAR).
- A–D
Transfected cells were incubated in isotonic medium containing rapamycin (Mock) or exposed to hypotonic or hypertonic medium containing rapamycin. Cells were fixed, permeabilized, and incubated with Alexa Fluor 555‐conjugated phalloidin. Panels b′, c′, e′, and f′ show enlarged images of the insets in b, c, e, and f, respectively. Scale bars, 20 μm. Scale bars in enlarged images, 2 μm. - E–G
Cells containing membrane tubules were counted [416–577 cells (N‐BAR) and 402–467 cells (ΔN‐BAR) per sample]. Graphs display means ± SD of three independent experiments. ***P < 0.005; Welch's _t_‐test.
Figure 5. Hypotonic treatment of ATP10A‐expressing cells prevents membrane tubulation induced by PM‐recruited ΔN‐BAR and F‐BAR domains
- A–F
HeLa cells stably expressing C‐terminally HA‐tagged ATP10A were transiently co‐transfected with expression vectors for Lyn‐TagBFP2‐FRB (PM) and EGFP‐FKBP‐ΔN‐BAR (ΔN‐BAR; A, B, E) or mCherry‐FKBP‐F‐BAR (F‐BAR; C, D, F). Transfected cells were incubated in isotonic medium containing rapamycin (Mock) or exposed to hypotonic or hypertonic medium containing rapamycin. Cells were fixed, permeabilized, and incubated with Alexa Fluor 555‐conjugated (A, B) or Alexa Fluor 488‐conjugated (C, D) phalloidin. Panels b′, c′, e′, and f′ show enlarged images of the insets in b, c, e, and f, respectively. Scale bars, 20 μm. Scale bars in enlarged images, 2 μm. (E, F) Cells containing membrane tubules were counted [400–452 cells (ΔN‐BAR) and 404–436 cells (F‐BAR) per sample]. Graphs display means ± SD of three independent experiments. **P < 0.01; ***P < 0.005; Welch's _t_‐test.
Figure EV3. PM‐recruited ΔN‐BAR and F‐BAR domains do not induce membrane tubulation in ATP10A(E203Q)‐expressing cells
- A–D
HeLa cells stably expressing C‐terminally HA‐tagged ATP10A(E203Q) were transiently co‐transfected with expression vectors for Lyn‐TagBFP2‐FRB (PM) and EGFP‐FKBP‐ΔN‐BAR (ΔN‐BAR; A, B) or mCherry‐FKBP‐F‐BAR (F‐BAR; C, D). Transfected cells were incubated in isotonic medium containing rapamycin (Mock) or exposed to hypotonic or hypertonic medium containing rapamycin. Cells were fixed, permeabilized, and incubated with Alexa Fluor 555‐ or 488‐conjugated phalloidin. Scale bars, 20 μm. Scale bars in enlarged images, 2 μm.
Figure EV4. Depletion of ATP10A in ATP10A‐expressing cells
- RT–PCR was performed using total RNA isolated from the indicated cell lines. RNA was omitted in control reactions.
- HeLa cells stably expressing HA‐tagged ATP10A were treated with a pool of siRNAs targeting LacZ or ATP10A. After 120 h, cells were lysed and subjected to SDS–PAGE and immunoblotting with an anti‐HA or anti‐β‐tubulin antibody. (−) indicates parental HeLa cells.
- Cells treated with a pool of siRNAs targeting LacZ or ATP10A were incubated with NBD‐PC at 15°C as described in the legend of Fig EV2. The fold increase in NBD‐PC uptake relative to that in parental cells is shown. Graphs display means ± SD of three independent experiments.
Figure 6. Depletion of ATP10A abrogates membrane tubulation induced by ΔN‐BAR and F‐BAR domains in ATP10A‐expressing cells
- A–F
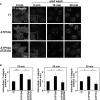
HeLa cells stably expressing HA‐tagged ATP10A were transfected with a pool of siRNAs against LacZ (as a control) or ATP10A. After 96 h, cells were transiently co‐transfected with expression vectors for Lyn‐TagBFP2‐FRB (PM) and EGFP‐FKBP‐N‐BAR (N‐BAR), EGFP‐FKBP‐ΔN‐BAR (ΔN‐BAR), or mCherry‐FKBP‐F‐BAR (F‐BAR). Cells were treated with vehicle alone [Rapa(−)] or 200 nM rapamycin [Rapa(+)] for 15 min and fixed. Fixed cells were stained with an anti‐HA primary antibody followed by a Cy3‐conjugated (A, E) or Alexa Fluor 488‐conjugated (C) anti‐rat secondary antibody. Scale bars, 20 μm. Scale bars in enlarged images, 2 μm. (B, D, F) Cells containing membrane tubules were counted [410–535 cells (ΔN‐BAR), 389–464 cells (F‐BAR), and 331–645 cells (N‐BAR) per sample]. Graphs display means ± SD of three independent experiments. **P < 0.01; ***P < 0.005; Welch's _t_‐test.
Figure 7. Expression of ATP10A increases the internalization rate of β1‐integrin
HeLa cells stably expressing C‐terminally HA‐tagged ATP10A, ATP10A(E203Q), or ATP11A were incubated with an anti‐β1‐integrin antibody at 4°C for 1 h, washed with ice‐cold PBS to remove unbound antibodies, and incubated at 37°C for the indicated durations to allow internalization of β1‐integrin. Cells were washed with acidic solution to remove residual antibodies on the PM prior to fixation. Fixed cells were permeabilized and incubated with a Cy3‐conjugated anti‐rat secondary antibody and Alexa Fluor 488‐conjugated phalloidin.
- Representative images are displayed. Insets show phalloidin staining. Scale bars, 20 μm.
- Fluorescence intensities of internalized β1‐integrin were quantitated using MetaMorph software. A total of 115–224 cells were analyzed per sample. Graphs display means ± SD of four independent experiments. *P < 0.05; **P < 0.01; ***P < 0.005; a one‐way ANOVA was performed to assess variance.
Figure EV5. ATP1A1 localization in ATP10A‐expressing cells
- HeLa cells stably expressing C‐terminally HA‐tagged ATP10A and ATP10A(E203Q) were fixed and stained for an anti‐HA and anti‐ATP1A1 primary antibodies, followed by a Cy3‐conjugated anti‐rat and Alexa Fluor 488‐conjugated anti‐rabbit secondary antibodies. Scale bars, 20 μm.
- Cells in which ATP1A1 localized to the plasma membrane (black) or to the plasma membrane and intracellular puncta (white) were counted: Counts were normalized against the total number of counted cells (562–644 cells). Graphs display means of two independent experiments, and error bars show minimum and maximum values.
Figure EV6. Internalization of β1‐integrin in _ATP10A_‐knockout (KO) cells
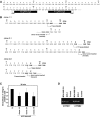
ATP10A gene of MDA‐MB‐231 cells was edited by the CRISPR/Cas9 system.
- Target sequences of ATP10A gene are shown.
- In clone 1–1, clone 2–1, and clone 2–6, ATP10A carries biallelic modifications: insertion of a base and donor vector (reverse integration), deletion of 31 bases and insertion of donor vector (forward integration), and deletion of a base and insertion of donor vector (forward integration), respectively.
- Parental MDA‐MB‐231 cells (−) and _ATP10A_‐KO cell lines were incubated with an anti‐β1‐integrin antibody at 4°C for 30 min, washed with ice‐cold PBS to remove unbound antibodies, and incubated at 37°C for 30 min to allow internalization of β1‐integrin. Cells were washed with acidic solution to remove residual antibodies on the PM prior to fixation. Fixed cells were permeabilized and incubated with a Cy3‐conjugated anti‐rat secondary antibody. Fluorescence intensities of internalized β1‐integrin were quantitated using MetaMorph software. A total of 70–174 cells were analyzed per sample. Graphs display means ± SD of three independent experiments. A one‐way ANOVA was performed to assess variance.
- RT–PCR was performed using total RNA isolated from the indicated cell lines. RNA was omitted in control reactions.
Figure 8. Schematic illustration of the sensing and/or generation of membrane curvature by BAR domains
- Penetration of the N‐terminal amphipathic helix of the N‐BAR domain has a wedging effect, leading to increased membrane curvature into the cytoplasm. The N‐BAR domain subsequently senses this membrane curvature and triggers membrane tubulation by oligomerizing along the membrane (PDB: 4ATM, N‐BAR domain of amphiphysin 1).
- By contrast, the ΔN‐BAR domain, which lacks the amphipathic helix, cannot generate membrane curvature by itself, but can still sense membrane curvature. Thus, the ΔN‐BAR domain can generate membrane tubulation following induction of membrane deformation by P4‐ATPases.
Similar articles
- Phospholipid flippase activities and substrate specificities of human type IV P-type ATPases localized to the plasma membrane.
Takatsu H, Tanaka G, Segawa K, Suzuki J, Nagata S, Nakayama K, Shin HW. Takatsu H, et al. J Biol Chem. 2014 Nov 28;289(48):33543-56. doi: 10.1074/jbc.M114.593012. Epub 2014 Oct 14. J Biol Chem. 2014. PMID: 25315773 Free PMC article. - Phosphatidylserine flipping by the P4-ATPase ATP8A2 is electrogenic.
Tadini-Buoninsegni F, Mikkelsen SA, Mogensen LS, Molday RS, Andersen JP. Tadini-Buoninsegni F, et al. Proc Natl Acad Sci U S A. 2019 Aug 13;116(33):16332-16337. doi: 10.1073/pnas.1910211116. Epub 2019 Aug 1. Proc Natl Acad Sci U S A. 2019. PMID: 31371510 Free PMC article. - Phospholipid Flippase ATP10A Translocates Phosphatidylcholine and Is Involved in Plasma Membrane Dynamics.
Naito T, Takatsu H, Miyano R, Takada N, Nakayama K, Shin HW. Naito T, et al. J Biol Chem. 2015 Jun 12;290(24):15004-17. doi: 10.1074/jbc.M115.655191. Epub 2015 May 6. J Biol Chem. 2015. PMID: 25947375 Free PMC article. - Substrates of P4-ATPases: beyond aminophospholipids (phosphatidylserine and phosphatidylethanolamine).
Shin HW, Takatsu H. Shin HW, et al. FASEB J. 2019 Mar;33(3):3087-3096. doi: 10.1096/fj.201801873R. Epub 2018 Dec 3. FASEB J. 2019. PMID: 30509129 Review. - On the molecular mechanism of flippase- and scramblase-mediated phospholipid transport.
Montigny C, Lyons J, Champeil P, Nissen P, Lenoir G. Montigny C, et al. Biochim Biophys Acta. 2016 Aug;1861(8 Pt B):767-783. doi: 10.1016/j.bbalip.2015.12.020. Epub 2015 Dec 31. Biochim Biophys Acta. 2016. PMID: 26747647 Review.
Cited by
- De Novo Missense Variations of ATP8B2 Impair Its Phosphatidylcholine Flippase Activity.
Takatsu H, Nishimura N, Kosugi Y, Ogawa H, Nakayama K, Colin E, Platzer K, Abou Jamra R, Redler S, Prouteau C, Ziegler A, Shin HW. Takatsu H, et al. Mol Cell Biol. 2024;44(11):473-488. doi: 10.1080/10985549.2024.2391829. Epub 2024 Sep 2. Mol Cell Biol. 2024. PMID: 39219493 Free PMC article. - Consensus, controversies, and conundrums of P4-ATPases: The emerging face of eukaryotic lipid flippases.
Duan HD, Li H. Duan HD, et al. J Biol Chem. 2024 Jun;300(6):107387. doi: 10.1016/j.jbc.2024.107387. Epub 2024 May 17. J Biol Chem. 2024. PMID: 38763336 Free PMC article. Review. - Lipid Transporters Beam Signals from Cell Membranes.
Ristovski M, Farhat D, Bancud SEM, Lee JY. Ristovski M, et al. Membranes (Basel). 2021 Jul 26;11(8):562. doi: 10.3390/membranes11080562. Membranes (Basel). 2021. PMID: 34436325 Free PMC article. Review. - Membrane structure-responsive lipid scrambling by TMEM63B to control plasma membrane lipid distribution.
Miyata Y, Takahashi K, Lee Y, Sultan CS, Kuribayashi R, Takahashi M, Hata K, Bamba T, Izumi Y, Liu K, Uemura T, Nomura N, Iwata S, Nagata S, Nishizawa T, Segawa K. Miyata Y, et al. Nat Struct Mol Biol. 2025 Jan;32(1):185-198. doi: 10.1038/s41594-024-01411-6. Epub 2024 Oct 18. Nat Struct Mol Biol. 2025. PMID: 39424995 - Structural insight into an Arl1-ArfGEF complex involved in Golgi recruitment of a GRIP-domain golgin.
Duan HD, Jain BK, Li H, Graham TR, Li H. Duan HD, et al. Nat Commun. 2024 Mar 2;15(1):1942. doi: 10.1038/s41467-024-46304-w. Nat Commun. 2024. PMID: 38431634 Free PMC article.
References
Publication types
MeSH terms
Substances
LinkOut - more resources
Full Text Sources
Other Literature Sources
Molecular Biology Databases
Research Materials
