T cell microvilli constitute immunological synaptosomes that carry messages to antigen-presenting cells - PubMed (original) (raw)
doi: 10.1038/s41467-018-06090-8.
YeVin Mun 1 2, Kyung-Sik Lee 1 2, Yoo-Jin Park 1 2, Jeong-Su Park 1 2, Jin-Hwa Park 1 2, Bu-Nam Jeon 1 2, Chang-Hyun Kim 1 2, Youngsoo Jun 1, Young-Min Hyun 3, Minsoo Kim 4, Sang-Myeong Lee 5, Chul-Seung Park 1, Sin-Hyeog Im 6 7, Chang-Duk Jun 8 9
Affiliations
- PMID: 30194420
- PMCID: PMC6128830
- DOI: 10.1038/s41467-018-06090-8
T cell microvilli constitute immunological synaptosomes that carry messages to antigen-presenting cells
Hye-Ran Kim et al. Nat Commun. 2018.
Abstract
Microvilli on T cells have been proposed to survey surfaces of antigen-presenting cells (APC) or facilitate adhesion under flow; however, whether they serve essential functions during T cell activation remains unclear. Here we show that antigen-specific T cells deposit membrane particles derived from microvilli onto the surface of cognate antigen-bearing APCs. Microvilli carry T cell receptors (TCR) at all stages of T cell activation and are released as large TCR-enriched, T cell microvilli particles (TMP) in a process of trogocytosis. These microvilli exclusively contain protein arrestin-domain-containing protein 1, which is directly involved in membrane budding and, in combination with vacuolar protein-sorting-associated protein 4, transforms large TMPs into smaller, exosome-sized TMPs. Notably, TMPs from CD4+ T cells are enriched with LFA-2/CD2 and various cytokines involved in activating dendritic cells. Collectively, these results demonstrate that T cell microvilli constitute "immunological synaptosomes" that carry T cell messages to APCs.
Conflict of interest statement
The authors declare no competing interests.
Figures
Fig. 1
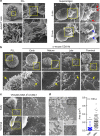
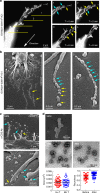
T cells generate microvillus-originated particles upon TCR stimulation. a T cell microvillus polarization toward antigen-bearing B cells at the early stage of IS. SEM of resting single (left) or two adjacent (right) Jurkat T cells on PLL (i) and co-incubated with SEE-loaded Raji B cells (5, 30 min) (ii). Arrows indicate microvilli (red) and membrane ruffles (blue). b, c SEM of OTII naive CD4+ T cells on PLL with the anti-CD3 antibody (b) or OVA peptide/I-Ab and ICAM-1 (c) at various time points. Early (early stage, 1 min), mature (1–5 min), late (10–20 min), and terminal stages ( > 20 min). d Jurkat T cells were placed on anti-CD3-coated coverglass for 30 min and observed by TEM. The areas of TMPs and mitochondria were quantitated using ImageJ software. *P < 0.01 vs. mitochondria
Fig. 2
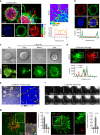
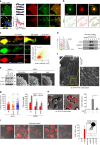
T cells generate V5G+ microvilli particles on anti-CD3-coated surfaces. a V5G+ Jurkat T cells were imaged by confocal microscopy and color-coded by z-position (left). Comparison of V5G fluorescence intensity between microvillus shaft and membrane surface (right). b Co-localization of V5G with F-actin. V5G+ Jurkat T cells on PLL were stained with TRITC-phalloidin. c Confocal images of V5G+ Jurkat T cells on anti-CD3-coated coverglass. Cells were monitored for 60 min, and representative images of each stage are shown. d Co-localization of V5G+ microvilli with F-actin. V5G+ Jurkat T cells on anti-CD3-coated coverglass and incubated for 20 min to 30 min were stained with TRITC-phalloidin. The fluorescence intensity profiles from a and b were analysed with ZEN v2.1 (for a, b, and d; Carl Zeiss). e Separated V5G+ microvilli particles are colored at the terminal stage. f Real-time V5G+ microvilli particles generation from activated T cells. V5G+ Jurkat T cells on anti-CD3-coated coverglass were observed by TIRFM (see also Supplementary Movie 1). g Jurkat T cells expressing V5G and TCRζ_ptdTomato were placed on anti-CD3-coated coverglass for 30 min. Protein localization at the terminal stage of T cell activation was determined. For LAMP-1 imaging, primary and secondary antibodies were used
Fig. 3
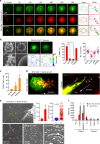
TCR-enriched microvillus particles are released to a greater extent during T cell kinapse mode. a Co-localization of V5G with TCR microclusters. V5G+ OTII CD4+ T cells were stained with anti-TCRβ (H57Fab-Alexa594) and examined on a planar bilayer presenting OVA peptide/I-Ab and ICAM-1 (see also Supplementary Movie 3). Relative time scales starting from the time of cell spreading are labeled on the images. Representative trajectory of individual TCR microclusters are shown in the right panel. b V5G+ OTII CD4+ T cells were pretreated for 30 min with (Lat A; 237 nM), JAS (100 nM), and CK636 (100 μM), followed by SEM (left) and TIRFM imaging to visualize V5G+ microvillus movement on the lipid bilayer (middle). Boxed regions are shown enlarged at the bottom of the panels. Representative trajectories of individual V5G clusters (bottom). Statistical analyses of the frequency of cSMAC formation and the number of V5G clusters in OTII CD4+ T cells (right). *P < 0.05 vs. none. Data represent the mean of three experiments ± SEM. **c**, **d** Release of TCR+ TMPs during synapse and kinapse. V5G+ OTII CD4+ T cells were stained with anti-TCRβ (H57Fab-Alexa594) and observed on a lipid bilayer presenting OVA peptide/I-Ab and ICAM-1 by TIRFM (see also Supplementary Movie 4). The numbers of TCRβ+ TMPs were quantitated using ImageJ software (**c**). *_P_ < 0.01 vs. no antigen (No-Ag). Data represent the mean of three experiments ± SEM. **e** L- and S-TMP release during synapse and kinapse. Cells from (**d**; synapse–kinapse) were subjected to SEM analysis. P, pSMAC; C, cSMAC. Particle diameters were analysed using 500 particles in the C and P of a single cell, and > 30 cells were examined. Data represent the mean of three experiments ± SEM. *P < 0.001 vs. C. f TMP generation from OTII CD4+ T cells was examined in each condition. Cells were subjected to SEM, and the number of TMPs per cell was analysed using ImageJ software. Data represent the mean of three experiments ± SEM. *P < 0.001 vs. PLL
Fig. 4
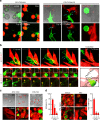
T cells leave TMPs on the surface of APCs in an integrin LFA-1-dependent manner. a Confocal microscopy of V5G+ OTII CD4+ T cells incubated with OVA323–339-loaded B cells or DCs for 30 min. Arrows indicate multiple contact sites. b Time-lapse imaging of V5G+-TMP generation from mouse T cells. CD4+ T cells were retrovirally transduced with V5G and incubated with SEB-loaded DCs for 30 min. Cyan arrows indicate the multiple contact sites. V5G+ TMPs (yellow arrows) on DCs in the last panel were visualized by isosurface rendering using Imaris software (see also Supplementary Movies 5 and 6). c V5G+ OTII CD4+ T cells from a were incubated for 1 h and observed by confocal microscopy. V5G+ TMPs are indicated by yellow arrows. d Adhesion of CD4+ T cells from wild type_, LFA-1_ +/−, and LFA-1 −/− mice to mICAM-1-Fc-coated plates after anti-CD3/28 stimulation. Data represent the mean of three experiments ± SEM (left). Mouse CD4+ T cells from wild type_, LFA-1_ +/−, and LFA-1 −/− mice were retrovirally transduced with V5G, incubated as described in a, and observed by confocal microscopy. The number of V5G+ TMPs per DC was quantified using Imaris software. Data represent the mean of three experiments ± SEM. *P < 0.01 vs. wild-type T cells
Fig. 5
L-TMPs undergo morphological changes during and after disconnection from the cell body and are comparable in size to exosomes. a Fragmentation of V5G+ microvilli particles during and after disconnection from T cells in kinapse on a lipid bilayer (yellow arrows = fragmented sites; blue arrows = sites yet to be fragmented). b Microvillus-originated particles in the process of fragmentation. Cells from (a) were observed by SEM. Yellow arrows indicate the cleavage of L-TMPs into S-TMPs (1). Cyan blue arrows indicate the pre-cleavage sites in the microvilli (2) and L-TMPs (3). c SEM analysis of TMPs generated from CD3+ T cells on anti-CD3-coated coverglass. Yellow arrows indicate the cleaved TMPs from microvilli. Cyan blue arrows indicate TMPs budding from microvilli tips. d Mouse and human TMPs were harvested as described in Supplementary Fig. 5 and observed by SEM and TEM. The area and roundness of TMPs from human and mouse T cells were measured using ImageJ and Imaris software, respectively. Data represent the mean of three experiments ± SEM
Fig. 6
Identification of proteins in TMPs by LC-MS/MS. a Unsupervised clustering (upper) and PCA (bottom) of LC-MS/MS-based whole-proteome data from total, vesicle, membrane, and TMP groups. The heatmap represents relative expression patterns of proteins across the four groups, and hierarchical clustering of samples (column) and proteins (rows) was based on Pearson’s correlation coefficient used to measure the distance. b Comparison of PSMs between TMPs and vesicles. c Western blot analyses of total lysates, membrane, TMPs, and vesicles from mouse CD3+ T cells
Fig. 7
L-TMPs are further fragmented by membrane-budding complexes. a Localization of Arrdc1 and TSG101 in the microvillus tips of HEK293T cells. Arrdc1_GFP was represented with pseudo-color coding according to fluorescence intensity. Cropped images from selected microvilli (yellow arrows) are displayed from i to v (left). Recruitment of TSG101 to the membrane in _Arrdc1_-overexpressing cells (right). b Co-clustering of Arrdc1_GFP and TCRβ into the cSMAC. Arrdc1_GFP+ OTII CD4+ T cells were stained with anti-TCRβ (H57Fab-Alexa594) and examined as described in Fig. 3a. Images were selected at 300-s post-recording, and the representative trajectories are shown in the bottom panel. c Release of TCR+/Arrdc1_GFP+ TMPs during the synapse–kinapse transition stage. Arrdc1_GFP+ OTII CD4+ T cells were stained with anti-TCRβ and observed as described in Fig. 3d. d Purified TMPs were ultracentrifuged with a sucrose gradient and blotted with anti-Arrdc1, anti-CD3ζ, and anti-β-actin (lanes 1–6, sucrose fraction; P, pellet). e Knockdown of Vps4 and Arrdc1 by siRNA and confirmation of siRNA efficiency by western blot analysis. Surface analysis of CD4+ T cells by SEM after knockdown of the indicated proteins. f, g Representative SEM analysis of _Vps4_-deficient OTII CD4+ T cells on the lipid bilayer (f). Particle diameters and numbers of TMPs per cell were analysed by ImageJ software (g). Data represent the mean of three experiments ± SEM. *P < 0.05 vs. scrambled (Sc., left) or scrambled (20–40 nm, right) siRNA. **P < 0.001 vs. scrambled siRNA (40–100 nm). h TCR+ TMP release on an OVA peptide/I-Ab lipid bilayer with or without ICAM-1. The number of TCR+ TMPs per cell was analysed by ImageJ software. Data represent the mean of three experiments ± SEM. *P < 0.001 vs. pMHC/ICAM-1. i TCR+ TMP release on plates coated with various antibodies. Data represent the mean of three experiments ± SEM. *P < 0.001 vs. PLL
Fig. 8
4-TMPs activate DCs regardless of TCR engagement. a Representative confocal images of Fluo-3-loaded DCs placed on a 4-TMP-deposited lipid bilayer. b Fluo-3-loaded DCs from wild type or TLR4 −/− mice were stimulated with 4-TMPs purified from CD4+ T cells in the presence or absence of SEB. Calcium changes were analysed by flow cytometry for 300 s. Data are representative of at least three separate experiments. c Surface protein expression on DCs induced by 4-TMPs. DCs (5 × 10⁶) from wild-type mice were treated with 4-TMPs obtained from CD4+ T cells (0.05–1 × 10⁸) at the indicated ratio (DC:T = 1:1 to 1:20). After 24 h, the expression of CD86 was analysed by flow cytometry and expressed as the mean fluorescence intensity (MFI). Data represent the mean of three experiments ± SEM. *P < 0.01 vs. 1:0. d DCs (5 × 10⁶) from wild type or TLR4 −/− mice were treated with 4-TMPs (5 × 10⁷). After 24 h, the expression of CD86, CD40, and CD80 was determined as described in c. In some cases, FcγR was blocked 30 min before 4-TMP treatment. *P < 0.01 vs. PBS-treated group
Fig. 9
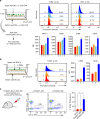
Physical interaction between TMPs and the DC surface is critical for TMP-mediated DC activation. a Schematic diagram of the transwell system (left). After co-incubation for 2 h, DCs were acid washed and evaluated for TCRβ and V5G transfer (upper panel), followed continued incubation for 24 h. The expression of MHC class II, CD80, CD86, and CD40 on DCs (CD11c+) was analysed by flow cytometry and expressed as histograms and mean fluorescence intensity (MFI). Data represent the mean of three experiments ± SEM. *P < 0.01 vs. c. b 4-TMPs from anti-CD3-coated surfaces were treated with DCs as depicted in the schematic diagram (left) and incubated as described in a. TCRβ, CD86, and CD40 presentation on DCs (CD11c+) was analysed as described in a. Data represent the mean of three experiments ± SEM. *P < 0.01 vs. c. c Transfer of TCRs to DCs in vivo. OTII TCR transgenic mice were administered OVA257-264 and OVA323-339 (100 μg; i.p.) in PBS, respectively. After 48 h, draining lymph nodes were taken and dissociated, and cells were treated by acid buffer and stained for the indicated surface markers. Boxed areas represent TCRβ expression on DCs. Data are represented by one of three independent experiments with similar results. *P < 0.01 vs. none or OVA257-264
Fig. 10
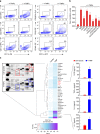
CD2/CD58 and LFA-1/ICAM-1 play important roles in TMP-mediated DC activation. a DCs (5 × 10⁶) were treated with either PBS or 4-TMPs (5 × 10⁷) for 2 h, and the transfer of indicated proteins on DCs (CD11c+) was analysed by flow cytometry. Data represent the mean of three experiments ± SEM. *P < 0.01 vs. no 4-TMPs. b Fluo-3-loaded DCs (5 × 10⁶) were pretreated for 30 min with the indicated blocking antibodies (anti-CD2, -CD40, and -LFA-1), and then stimulated with 4-TMPs (5 × 10⁷). Calcium signals were expressed as arbitrary units (a.u.) of Fluo-3 fluorescence from the average of at least three separate experiments. Data represent the mean of three experiments ± SEM. *P < 0.01 vs. PBS-treated group. c Representative images of cytokine arrays (left) and the heatmap showing cytokine-expression levels in total CD4+ T cell lysate and 4-TMPs (right). Each sample (200 µg) was hybridized to membranes containing capture antibodies specific for 112 cytokines. Data were quantified by densitometric analysis and statistically analysed. Cytokines overexpressed by up to 1.5-fold in TMPs relative to their expression in lysate are highlighted by red and blue boxes. Some cytokines were further confirmed by ELISA. Data represent the mean of three experiments ± SEM. *P < 0.01 vs. CD4+ T cell lysate
Similar articles
- T Cell Microvilli: Sensors or Senders?
Kim HR, Jun CD. Kim HR, et al. Front Immunol. 2019 Jul 30;10:1753. doi: 10.3389/fimmu.2019.01753. eCollection 2019. Front Immunol. 2019. PMID: 31417549 Free PMC article. Review. - T Cell Immunological Synaptosomes: Definition and Isolation.
Kim HR, Park JS, Kim NY, Jun CD. Kim HR, et al. Methods Mol Biol. 2023;2654:201-215. doi: 10.1007/978-1-0716-3135-5_13. Methods Mol Biol. 2023. PMID: 37106184 - T Cell Microvilli: Finger-Shaped External Structures Linked to the Fate of T Cells.
Kim HR, Park JS, Soh WC, Kim NY, Moon HY, Lee JS, Jun CD. Kim HR, et al. Immune Netw. 2023 Feb 21;23(1):e3. doi: 10.4110/in.2023.23.e3. eCollection 2023 Feb. Immune Netw. 2023. PMID: 36911802 Free PMC article. Review. - Transfer of T cell surface molecules to dendritic cells upon CD4+ T cell priming involves two distinct mechanisms.
Busch A, Quast T, Keller S, Kolanus W, Knolle P, Altevogt P, Limmer A. Busch A, et al. J Immunol. 2008 Sep 15;181(6):3965-73. doi: 10.4049/jimmunol.181.6.3965. J Immunol. 2008. PMID: 18768851
Cited by
- Cell surface morphology mimicking nano-bio platform for immune cell stimulation.
Varghese B, González-Navarro JA, Guerra VLP, Faizulina M, Artemieva D, Chum T, Ramakrishna TRB, Cebecauer M, Kovaříček P. Varghese B, et al. iScience. 2024 Sep 26;27(11):111033. doi: 10.1016/j.isci.2024.111033. eCollection 2024 Nov 15. iScience. 2024. PMID: 39498306 Free PMC article. - The role of intercellular communication in diabetic nephropathy.
Wang B, Xiong Y, Deng X, Wang Y, Gong S, Yang S, Yang B, Yang Y, Leng Y, Li W, Li W. Wang B, et al. Front Immunol. 2024 Aug 22;15:1423784. doi: 10.3389/fimmu.2024.1423784. eCollection 2024. Front Immunol. 2024. PMID: 39238645 Free PMC article. Review. - Clathrin mediates both internalization and vesicular release of triggered T cell receptor at the immunological synapse.
Kvalvaag A, Valvo S, Céspedes PF, Saliba DG, Kurz E, Korobchevskaya K, Dustin ML. Kvalvaag A, et al. Proc Natl Acad Sci U S A. 2023 Feb 7;120(6):e2211368120. doi: 10.1073/pnas.2211368120. Epub 2023 Feb 2. Proc Natl Acad Sci U S A. 2023. PMID: 36730202 Free PMC article. - T Cell Reprogramming Against Cancer.
Katz SG, Rabinovich PM. Katz SG, et al. Methods Mol Biol. 2020;2097:3-44. doi: 10.1007/978-1-0716-0203-4_1. Methods Mol Biol. 2020. PMID: 31776916 Free PMC article. Review. - T Cell Microvilli: Sensors or Senders?
Kim HR, Jun CD. Kim HR, et al. Front Immunol. 2019 Jul 30;10:1753. doi: 10.3389/fimmu.2019.01753. eCollection 2019. Front Immunol. 2019. PMID: 31417549 Free PMC article. Review.
References
Publication types
MeSH terms
Substances
LinkOut - more resources
Full Text Sources
Other Literature Sources
Molecular Biology Databases
Research Materials
Miscellaneous
