Loss of Neurofascin-186 Disrupts Alignment of AnkyrinG Relative to Its Binding Partners in the Axon Initial Segment - PubMed (original) (raw)
Loss of Neurofascin-186 Disrupts Alignment of AnkyrinG Relative to Its Binding Partners in the Axon Initial Segment
Scott A Alpizar et al. Front Cell Neurosci. 2019.
Abstract
The axon initial segment (AIS) is a specialized region within the proximal portion of the axon that initiates action potentials thanks in large part to an enrichment of sodium channels. The scaffolding protein ankyrinG (AnkG) is essential for the recruitment of sodium channels as well as several other intracellular and extracellular proteins to the AIS. In the present study, we explore the role of the cell adhesion molecule (CAM) neurofascin-186 (NF-186) in arranging the individual molecular components of the AIS in cultured rat hippocampal neurons. Using a CRISPR depletion strategy to ablate NF expression, we found that the loss of NF selectively perturbed AnkG accumulation and its relative proximal distribution within the AIS. We found that the overexpression of sodium channels could restore AnkG accumulation, but not its altered distribution within the AIS without NF present. We go on to show that although the loss of NF altered AnkG distribution, sodium channel function within the AIS remained normal. Taken together, these results demonstrate that the regulation of AnkG and sodium channel accumulation within the AIS can occur independently of one another, potentially mediated by other binding partners such as NF.
Keywords: ankyrin G; axon initial segment; cultured hippocampal neurons; neurofascin-186; voltage gated sodium channels.
Figures
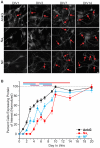
Figure 1
Development of the axon initial segment (AIS). (A) Representative images of immunostaining for ankyrinG (AnkG), panNav, and neurofascin (NF) at days in vitro (DIV)1, 3, 7, and 14. Red arrows indicate AIS enrichment. Scale bar: 10 μm. (B) Percentages of neurons containing discernable enrichment at the AIS compared to the soma for AnkG (black), Nav (red), and NF (cyan) during development (≥10 images/fields of view were quantified for all proteins in all DIV). Error bars indicate mean ± standard error of the mean (SEM). Cyan line at top indicates statistical significance between NF and AnkG, red line indicates statistical significance between Nav and AnkG, and purple line indicates that Nav is statistically significant from NF. All significance indicates p < 0.05, ANOVA with Tukey’s post hoc comparisons.
Figure 2
AnkG enriches proximally relative to its binding partners at the AIS. (A) Representative AIS intensity plot for AnkG staining along the proximal axon (see inset) indicating parameters obtained (distance from the soma and length). Gray line indicates the standard 0.33 normalized intensity threshold to define the AIS. Yellow dashed line indicates the junction of the soma and axon where intensity profiling began; red dashed lines indicate start and end parameters of the AIS found as described in the “Materials and Methods” section. Scale bar: 10 μm. (B) Representative images of immunostaining for AnkG with panNav. AnkG and Nav are pseudo-colored green and magenta in overlay for contrast. Scale bar: 10 μm. (C) Smoothed and normalized fluorescence intensity traces for AnkG (black) and Nav (red) from the images in (B). Gray line indicates fluorescence intensity threshold to define the AIS. Arrows indicate start of AnkG (black) or Nav (red) enrichment above threshold. (D) Representative images of immunostaining for AnkG with NF. AnkG and NF are pseudo-colored green and magenta in overlay for contrast. Scale bar: 10 μm. (E) Smoothed and normalized fluorescence intensity traces for AnkG (black) and NF (cyan) from (D). Gray line indicates intensity threshold to define the AIS. Arrows indicate start of AnkG (black) or NF (cyan) enrichment above threshold. (F) To-scale distribution of AnkG (black; n = 40) and Nav (red; n = 40; top), or AnkG (black; n = 40) and NF (cyan; n = 40; bottom) enrichment in untransfected DIV14 neurons. Left error bar indicates SEM for distance from the soma, right error bar indicates SEM for length. Asterisks indicate significance from AnkG start; **p = 0.0035 for Nav and ***p < 0.001 for NF, Wilcoxon signed-rank test. (G) Comparison of start of protein enrichment for Nav (red) or NF (cyan) relative to AnkG start (black horizontal line) in the same cells. Error bars indicate mean ± SEM, n = 40 for both proteins.
Figure 3
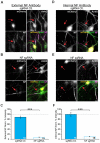
NF single guide RNA (sgRNA) successfully depletes NF enrichment in the AIS. (A,B) Representative images of DIV14 sgRNA control (A) or NF sgRNA (B) neurons stained for mCherry, AnkG, and NF using an antibody targeting an extracellular domain of NF. Red arrows indicate the AIS of transfected neurons. Scale bar: 10 μm. (C) Ratio of mean fluorescence intensity of NF at the AIS using an externally targeting antibody in sgRNA control or NF sgRNA expressing neurons, normalized to untransfected neurons in the same image (n = 15 for both conditions; ***p < 0.001, Student’s _t_-test). (D,E) Representative images of DIV14 sgRNA control (D) or NF sgRNA (E) neurons stained for mCherry, AnkG, and NF using an antibody targeting an intracellular domain of NF. Red arrows indicate the AIS of transfected neurons. Scale bar: 10 μm. (F) Ratio of mean fluorescence intensity for external NF at the AIS using an internally targeting antibody in sgRNA control or NF sgRNA expressing neurons, normalized to untransfected neurons in the same image (n = 15 for both conditions; ***p < 0.001, Student’s _t_-test). Error bars indicate mean ± SEM.
Figure 4
Knockout of NF disrupts AnkG enrichment and relative localization to Nav. (A,E) Representative images for sgRNA control or NF sgRNA stained for mCherry with AnkG (A) or panNav (E). Red arrows indicate the AIS of transfected neurons; yellow arrows indicate start of enrichment; yellow dashed lines indicate junction of soma and axon. Scale bars: 10 μm. (B,F) Ratio of mean fluorescence intensity for AnkG (B) and Nav (F) at the AIS in sgRNA control or NF sgRNA neurons normalized to adjacent untransfected neurons in the same image (B: sgRNA Ctl. n = 55; NF sgRNA n = 63; ***p < 0.001, Student’s _t_-test. F: sgRNA Ctl. n = 51; NF sgRNA n = 61). (C,G) Distance from the soma to start of AIS enrichment for AnkG (C) and Nav (G) in untransfected, sgRNA control, and NF sgRNA neurons (C: Untransfected n = 31; sgRNA Ctl. n = 52; NF sgRNA n = 44; *p = 0.024, Kruskal-Wallis ANOVA followed by Dunn’s post-test with Bonferroni correction. G: Untransfected n = 29; sgRNA Ctl. n = 62; NF sgRNA n = 43). (D,H) AIS length for AnkG (D) and Nav (H) in untransfected, sgRNA control and NF sgRNA neurons (D: Untransfected n = 31; sgRNA Ctl. n = 52; NF sgRNA n = 44. H: Untransfected n = 29; sgRNA Ctl. n = 62; NF sgRNA n = 43). Error bars indicate mean ± SEM. (I) To-scale distribution of AnkG (black) and Nav (red) in sgRNA control (left) and NF sgRNA (right) neurons. Color saturation of bars are indicative of average labeling intensity of the population. Dashed black line indicates start of AnkG enrichment in sgRNA control. Left error bar indicates SEM for distance from the soma, right error bar indicates SEM for length; data taken from (B–D) and (F–H).
Figure 5
Nav1.6 overexpression rescues AnkG enrichment, but not translocation. (A,D) Representative images for NF sgRNA + Nav1.6-GFP co-transfected neurons stained for mCherry, GFP, and AnkG (A) or panNav (D). Red arrows indicate the AIS of transfected neurons. Scale bars: 10 μm. (B,E) Ratio of mean fluorescence intensity for AnkG (B) and Nav (E) at the AIS in NF sgRNA (originally from Figure 3) or NF sgRNA + Nav1.6-GFP expressing neurons normalized to untransfected neurons in the same image (B: NF sgRNA n = 63; NF sgRNA + Nav1.6-GFP n = 18; ***p < 0.001, Student’s _t_-test. E: NF sgRNA n = 61; NF sgRNA + Nav1.6-GFP n = 28; **p = 0.0099, Student’s _t_-test). (C,F) Distance from the soma to start of AIS for AnkG (C) and Nav (F) in NF sgRNA (data originally from Figure 4) or NF sgRNA + Nav1.6-GFP neurons (C: NF sgRNA n = 44; NF sgRNA + Nav1.6-GFP n = 44; asterisks indicate statistical significance from sgRNA Ctl.; NF sgRNA *p = 0.012, NF sgRNA + Nav1.6-GFP **p = 0.0073, Kruskal-Wallis ANOVA followed by Dunn’s post-test with Bonferroni correction. F: NF sgRNA n = 43; NF sgRNA + Nav1.6-GFP n = 26). sgRNA Ctl. is displayed as a dashed line for comparison. Error bars indicate mean ± SEM. (G) To-scale distribution of AnkG (black) and Nav (red) in NF sgRNA (left) and NF sgRNA + Nav1.6-GFP (right) neurons. Color saturation of bars are indicative of average labeling intensity of the population. Dashed black line indicates start of AnkG enrichment in sgRNA control (data originally from Figure 4). Left error bar indicates SEM for distance from the soma, right error bar indicates SEM for length; data taken from (B,C) and (E,F).
Figure 6
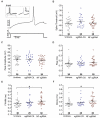
Knockout of NF broadens action potentials. (A) Example of a single trace of the voltage change (top) in response to a current step (bottom). Inset shows voltage response to current step for 20 subsequent trials (left), which were then peak aligned (right) and averaged for analysis. (B) Measurements of spike threshold (Untransfected n = 36; sgRNA Ctl. n = 25; NF sgRNA n = 30). (C–F) Measurements of waveform parameters including peak amplitude (C: Untransfected n = 36; sgRNA Ctl. n = 25; NF sgRNA n = 30), rise time (D: Untransfected n = 36; sgRNA Ctl. n = 25; NF sgRNA n = 30), full-width at half maximum amplitude (FWHM; E: Untransfected n = 36; sgRNA Ctl. n = 25; NF sgRNA n = 30; *p < 0.05, ANOVA with Tukey’s post hoc comparisons), and decay time (F: Untransfected n = 36; sgRNA Ctl. n = 25; NF sgRNA n = 30; *p < 0.05, ANOVA with Tukey’s post hoc comparisons). Error bars indicate mean ± SEM.
Figure 7
Knockout of NF does not influence neuronal cell adhesion molecule (NrCAM) enrichment or relative localization. (A) Representative images of sgRNA control or NF sgRNA stained for mCherry with NrCAM. Red arrows indicate the AIS of transfected neurons; yellow arrows indicate start of AnkG enrichment; yellow dashed lines indicate junction of soma and axon. Scale bar: 10 μm. (B,F) Ratio of mean fluorescence intensity of NrCAM (B) and AnkG (F) at the AIS in the same sgRNA control or NF sgRNA neurons, normalized to untransfected neurons in the same image (B: n = 15 in both conditions. F: n = 15 for both conditions; *p = 0.034, Student’s _t_-test). (C,G) Distance from the soma to start of AIS for NrCAM (C) and AnkG (G) in the same untransfected, sgRNA control, and NF sgRNA neurons (C: n = 30 for all conditions. G: n = 30 for all conditions; *p = 0.05, Kruskal-Wallis ANOVA followed by Dunn’s post-test with Bonferroni correction). (D,H) AIS length for NrCAM (D) and AnkG (H) in the same untransfected, sgRNA control, and NF sgRNA neurons (D: n = 30 in all conditions. H: n = 30 in all conditions). (E) Ratio of mean fluorescence intensity of NF at the AIS in paired sgRNA control or NF sgRNA expressing neurons from the same culture as NrCAM data was taken, normalized to untransfected neurons in the same image (n = 10 in both conditions; ***p < 0.001, Student’s _t_-test). Error bars indicate mean ± SEM. (I) To-scale distribution of AnkG (black) and NrCAM (orange) in sgRNA control (left) and NF sgRNA (right) neurons. Color saturation of bars are indicative of average labeling intensity of the population. Dashed black line indicates start of AnkG enrichment in sgRNA control. Left error bar indicates SEM for distance from the soma, right error bar indicates SEM for length; data taken from (B–D) and (F–H).
Similar articles
- Ankyrin G Membrane Partners Drive the Establishment and Maintenance of the Axon Initial Segment.
Leterrier C, Clerc N, Rueda-Boroni F, Montersino A, Dargent B, Castets F. Leterrier C, et al. Front Cell Neurosci. 2017 Jan 26;11:6. doi: 10.3389/fncel.2017.00006. eCollection 2017. Front Cell Neurosci. 2017. PMID: 28184187 Free PMC article. - Crystal structure of Ankyrin-G in complex with a fragment of Neurofascin reveals binding mechanisms required for integrity of the axon initial segment.
He L, Jiang W, Li J, Wang C. He L, et al. J Biol Chem. 2022 Sep;298(9):102272. doi: 10.1016/j.jbc.2022.102272. Epub 2022 Jul 16. J Biol Chem. 2022. PMID: 35850303 Free PMC article. - CK2-regulated schwannomin-interacting protein IQCJ-SCHIP-1 association with AnkG contributes to the maintenance of the axon initial segment.
Papandréou MJ, Vacher H, Fache MP, Klingler E, Rueda-Boroni F, Ferracci G, Debarnot C, Pipéroglou C, Garcia Del Caño G, Goutebroze L, Dargent B. Papandréou MJ, et al. J Neurochem. 2015 Aug;134(3):527-37. doi: 10.1111/jnc.13158. Epub 2015 Jun 22. J Neurochem. 2015. PMID: 25950943 - Physiological roles of axonal ankyrins in survival of premyelinated axons and localization of voltage-gated sodium channels.
Bennett V, Lambert S. Bennett V, et al. J Neurocytol. 1999 Apr-May;28(4-5):303-18. doi: 10.1023/a:1007005528505. J Neurocytol. 1999. PMID: 10739573 Review. - Neurofascin: a switch between neuronal plasticity and stability.
Kriebel M, Wuchter J, Trinks S, Volkmer H. Kriebel M, et al. Int J Biochem Cell Biol. 2012 May;44(5):694-7. doi: 10.1016/j.biocel.2012.01.012. Epub 2012 Jan 24. Int J Biochem Cell Biol. 2012. PMID: 22306302 Review.
Cited by
- Ataxia in Patients With Bi-Allelic NFASC Mutations and Absence of Full-Length NF186.
Kvarnung M, Shahsavani M, Taylan F, Moslem M, Breeuwsma N, Laan L, Schuster J, Jin Z, Nilsson D, Lieden A, Anderlid BM, Nordenskjöld M, Syk Lundberg E, Birnir B, Dahl N, Nordgren A, Lindstrand A, Falk A. Kvarnung M, et al. Front Genet. 2019 Sep 24;10:896. doi: 10.3389/fgene.2019.00896. eCollection 2019. Front Genet. 2019. PMID: 31608123 Free PMC article. - Overview of myelin, major myelin lipids, and myelin-associated proteins.
Kister A, Kister I. Kister A, et al. Front Chem. 2023 Feb 21;10:1041961. doi: 10.3389/fchem.2022.1041961. eCollection 2022. Front Chem. 2023. PMID: 36896314 Free PMC article. Review. - The potassium channel subunit Kvβ1 serves as a major control point for synaptic facilitation.
Cho IH, Panzera LC, Chin M, Alpizar SA, Olveda GE, Hill RA, Hoppa MB. Cho IH, et al. Proc Natl Acad Sci U S A. 2020 Nov 24;117(47):29937-29947. doi: 10.1073/pnas.2000790117. Epub 2020 Nov 9. Proc Natl Acad Sci U S A. 2020. PMID: 33168717 Free PMC article. - Anti-pan-neurofascin antibodies induce subclass-related complement activation and nodo-paranodal damage.
Appeltshauser L, Junghof H, Messinger J, Linke J, Haarmann A, Ayzenberg I, Baka P, Dorst J, Fisse AL, Grüter T, Hauschildt V, Jörk A, Leypoldt F, Mäurer M, Meinl E, Michels S, Motte J, Pitarokoili K, Stettner M, Villmann C, Weihrauch M, Welte GS, Zerr I, Heinze KG, Sommer C, Doppler K. Appeltshauser L, et al. Brain. 2023 May 2;146(5):1932-1949. doi: 10.1093/brain/awac418. Brain. 2023. PMID: 36346134 Free PMC article. - Inhibition of AKT Signaling Alters βIV Spectrin Distribution at the AIS and Increases Neuronal Excitability.
Di Re J, Hsu WJ, Kayasandik CB, Fularczyk N, James TF, Nenov MN, Negi P, Marosi M, Scala F, Prasad S, Labate D, Laezza F. Di Re J, et al. Front Mol Neurosci. 2021 Jun 30;14:643860. doi: 10.3389/fnmol.2021.643860. eCollection 2021. Front Mol Neurosci. 2021. PMID: 34276302 Free PMC article.
References
- Benned-Jensen T., Christensen R. K., Denti F., Perrier J. F., Rasmussen H. B., Olesen S. P. (2016). Live imaging of Kv7.2/7.3 cell surface dynamics at the axon initial segment: high steady-state stability and calpain-dependent excitotoxic downregulation revealed. J. Neurosci. 36, 2261–2266. 10.1523/jneurosci.2631-15.2016 - DOI - PMC - PubMed
LinkOut - more resources
Full Text Sources
Research Materials


