The ESCRT-Related ATPase Vps4 Is Modulated by Interferon during Herpes Simplex Virus 1 Infection - PubMed (original) (raw)
The ESCRT-Related ATPase Vps4 Is Modulated by Interferon during Herpes Simplex Virus 1 Infection
Jorge Ruben Cabrera et al. mBio. 2019.
Abstract
Interferons (IFNs) and autophagy are critical neuronal defenses against viral infection. IFNs alter neuronal autophagy by promoting the accumulation of IFN-dependent LC3-decorated autophagic structures, termed LC3 clusters. Here, we analyzed LC3 clusters in sensory ganglia following herpes simplex virus 1 (HSV-1) infection. In the vicinity of acutely infected neurons, antigen-negative neurons contained structures resembling accumulated autophagosomes and autolysosomes that culminated in LC3 clusters. This accumulation reflects a delayed completion of autophagy. The endosomal sorting complexes required for transport (ESCRT) machinery participates in autophagosome closure and is also required for HSV-1 replication. In this study, our results showed that HSV-1 infection in vivo and in primary neurons caused a decrease in Vps4 (a key ESCRT pathway ATPase) RNA and protein with concomitant Stat1 activation and LC3 cluster induction. We also observed that IFNs were sufficient to decrease RNA and protein levels of Vps4 in primary neurons and in other cell types. The accumulation of ubiquitin was also observed at the LC3 cluster sites. Together, our results show that IFNs modulate the ESCRT machinery in neurons in response to HSV-1 infections.IMPORTANCE Neurons rely on IFNs and autophagy as major defenses against viral infections, and HSV must overcome such defenses in order to replicate. In addition to controlling host immunity, HSV must also control host membranes in order to complete its life cycle. HSV uses the host ESCRT membrane scission machinery for viral production and transport. Here we present evidence of a new IFN-dependent mechanism used by the host to prevent ESCRT subversion by HSV. This activity also impacts the dynamics of autophagy, possibly explaining the presence of recently described LC3 clusters in the HSV-infected nervous system. The induced accumulations of ubiquitin observed in these LC3 clusters resembled those observed in certain neurodegenerative diseases, suggesting possible mechanistic parallels between these conditions.
Keywords: ESCRT; autophagy; herpes simplex virus; interferons; neuroimmunology.
Copyright © 2019 Cabrera et al.
Figures
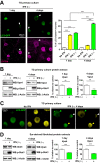
FIG 1
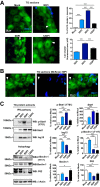
Time course of IFN signaling, autophagy, and presence of LC3 clusters in the TG after HSV-1 corneal infection. (A) (Left) Representative images of immunofluorescent microscopy using TG cryosections from corneally infected LC3-GFP+/− mice (1 × 10e6 PFU/eye, HSV-1 strain 17) during the indicated times. LC3-GFP is in green, and detection of polyclonal antibody raised against HSV-1 is in blue. White arrowheads indicate representative LC3 clusters. (Upper right) Quantification of presence of LC3-GFP clusters in the ophthalmic branch of the TG. n = 6 TG from 6 mice, performed in two independent experiments. ***, P < 0.001. (Lower right) Quantification of size of LC3-GFP clusters in the ophthalmic branch of the TG. _n_ > 100, performed in two independent experiments. ***, P < 0.001. (B) Representative image of immunofluorescent microscopy using TG cryosections from corneally infected LC3-GFP+/− mice (1 × 10e6 PFU/eye, HSV-1 McKrae) 3 dpi. LC3-GFP is shown in green, and HSV-1 is in blue. White arrowheads indicate a representative LC3 cluster in an antigen-negative neuron. Blue arrowheads indicate an LC3 cluster in an antigen-positive neuron. (C) (Left) p-Stat1 (Y701), Stat1, Isg15, p-Beclin-1 (T117), Beclin-1, and P62 were analyzed by WB using TG protein extracts from infected LC3-GFP+/− mice (1 × 10e6 PFU/eye, HSV-1 strain 17) during the time indicated. (Right) Quantification of WBs normalized to β-actin. Each protein analyzed was normalized to its own β-actin WB. n = 6 TG from 6 different mice, performed in two independent experiments. *, P < 0.05; **, P < 0.01; ***, P < 0.001.
FIG 2
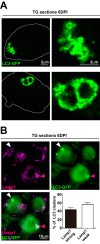
LC3 clusters in the TG after HSV-1 corneal infection are aggregations of autophagosomes and oversized autolysosomes. (A) Representative images of cluster morphologies taken with an Airyscan (Zeiss) confocal microscope showing immunofluorescent images of TG cryosections from infected LC3-GFP+/− mice (1 × 10e6 PFU/eye, HSV-1 strain 17) at 6 dpi. LC3-GFP is in green. (B) Representative immunofluorescence images of TG cryosections from infected LC3-GFP+/− mice (1 × 10e6 PFU/eye, HSV-1 strain 17) at 6 dpi. LC3-GFP is in green, and Lamp1 is shown in magenta. White arrowhead indicates representative Lamp1-weak LC3 cluster. Magenta arrowhead indicates representative Lamp1-strong LC3 cluster. Quantification of costained LC3-GFP clusters and Lamp1 in the ophthalmic branch; n = 11, performed in two independent experiments.
FIG 3
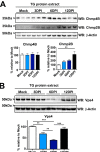
The ATPase Vps4 is reduced in the TG after HSV-1 corneal infection. (A) ESCRT-III proteins Chmp4B and Chmp2B were analyzed by WB using TG protein extracts from corneally infected LC3-GFP+/− (1 × 10e6 PFU/eye, HSV-1 strain 17) mice and analyzed at the indicated times. Each line corresponds to a single TG. Graph shows quantification of WBs normalized to β-actin; n = 6 TG from 6 mice, performed in two independent experiments. **, P < 0.01. (B) Vps4 was analyzed by WB using TG protein extracts from infected LC3-GFP+/− mice (1 × 10e6 PFU/eye, HSV-1 strain 17) at the indicated times. Each line corresponds to a single TG. Graph shows quantification of WBs normalized to β-actin; n = 9 TG from 9 different mice, performed in three independent experiments. **, P < 0.01; ***, P < 0.001. Vps4 antibody recognizes both Vps4A and Vps4B.
FIG 4
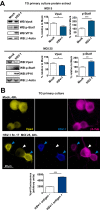
Vps4 is decreased in HSV-1 antigen-negative TG neurons. (A) Top, MOI of 5. (Left panel) WB of Vps4, p-Stat1, and VP16 from primary TG cultures of LC3-GFP+/− mouse neurons which were mock infected or infected with HSV-1 strain 17 for 48 h. (Right panels) Quantification of WBs normalized to β-actin; n = 6, performed in two independent experiments. *, P < 0.05; ***, _P_ < 0.001. Bottom, MOI of 25. (Left panel) WB of Vps4, p-Stat1, and VP16 from primary TG cultures of LC3-GFP+/− mouse neurons which were mock infected or infected with HSV-1 strain 17 for 48 h. (Right panels) Quantification of WBs normalized to β-actin; _n_ = 6, performed in two independent experiments. *, _P_ < 0.05; **, _P_ < 0.01. (B) Representative images of immunofluorescent microscopy of TG LC3-GFP+/− mouse neurons. Mock-infected neurons are shown in upper panels. Neurons infected with HSV-1 strain 17 at an MOI of 25 for 48 h are shown in lower panels. Vps4 is in yellow, a polyclonal antibody raised against HSV-1 is shown in blue, and β3-tubulin is in magenta. The white arrowhead points to an HSV-1 antigen-negative neuron. Blue arrowheads point to HSV-1 antigen-positive neurons. Graph shows Vps4 fluorescence intensity in infected cultures for HSV antigen-negative (-) or -positive (+) neurons (β3-tubulin stained); _n_ > 500 neurons were counted for each condition. The experiment shown is representative of two independent experiments; ***, P < 0.001.
FIG 5
IFNs decrease Vps4 protein levels in TG mouse neurons and in other cell types. (A) (Left) Representative images from immunofluorescent microscopy of TG neurons from LC3-GFP+/− mice in cultures not treated or treated with IFN β+γ at the indicated times. LC3-GFP is shown in green, and β3-tubulin is in magenta. White arrowheads point to representative LC3 clusters. (Right) Quantification of presence of LC3-GFP clusters in cultures treated with IFN-β or IFN β+γ; n = 8 (>1,000 neurons were counted for each condition). The experiment shown is representative of two independent experiments. ***, P < 0.001. (B) (Left panels) Vps4 and p-Stat1 were analyzed by WB using TG neurons of LC3-GFP+/− mice treated with IFN β+γ at the times indicated. (Right panels) Quantification of WBs normalized to β-actin; n = 6, performed in two independent experiments. **, P < 0.01. (C) Representative images of immunofluorescent microscopy of TG LC3-GFP+/− mouse neurons. Nontreated neurons are shown in left panels. Neurons treated for 4 days with IFN β+γ are shown in right panels. Vps4 is in yellow, and LC3-GFP is shown in green. The yellow arrowhead points to an LC3 cluster-negative Vps4-strong neuron. The white arrowhead points to an LC3 cluster-negative Vps4-weak neuron. The green arrowhead points to an LC3 cluster-positive Vps4-weak neuron. (D) (Left panels) Vps4 and p-Stat1 were analyzed by WB using ear-derived fibroblasts of LC3-GFP+/− mice treated with IFN β+γ at the times indicated. (Right panels) Quantification of WBs normalized to β-actin; n = 6, performed in two independent experiments. ***, P < 0.01.
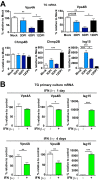
FIG 6
IFNs decrease Vps4A and Vps4B mRNA levels in TG mouse neurons. (A) mRNA levels of Vps4A, Vps4B, Chmp4B, Chmp2B, and Isg15 were analyzed by qPCR using TG mRNA from infected LC3-GFP+/− mice during the indicated times. Quantification of Sybr Green signal was normalized to β-actin; n = 5 for all genes analyzed and all time points, except for Chmp2B Mock (n = 3). All samples were performed with two technical replicates. *, P < 0.05; **, P < 0.01; ***, P < 0.001. (B) mRNA levels of Vps4A, Vps4B, and Isg15 were analyzed by qPCR using TG primary neurons from LC3-GFP+/− mice treated with IFN β+γ during indicated times. Quantification of Sybr Green signal was normalized to β-actin; n = 6 for all genes analyzed and all time points. All samples were performed with two technical replicates. *, P < 0.05; **, P < 0.01; ***, P < 0.001.
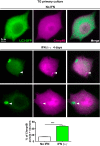
FIG 7
IFNs induce Chmp4B puncta in TG neurons. Representative images from immunofluorescence microscopy of TG neurons from LC3-GFP+/− mice in culture not treated or treated with IFN β+γ for 4 days. LC3-GFP is shown in green and Chmp4B in magenta. White arrowheads point to Chmp4B puncta. Graph shows quantification of neurons containing Chmp4B-positive puncta in the cultures; n = 8 (>400 neurons were counted for each condition). The experiment shown is representative of two independent experiments. ***, P < 0.001.
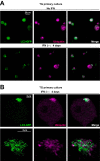
FIG 8
LC3 clusters are associated with ubiquitin accumulations. (A) Representative images from immunofluorescence microscopy of cultured TG neurons from LC3-GFP+/− mice that were either untreated (upper row) or treated (lower row) with IFN β+γ for 4 days. LC3-GFP is in green; ubiquitin is shown in magenta. The experiment shown is representative of three independent experiments; >1,000 neurons were analyzed. (B) Representative stack from high-resolution (Airyscan, Zeiss) confocal microscopy of TG neurons from LC3-GFP+/− mice in culture treated with IFN β+γ for 4 days (upper row). Lower row shows the magnification and deconvolution of the above LC3 cluster and ubiquitin accumulation. LC3-GFP is in green; ubiquitin is shown in magenta.
Similar articles
- Herpes Simplex Virus Capsid Localization to ESCRT-VPS4 Complexes in the Presence and Absence of the Large Tegument Protein UL36p.
Kharkwal H, Smith CG, Wilson DW. Kharkwal H, et al. J Virol. 2016 Jul 27;90(16):7257-7267. doi: 10.1128/JVI.00857-16. Print 2016 Aug 15. J Virol. 2016. PMID: 27252536 Free PMC article. - Herpes Simplex Virus and Interferon Signaling Induce Novel Autophagic Clusters in Sensory Neurons.
Katzenell S, Leib DA. Katzenell S, et al. J Virol. 2016 Apr 14;90(9):4706-4719. doi: 10.1128/JVI.02908-15. Print 2016 May. J Virol. 2016. PMID: 26912623 Free PMC article. - An autophagy assay reveals the ESCRT-III component CHMP2A as a regulator of phagophore closure.
Takahashi Y, He H, Tang Z, Hattori T, Liu Y, Young MM, Serfass JM, Chen L, Gebru M, Chen C, Wills CA, Atkinson JM, Chen H, Abraham T, Wang HG. Takahashi Y, et al. Nat Commun. 2018 Jul 20;9(1):2855. doi: 10.1038/s41467-018-05254-w. Nat Commun. 2018. PMID: 30030437 Free PMC article. - Structure and mechanism of the ESCRT pathway AAA+ ATPase Vps4.
Han H, Hill CP. Han H, et al. Biochem Soc Trans. 2019 Feb 28;47(1):37-45. doi: 10.1042/BST20180260. Epub 2019 Jan 15. Biochem Soc Trans. 2019. PMID: 30647138 Free PMC article. Review. - The regulation of Endosomal Sorting Complex Required for Transport and accessory proteins in multivesicular body sorting and enveloped viral budding - An overview.
Ahmed I, Akram Z, Iqbal HMN, Munn AL. Ahmed I, et al. Int J Biol Macromol. 2019 Apr 15;127:1-11. doi: 10.1016/j.ijbiomac.2019.01.015. Epub 2019 Jan 4. Int J Biol Macromol. 2019. PMID: 30615963 Review.
Cited by
- Seeking Closure: How Do Herpesviruses Recruit the Cellular ESCRT Apparatus?
Barnes J, Wilson DW. Barnes J, et al. J Virol. 2019 Jun 14;93(13):e00392-19. doi: 10.1128/JVI.00392-19. Print 2019 Jul 1. J Virol. 2019. PMID: 30996099 Free PMC article. Review. - The Role of Exosome and the ESCRT Pathway on Enveloped Virus Infection.
Ju Y, Bai H, Ren L, Zhang L. Ju Y, et al. Int J Mol Sci. 2021 Aug 22;22(16):9060. doi: 10.3390/ijms22169060. Int J Mol Sci. 2021. PMID: 34445766 Free PMC article. Review. - Synthetic Lethal Interaction between the ESCRT Paralog Enzymes VPS4A and VPS4B in Cancers Harboring Loss of Chromosome 18q or 16q.
Neggers JE, Paolella BR, Asfaw A, Rothberg MV, Skipper TA, Yang A, Kalekar RL, Krill-Burger JM, Dharia NV, Kugener G, Kalfon J, Yuan C, Dumont N, Gonzalez A, Abdusamad M, Li YY, Spurr LF, Wu WW, Durbin AD, Wolpin BM, Piccioni F, Root DE, Boehm JS, Cherniack AD, Tsherniak A, Hong AL, Hahn WC, Stegmaier K, Golub TR, Vazquez F, Aguirre AJ. Neggers JE, et al. Cell Rep. 2020 Dec 15;33(11):108493. doi: 10.1016/j.celrep.2020.108493. Cell Rep. 2020. PMID: 33326793 Free PMC article. - Herpes Simplex Virus 1 Infection of Neuronal and Non-Neuronal Cells Elicits Specific Innate Immune Responses and Immune Evasion Mechanisms.
Verzosa AL, McGeever LA, Bhark SJ, Delgado T, Salazar N, Sanchez EL. Verzosa AL, et al. Front Immunol. 2021 May 31;12:644664. doi: 10.3389/fimmu.2021.644664. eCollection 2021. Front Immunol. 2021. PMID: 34135889 Free PMC article. Review. - The interferon-inducible GTPase MxB promotes capsid disassembly and genome release of herpesviruses.
Serrero MC, Girault V, Weigang S, Greco TM, Ramos-Nascimento A, Anderson F, Piras A, Hickford Martinez A, Hertzog J, Binz A, Pohlmann A, Prank U, Rehwinkel J, Bauerfeind R, Cristea IM, Pichlmair A, Kochs G, Sodeik B. Serrero MC, et al. Elife. 2022 Apr 27;11:e76804. doi: 10.7554/eLife.76804. Elife. 2022. PMID: 35475759 Free PMC article.
References
- Knipe DM, Howley PM, Cohen JI, Griffin DE, Lamb RA, Martin MA, Racaniello VR, Roizman B (ed). 2013. Fields virology, 6th ed. Lippincott Williams & Wilkins, Philadelphia, PA.
Publication types
MeSH terms
Substances
Grants and funding
- P01 AI098681/AI/NIAID NIH HHS/United States
- P20 GM113132/GM/NIGMS NIH HHS/United States
- R01 EY009083/EY/NEI NIH HHS/United States
- T32 AI007363/AI/NIAID NIH HHS/United States
LinkOut - more resources
Full Text Sources
Medical
Molecular Biology Databases
Research Materials
Miscellaneous
