Non-canonical cMet regulation by vimentin mediates Plk1 inhibitor-induced apoptosis - PubMed (original) (raw)
Non-canonical cMet regulation by vimentin mediates Plk1 inhibitor-induced apoptosis
Ratnakar Singh et al. EMBO Mol Med. 2019 May.
Abstract
To address the need for improved systemic therapy for non-small-cell lung cancer (NSCLC), we previously demonstrated that mesenchymal NSCLC was sensitive to polo-like kinase (Plk1) inhibitors, but the mechanisms of resistance in epithelial NSCLC remain unknown. Here, we show that cMet was differentially regulated in isogenic pairs of epithelial and mesenchymal cell lines. Plk1 inhibition inhibits cMet phosphorylation only in mesenchymal cells. Constitutively active cMet abrogates Plk1 inhibitor-induced apoptosis. Likewise, cMet silencing or inhibition enhances Plk1 inhibitor-induced apoptosis. Cells with acquired resistance to Plk1 inhibitors are more epithelial than their parental cells and maintain cMet activation after Plk1 inhibition. In four animal NSCLC models, mesenchymal tumors were more sensitive to Plk1 inhibition alone than were epithelial tumors. The combination of cMet and Plk1 inhibition led to regression of tumors that did not regrow when drug treatment was stopped. Plk1 inhibition did not affect HGF levels but did decrease vimentin phosphorylation, which regulates cMet phosphorylation via β1-integrin. This research defines a heretofore unknown mechanism of ligand-independent activation of cMet downstream of Plk1 and an effective combination therapy.
Keywords: NSCLC; Plk1; cMet; drug combination; vimentin.
© 2019 The Authors. Published under the terms of the CC BY 4.0 license.
Conflict of interest statement
Faye M. Johnson has received research funding from PIQUR Therapeutics and Trovagene. Other authors have no conflicts of interest to declare.
Figures
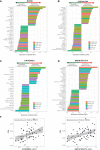
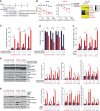
Figure EV1. Basal expression of proteins that correlate with sensitivity to Plk1 inhibitors
- A–D
Sensitivity data for the Plk1 inhibitors BI2536, GSK461364, BRD‐K70511574, and GW‐843682X were obtained from the Cancer Therapeutics Response Portal v2 database. Protein expression data (reverse phase protein array) were obtained from the MD Anderson Cell Line Project database. Spearman's correlations of area under the curve (AUC) values and protein expression in non–small‐cell lung cancer cell lines in vitro are shown for those with a Spearman rho coefficient > 0.3 for BI2536 (A), GSK461364 (B), GW‐843682X (C), and BRD‐K70511574 (D). The color of the bars indicates the _P_‐value per the legend in the graph. - E
Basal cMet protein expression in non–small‐cell lung cancer cell lines compared with AUC values of GW‐843682X and BRD‐K70511574. The blue line represents linear regression and 95% confidence interval is indicated in dark gray.
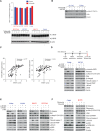
Figure 1. Epithelial‐to‐mesenchymal transition proteins are associated with sensitivity to Plk1 inhibitors in non–small‐cell lung cancer cell lines in vitro in an independent dataset
Spearman's correlations between protein expression and sensitivity to Plk1 inhibitors (BI2536, GSK461364, BRD‐K70511574, and GW‐843682X), based on data from the Cancer Therapeutics Response Portal v2 database and protein expression data derived from the MD Anderson Cell Line Project database (Li et al, 2017).
- A
Proteins with expression levels that correlate with area under the curve (AUC) values for at least two drugs are included in the graph. The color and size of the data point represent the direction and significance (_P_‐value) of the correlation. Red indicates a positive correlation with drug resistance and green a positive correlation with drug sensitivity (i.e., proteins in red are more highly expressed in resistant cell lines). - B
AUC values for two Plk1 inhibitors are compared with expression of selected proteins (cMet, E‐cadherin, β‐catenin, and Snail); each data point represents an individual non–small‐cell lung cancer cell line. The gray shaded area represents the 95% confidence interval around the linear regression (blue line). E‐cadherin, β catenin, and cMet protein expression correlated with drug resistance.
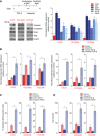
Figure 2. TGF‐β–induced mesenchymal phenotype increases sensitivity to Plk1 inhibition
- A
Three epithelial/resistant non–small‐cell lung cancer cell lines were treated with 5 ng/ml TGF‐β for 14 days to induce a mesenchymal phenotype, which was confirmed with Western blot (left) and qPCR (right) analysis of epithelial‐to‐mesenchymal transition (EMT) markers. - B
Parental and TGF‐β isogenic cell lines were treated with 50 nM volasertib for 72 h. Cells were then harvested, and lysates were immunoblotted for cleaved PARP and γH2AX proteins that were subsequently quantitated and normalized with β‐actin. - C, D
Apoptosis was measured by the Apo‐BrdU assay (C), and DNA damage was measured by the Comet assay (D).
Data information: Data are means ± standard error of the mean from three independent experiments. Significant differences using two‐way analysis of variance with Bonferroni or Benjamini–Hochberg correction for multiple comparison are indicated (*P < 0.01).Source data are available online for this figure.
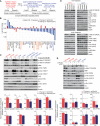
Figure 3. Activation of cMet is differentially regulated in epithelial and mesenchymal non–small‐cell lung cancer (NSCLC) cell lines following Plk1 inhibition and knockdown
- A
Three pairs of TGF‐β–treated isogenic NSCLC cell lines (H1975, HCC4006, and HCC366) and two mesenchymal NSCLC cell lines (Calu6 and H1792) were incubated with 50 nM volasertib for 24 h, lysed, and subjected to reverse phase protein array analysis. Experiments were done in triplicate. - B
Thirty‐three proteins were differentially regulated between epithelial and mesenchymal NSCLC cell lines after treatment with volasertib, including those involved in the cMet/FAK/Src signaling axis (blue text) and those involved in the PI3K/Akt signaling axis (orange text). - C
The same cell lines treated identically were subjected to immunoblotting for the indicated proteins (upper) with densitometric quantification normalized with β‐actin (lower). - D
Epithelial (red text) and mesenchymal (blue text) NSCLC cell lines transfected with 10 nM siRNA as indicated for 48 h and subjected to Western blotting with the indicated antibodies (upper) with densitometric quantification normalized with β‐actin (lower). NT, non‐targeting control. - E
H1975 and Calu6 cells were treated with indicated inhibitors for 4 h or 24 h. Cells were then harvested, and lysates were immunoblotted for the indicated proteins.
Data information: Data are means ± standard error of the mean from three independent experiments. Significant differences using two‐sided Student's _t_‐test are indicated by *P < 0.05.Source data are available online for this figure.
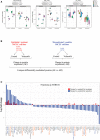
Figure EV2. cMet, FAK, and Src phosphorylation regulation in epithelial and mesenchymal non–small‐cell lung cancer cell lines following Plk1 inhibition
- A
Box plots show protein expression of p‐cMet (Y1234/35), pFAK (Y397), and pSrc (Y416) measured using reverse phase protein array after treatment with volasertib in non–small‐cell lung cancer cell lines. Experiments were performed in triplicate. The median is marked by a horizontal line, the colored boxes are the upper and lower quartiles, and error bars represent standard deviation. FC, fold change. - B
Three epithelial (H1975, HCC4006, and HCC366) and two mesenchymal (Calu6 and H1792) NSCLC cell lines were incubated with 50 nM volasertib for 24 h, lysed, and subjected to reverse phase protein array analysis. Experiments were done in triplicate. - C
Seventy proteins were differentially regulated between epithelial and mesenchymal NSCLC cell lines after treatment with volasertib, including those involved in the cMet/FAK/Src signaling axis proteins (blue text) and the PI3K/Akt signaling axis (orange text). FDR, false discovery rate.
Figure 4. Co‐targeting of cMet and Plk1 enhances apoptosis in non–small‐cell lung cancer (NSCLC) in vitro
- A
Schematic of the experimental plan for Plk1 and cMet inhibition/silencing for viability and apoptosis studies in mesenchymal and epithelial NSCLC cell lines. - B
Cell viability was measured using CellTiter‐Glo in NSCLC cell lines treated with volasertib, tepotinib, or a 1:2 ratio of both for 72 h. Left: representative cell viability graph of cells treated with the indicated drugs. Right: heatmap depicting the calculated combination indices at Fa = 0.25 and Fa = 0.5. - C
Apoptosis was measured using the Apo‐BrdU assay in the indicated cell lines treated with the indicated drugs for 24 h. - D
Immunoblots from cells treated with indicated drugs for 24 h (left) with densitometric quantification normalized with β‐actin (right). - E
All tested cell lines were treated as indicated for 24 h and allowed to grow in drug‐free medium for 15–20 days to form colonies, which were counted using ImageJ. - F
Apoptosis was measured using the Apo‐BrdU assay in the indicated cell lines transfected with 10 nM siRNA as indicated for 48 h. NT, non‐targeting control. - G
Immunoblots from cells transfected with siRNA as indicated for 48 h (left) with densitometric quantification normalized with β‐actin (right).
Data information: Data are means ± standard error of the mean from three independent experiments. Significant differences using two‐way analysis of variance with Bonferroni or Benjamini–Hochberg (BH) correction for multiple comparison are indicated (*P < 0.01). Mesenchymal and epithelial NSCLC cell lines are indicated in blue and red text, respectively.
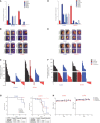
Figure EV3. Co‐targeting of cMet and Plk1 reduces tumor size in non–small‐cell lung cancer
- A
mRNA was extracted from two untreated patient‐derived xenograft (PDX) tumors, and the expression of epithelial‐to‐mesenchymal transition genes was normalized with respect to GAPDH expression. Data are means ± standard error of the mean from two independent tumors. - B
Mice bearing epithelial (red text) and mesenchymal (blue text) non–small‐cell lung cancer PDXs were treated with vehicle control, volasertib (30 mg/kg per week intravenously), tepotinib (25 mg/kg per day orally), or the combination for 5 weeks; representative PDX tumors from the end of treatment are pictured. - C
Waterfall plots show the percent change in individual PDX tumor volumes at the end of treatment (normalized to day zero), as indicated. - D
mRNA was extracted from two untreated xenograft tumors, and the expression of epithelial‐to‐mesenchymal transition genes was normalized with respect to GAPDH expression. Data are means ± standard error of the mean from two independent tumors. - E
Mice bearing epithelial (red text) and mesenchymal (blue text) NSCLC cell line xenografts were treated with vehicle control, volasertib (30 mg/kg per week intravenously), tepotinib (25 mg/kg per day orally), or the combination for 5 weeks; representative xenograft tumors from the end of treatment are pictured at the top. - F
Waterfall plots show the percent change in individual xenograft tumor volumes at the end of treatment (normalized to day zero), as indicated. - G
Kaplan–Meier survival curves for mice with epithelial H1975 and mesenchymal Calu6 xenografts, with death due to excessive tumor burden as the endpoint. Log‐rank (Mantel‐Cox) test was used for Kaplan‐Meier survival curves. - H
Mice bearing non–small‐cell lung cancer cell line xenografts (left) were treated for 4 weeks and mice bearing patient‐derived xenografts (right) were treated for 5 weeks with vehicle control, volasertib (30 mg/kg per week intravenously), tepotinib (25 mg/kg per day orally), or the combination as indicated. Mouse weight was recorded twice weekly to generate the graphs. Data are mean ± standard error of the mean from 10 mice for each group.
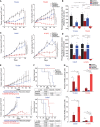
Figure 5. Co‐targeting of cMet and Plk1 induces apoptosis and reduces tumor size in non–small‐cell lung cancer
- A–D
Mice bearing epithelial (red text) and mesenchymal (blue text) non–small‐cell lung cancer tumors were treated with vehicle control, volasertib (30 mg/kg per week intravenously), tepotinib (25 mg/kg per day orally), or the combination for 5 weeks to generate tumor growth curves of patient‐derived xenografts (PDX; A) and cell line xenografts (C). The percent change in tumor volume at the end of treatment (normalized to day zero) was calculated with each data point representing an individual mouse, and the bar is the mean value ± standard error of 10 mice for each group (B, D). - E
Tumor growth curve of mesenchymal PDX TC424 (top) and cell line xenograft Calu6 (bottom) upon treatment for 5 weeks and after cessation of treatment (recovery phase). Data are means ± standard error of the mean from five mice for each group. - F
Kaplan–Meier survival curves for mesenchymal PDX TC424 (top) and cell line xenograft Calu6 (bottom) with death due to excessive tumor burden as the endpoint. - G
Quantification of TUNEL‐positive cells in paraffin‐embedded xenograft tissue sections. Data are means ± standard error of the mean from six mice for each group.
Data information: Significant differences using two‐way analysis of variance with Bonferroni or Benjamini–Hochberg correction for multiple comparisons are indicated. *P < 0.01.Source data are available online for this figure.
Figure EV4. Expression of the TPR‐Met chimeric protein is biologically active and decreases volasertib sensitivity
- A
Calu6, H157, and H1355 parental and TPR‐Met–expressing cell lines or vector control (pBABE)–expressing cells were harvested, lysed, and subjected to immunoblotting for the indicated proteins. β‐Actin was used as a loading control. - B
Shown are representative pictures of Calu6 parental and TPR‐Met–expressing cell lines treated with 25 nM volasertib, 400 nM tepotinib, both, or vehicle control for 24 h and allowed to grow in drug‐free medium for 15–20 days to form colonies, which were then stained with crystal violet and photographed. - C
Cell viability of parental and TPR‐Met–expressing Calu6, H157, and H1355 cell lines treated with the indicated concentrations of volasertib for 72 h was measured using CellTiter‐Glo. Experiments were performed in triplicate, and error bars represent standard deviation.
Source data are available online for this figure.
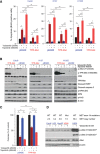
Figure 6. Constitutively active cMet expression reduces sensitivity to Plk1 inhibition
- A
Calu6, H157, and H1355 TPR‐Met–expressing or vector control (pBABE)–expressing cells were treated as indicated for 24 h, and apoptosis was measured using the Apo‐BrdU assay. - B
Parental and TPR‐Met–expressing cell lines were treated with the indicated drugs for 24 h. Cells were then harvested, and lysates were immunoblotted for the indicated proteins. β‐Actin was used as a loading control. - C
Parental and TPR‐Met–expressing cell lines were treated as indicated for 24 h and allowed to grow in drug‐free medium for 15–20 days to form colonies, which were counted using ImageJ. - D
Mesenchymal NSCLC cell lines with the noted MET alterations were incubated with 50 nM volasertib for 4 h and subjected to immunoblotting with the indicated antibodies.
Data information: (A and C) Data are means ± standard error of the mean from three independent experiments. Significant differences using two‐way analysis of variance with Bonferroni or Benjamini–Hochberg correction for multiple comparisons are indicated. *P < 0.05. **P < 0.01.Source data are available online for this figure.
Figure 7. The volasertib acquired resistance (VAR) cell line shows mesenchymal‐to‐epithelial transition and persistent cMet phosphorylation
- A
Cell viability measured by CellTiter‐Glo in Calu6 parental and Calu6‐VAR cells treated with different concentrations of volasertib for 72 h. - B
Micrograph shows acquisition of a mesenchymal‐to‐epithelial transition phenotype in VAR cells. Scale bar: 100 μm. - C
Basal protein and mRNA expression in parental and VAR cells for the indicated proteins was measured using immunoblotting (upper) and reverse‐transcription PCR (lower), with GAPDH expression used for normalization. - D
Parental and VAR cells were treated as indicated for 48 h, and apoptosis was measured using the Apo‐BrdU assay. - E
Parental and VAR cells were treated with the indicated drug concentrations for 48 h. Cells were then harvested, and lysates were immunoblotted for the indicated proteins. - F
Parental and VAR cells were treated as indicated for 24 h and allowed to grow in drug‐free medium for 15–20 days to form colonies, which were counted using ImageJ.
Data information: Data are means ± standard error of the mean from three independent experiments. Significant differences using two‐way analysis of variance with Bonferroni or Benjamini–Hochberg correction for multiple comparisons are indicated. *P < 0.01.Source data are available online for this figure.
Figure EV5. Plk1 regulates vimentin phosphorylation, leading to integrin β1–mediated cMet activation
- A
Non–small‐cell lung cancer cell lines were treated with 50 nM volasertib in serum‐free medium for 24 h. HGF levels were measured in conditioned medium (upper). Data are means ± standard error of the mean from three independent experiments. Non–small‐cell lung cancer cell lines were treated as indicated with 25 nM volasertib or 400 nM tepotinib for 24 h. Cells were then harvested, and lysates were immunoblotted for the indicated proteins (lower). - B
The indicated mesenchymal cell lines were incubated with 0.5 μg/ml HGF neutralizing antibody or 50 nM volasertib as indicated for 24 h and subjected to immunoblotting. - C
NSCLC cell line mRNA expression of vimentin (VIM) and integrin β1 (ITGB1) and epithelial‐to‐mesenchymal transition (EMT) scores were obtained from our previous study (22). Spearman's correlations of EMT score and mRNA expression of VIM and ITGB1 in NSCLC cell lines in vitro. - D
Calu6 and H1792 cell lines were transfected with 10 nM siRNA for 48 h and subsequently treated with 25 nM volasertib for 24 h as indicated. Cells were then harvested, and lysates were immunoblotted for the indicated proteins. - E
NSCLC cell lines were transfected with ITGB1 and Plk1 siRNA for 48 h. Cells were then harvested, and lysates were immunoblotted for the indicated proteins. - F
NSCLC cell lines were treated with volasertib in fibronectin‐coated (5 μg/cm2 for 30 min at room temperature) or fibronectin‐uncoated plates. Cells were then harvested, and lysates were immunoblotted for the indicated proteins. NT, non‐targeting control.
Source data are available online for this figure.
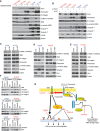
Figure 8. Plk1 inhibition or silencing decreases vimentin phosphorylation and regulates cMet phosphorylation via β1‐integrin
- A
Epithelial and mesenchymal non–small‐cell lung cancer (NSCLC) cell lines after treatment with 50 nM volasertib for 24 h. Cells were then harvested, and lysates were immunoblotted for the indicated proteins. - B
Epithelial and mesenchymal NSCLC cell lines after Plk1 silencing with siRNA for 48 h. Cells were then harvested, and lysates were immunoblotted for the indicated proteins. - C
Calu6 and H1792 mesenchymal NSCLC cell lines after VIM silencing with siRNA for 48 h. Cells were then harvested, and lysates were immunoblotted for the indicated proteins. - D
Calu6 (mesenchymal) and H1975 (epithelial) NSCLC cell lines after PLK1 and ITGB1 silencing with siRNA for 48 h. Cells were then harvested, and lysates were immunoblotted for the indicated proteins. - E
Calu6 (mesenchymal) and H1975 (epithelial) NSCLC cell lines after treatment with fibronectin for 24 h. Cells were then harvested, and lysates were immunoblotted for the indicated proteins. - F
Calu6 and H1975 NSCLC cell lines after treatment with 50 nM volasertib for 24 h. Cells were then harvested, and lysates were immunoprecipitated (IP) using β1‐integrin, vimentin, and Plk1 antibodies, then immunoblotted for the indicated proteins. - G
Schematic summary of the proposed mechanism by which cMet drives primary and acquired resistance to volasertib in NSCLC and possible treatment combinations to overcome this resistance.
Source data are available online for this figure.
Similar articles
- Epithelial-Mesenchymal Transition Predicts Polo-Like Kinase 1 Inhibitor-Mediated Apoptosis in Non-Small Cell Lung Cancer.
Ferrarotto R, Goonatilake R, Yoo SY, Tong P, Giri U, Peng S, Minna J, Girard L, Wang Y, Wang L, Li L, Diao L, Peng DH, Gibbons DL, Glisson BS, Heymach JV, Wang J, Byers LA, Johnson FM. Ferrarotto R, et al. Clin Cancer Res. 2016 Apr 1;22(7):1674-1686. doi: 10.1158/1078-0432.CCR-14-2890. Epub 2015 Nov 23. Clin Cancer Res. 2016. PMID: 26597303 Free PMC article. - Polo-like kinase 1 inhibition diminishes acquired resistance to epidermal growth factor receptor inhibition in non-small cell lung cancer with T790M mutations.
Wang Y, Singh R, Wang L, Nilsson M, Goonatilake R, Tong P, Li L, Giri U, Villalobos P, Mino B, Rodriguez-Canales J, Wistuba I, Wang J, Heymach JV, Johnson FM. Wang Y, et al. Oncotarget. 2016 Jul 26;7(30):47998-48010. doi: 10.18632/oncotarget.10332. Oncotarget. 2016. PMID: 27384992 Free PMC article. - In vitro study of the Polo-like kinase 1 inhibitor volasertib in non-small-cell lung cancer reveals a role for the tumor suppressor p53.
Van den Bossche J, Deben C, De Pauw I, Lambrechts H, Hermans C, Deschoolmeester V, Jacobs J, Specenier P, Pauwels P, Vermorken JB, Peeters M, Lardon F, Wouters A. Van den Bossche J, et al. Mol Oncol. 2019 May;13(5):1196-1213. doi: 10.1002/1878-0261.12477. Epub 2019 Apr 5. Mol Oncol. 2019. PMID: 30859681 Free PMC article. - BI_2536--targeting the mitotic kinase Polo-like kinase 1 (Plk1).
Wäsch R, Hasskarl J, Schnerch D, Lübbert M. Wäsch R, et al. Recent Results Cancer Res. 2010;184:215-8. doi: 10.1007/978-3-642-01222-8_15. Recent Results Cancer Res. 2010. PMID: 20072841 Review. - Cross Talk between Wnt/β-Catenin and CIP2A/Plk1 Signaling in Prostate Cancer: Promising Therapeutic Implications.
Cristóbal I, Rojo F, Madoz-Gúrpide J, García-Foncillas J. Cristóbal I, et al. Mol Cell Biol. 2016 May 31;36(12):1734-9. doi: 10.1128/MCB.00130-16. Print 2016 Jun 15. Mol Cell Biol. 2016. PMID: 27090640 Free PMC article. Review.
Cited by
- The NLRP11 Protein Bridges the Histone Lysine Acetyltransferase KAT7 to Acetylate Vimentin in the Early Stage of Lung Adenocarcinoma.
Yang R, Peng W, Shi S, Peng X, Cai Q, Zhao Z, He B, Tu G, Yin W, Chen Y, Zhang Y, Liu F, Wang X, Xiao D, Tao Y. Yang R, et al. Adv Sci (Weinh). 2023 Sep;10(25):e2300971. doi: 10.1002/advs.202300971. Epub 2023 Jul 9. Adv Sci (Weinh). 2023. PMID: 37424170 Free PMC article. - c-Met-integrin cooperation: Mechanisms, tumorigenic effects, and therapeutic relevance.
Stanislovas J, Kermorgant S. Stanislovas J, et al. Front Cell Dev Biol. 2022 Oct 14;10:994528. doi: 10.3389/fcell.2022.994528. eCollection 2022. Front Cell Dev Biol. 2022. PMID: 36330337 Free PMC article. Review. - Identification and assessment of PLK1/2/3/4 in lung adenocarcinoma and lung squamous cell carcinoma: Evidence from methylation profile.
Deng S, Lu X, Zhang Z, Meng R, Li M, Xia S. Deng S, et al. J Cell Mol Med. 2021 Jul;25(14):6652-6663. doi: 10.1111/jcmm.16668. Epub 2021 Jun 2. J Cell Mol Med. 2021. PMID: 34080290 Free PMC article. - The MET Oncogene Network of Interacting Cell Surface Proteins.
Gallo S, Folco CB, Crepaldi T. Gallo S, et al. Int J Mol Sci. 2024 Dec 21;25(24):13692. doi: 10.3390/ijms252413692. Int J Mol Sci. 2024. PMID: 39769452 Free PMC article. Review. - Vimentin Intermediate Filaments as Potential Target for Cancer Treatment.
Strouhalova K, Přechová M, Gandalovičová A, Brábek J, Gregor M, Rosel D. Strouhalova K, et al. Cancers (Basel). 2020 Jan 11;12(1):184. doi: 10.3390/cancers12010184. Cancers (Basel). 2020. PMID: 31940801 Free PMC article. Review.
References
- Bladt F, Faden B, Friese‐Hamim M, Knuehl C, Wilm C, Fittschen C, Gradler U, Meyring M, Dorsch D, Jaehrling F, et al (2013) EMD 1214063 and EMD 1204831 constitute a new class of potent and highly selective c‐Met inhibitors. Clin Cancer Res 19: 2941–2951 - PubMed
- Byers LA, Diao L, Wang J, Saintigny P, Girard L, Peyton M, Shen L, Fan Y, Giri U, Tumula PK, et al (2013) An epithelial‐mesenchymal transition gene signature predicts resistance to EGFR and PI3K inhibitors and identifies Axl as a therapeutic target for overcoming EGFR inhibitor resistance. Clin Cancer Res 19: 279–290 - PMC - PubMed
Publication types
MeSH terms
Substances
LinkOut - more resources
Full Text Sources
Miscellaneous
