Loss of SATB1 Induces p21-Dependent Cellular Senescence in Post-mitotic Dopaminergic Neurons - PubMed (original) (raw)
. 2019 Oct 3;25(4):514-530.e8.
doi: 10.1016/j.stem.2019.08.013. Epub 2019 Sep 19.
Benjamin Kolisnyk 2, Tae Wan Kim 3, Jia Cheng 2, Jason Ni 2, Jordan A Pearson 2, Emily J Park 2, Kevin Dam 2, Devrim Acehan 4, Lavoisier S Ramos-Espiritu 5, Wei Wang 2, Jack Zhang 2, Jae-Won Shim 6, Gabriele Ciceri 3, Lars Brichta 2, Lorenz Studer 7, Paul Greengard 2
Affiliations
- PMID: 31543366
- PMCID: PMC7493192
- DOI: 10.1016/j.stem.2019.08.013
Loss of SATB1 Induces p21-Dependent Cellular Senescence in Post-mitotic Dopaminergic Neurons
Markus Riessland et al. Cell Stem Cell. 2019.
Abstract
Cellular senescence is a mechanism used by mitotic cells to prevent uncontrolled cell division. As senescent cells persist in tissues, they cause local inflammation and are harmful to surrounding cells, contributing to aging. Generally, neurodegenerative diseases, such as Parkinson's, are disorders of aging. The contribution of cellular senescence to neurodegeneration is still unclear. SATB1 is a DNA binding protein associated with Parkinson's disease. We report that SATB1 prevents cellular senescence in post-mitotic dopaminergic neurons. Loss of SATB1 causes activation of a cellular senescence transcriptional program in dopamine neurons both in human stem cell-derived dopaminergic neurons and in mice. We observed phenotypes that are central to cellular senescence in SATB1 knockout dopamine neurons in vitro and in vivo. Moreover, we found that SATB1 directly represses expression of the pro-senescence factor p21 in dopaminergic neurons. Our data implicate senescence of dopamine neurons as a contributing factor in the pathology of Parkinson's disease.
Keywords: Parkinson’s disease; SATB1; cellular senescence; dopamine; neurodegeneration; neuroinflammation; p21; senolytics; stem cells; transcriptomics.
Copyright © 2019 Elsevier Inc. All rights reserved.
Figures
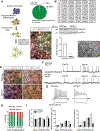
Figure 1.. hESC Derived DA Neurons Require SATB1 to Maintain their Identity
(A) Overview of the differentiation protocol to generate highly enriched cultures of mature DA neurons. Distribution of DA neuron population post FACS, as determined by single-cell qRT-PCR (89 cells analyzed). Immunofluorescent staining of the sorted NURR1-GFP+ neurons with anti-TH and anti-MAP2 showing the high yield of TH+ neurons following differentiation. (B) Amino acid sequence of SATB1 after CRISPR/CAS9 mediated SATB1 knockout reveals the introduction of premature stop codons leading to loss of SATB1 expression. (C) Western blot analysis to confirm SATB1KO in hESC on protein level. (n=6) (D) Microscopic bright light image of SATB1KO hESC shows normal appearance. Scale bar: 200 μm. (E) Immunolabeling of DA precursor markers in WT and SATB1KO hESC derived DA neurons after 16 days of differentiation. (F) Depiction of spontaneous action potentials of WT and SATB1KO DA neurons at different time points show that both genotypes differentiate into mature DA neurons between day 35 and 40. Scale bar: 20 mV, 2 s. (G) DA neurons at day 40 show significant differences in maintenance of response to positive current injections. Scale bar: 20 mV, 200 ms. (5–8 cells recorded per dish, data derived from 3 independent experiments) (H) Longitudinal comparison of cell survival of WT vs. SATB1KO DA neurons revealed a significant reduction in SATB1KO survival between day 30 and 40, reaching a plateau at ~50%. n=12, data are represented as mean ± SEM. (I) Quantification of neurite morphology and complexity in WT and SATB1KO DA neurons. n=24, Data are represented as mean ± SEM. (***p<0.001). See also Figure S1 and Table S1.
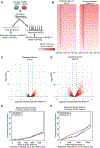
Figure 2.. SATB1 Plays Discrete Regulatory Roles in early and mature DA Neurons.
(A) Outline of the experimental approach comparing expression, DNA-binding, and regulator profile of SATB1 in DA neurons. (B) Genome-wide heatmaps of SATB1-ChIP-Seq experiments comparing binding patterns in early and mature DA neurons (ChIP-Seq experiments performed in 4 independent experiments). RNA-Seq expression profile comparing WT vs. SATB1KO of early DA neurons (C) (n=4) and mature DA neurons (D) (n=3). Red dots indicate significantly changed genes (FDR < 0.05, > ±2-fold expression change). BETA plots of combined computational analysis of SATB1-ChIP-Seq and RNA-Seq data of early DA neurons (E) and mature DA neurons (F). Black line: static background, red line: repressive function, blue line: activating function. See also Figure S2.
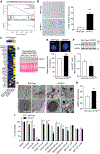
Figure 3.. Loss of SATB1 in Dopamine Neurons Results in a Neuronal Senescence Phenotype.
(A) Diagrammatic representation of gene enrichment significantly correlating with the expression profile of cellular senescence. (B) Representative microscopic overview images of WT and SATB1KO neurons subjected to X-Gal staining. Blue cells are senescence cells. Bar graph shows significant increase of SA-βGal positive cells. n=4, data are represented as mean ± SEM. (C) Heatmap of genes associated with SASP of RNA-Seq data from Figure 2. (D) Western blot of cell culture supernatant of mature DA neurons. The SASP factor IGFBP7 is secreted from SATB1KO neurons. Ponceau S stain serves as loading control (n=3). (E) Representative images from high-quantity imaging of nuclei in WT and SATB1KO DA neurons (n=24). Scale bar: 5 μm. Bar graph shows significant increase of nucleus size in SATB1KO neurons. (F) Representative western blot and quantification of lamin B1 from WT and SATB1KO DA neurons. n=4, data are represented as mean ± SEM. (G) Representative TEM-image of the electron-dense lipofuscin observed in SATB1KO neurons. (H) Quantification of OxiSelect™ Protein Carbonyl ELISA assay, which was performed with protein from WT and SATB1KO DA neurons (n=8). (I) Bar graph shows cell viability of WT and SATB1KO DA neurons following treatment with diverse senolytic compounds (Azi = Azithromycin, D = Dasatinib, Q= Quercetin) (*p<0.05, ***p<0.001). See also Figure S3.
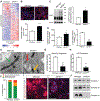
Figure 4.. Dopamine Neurons Lacking SATB1 have impaired Lysosomal and Mitochondrial Function.
(A) Heatmap of the RNA expression of lysosomal genes comparing WT and SATB1KO neurons at day 30 of differentiation. (B) Representative images of LysoTracker staining of WT and SATB1KO neurons. Bar graph shows significant increase of lysosomal content in SATB1KO neurons. n=8, scale bar: 100 μm. Data are represented as mean ± SEM. (C) Representative western blot of mature DA neurons. Bar graph shows significantly increased LAMP1 levels in SATB1KO neurons. n=6, data are represented as mean ± SEM. (D) Bar graphs of cathepsin D and GCase assays. n=5, data are represented as mean ± SEM. (E) Representative TEM-images of mitochondria in mature DA neurons. Green arrow marks normal, yellow marks affected and red arrow marks severely affected mitochondria, quantified in (F) (n=203 mitochondria from 20 WT cells and n=222 mitochondria from 32 SATB1KO cells). Analysis of cellular respiration identified reduced basal respiration (G) and ATP production (H) in SATB1KO neurons (n=10). Data are represented as mean ± SEM. (I) Representative images of MitoTracker CMX stain shows decreased membrane potential in SATB1KO neurons. (J) Native-PAGE of mitochondrial complex integrity using anti-NDUFA9 (Complex I), anti-UQRC2 (Complex III) and anti-MTCO2 (Complex IV) antibodies. (*p<0.05, **p<0.01, ***p<0.001). See also Figure S4.
Figure 5.. CTX Neurons lacking SATB1 do not have a Senescence Phenotype.
(A) Triple immunolabeling of cortical shows that both WT as well as SATB1KO neurons express the essential markers for cortical neurons. Scale bar: 50 μm. (B) RNA-Seq expression profile comparing WT vs. SATB1KO CTX neurons (n=4). Red dots indicate significantly changed genes (FDR < 0.05, > ±2-fold expression change). (C) Genome-wide heatmap of SATB1-ChIP-Seq experiment of CTX neurons (ChIP-Seq experiments performed in 4 independent experiments). (D) BETA plot of combined computational analysis of SATB1-ChIP-Seq and RNA-Seq data of CTX neurons. Black line: static background, red line: repressive function, blue line: activating function. (E) Heatmap of genes associated with SASP. (F) Representative microscopic overview images of WT and SATB1KO neurons subjected to X-Gal staining (n=6). Blue cells are senescence cells. Bar graph shows low levels and no change in numbers of SA-βGal positive cells. Data are represented as mean ± SEM. (G) Representative confocal images of LysoTracker staining of WT and SATB1KO CTX neurons. Bar graph shows no significant change of lysosomal content in SATB1KO CTX neurons. n=8, data are represented as mean ± SEM. Analysis of cellular respiration identified no alteration of basal respiration (H) and ATP production (I) in SATB1KO CTX neurons. n=10, data are represented as mean ± SEM. See also Figure S5.
Figure 6.. SATB1 Repression of CDKN1A Prevents Senescence in DA Neurons.
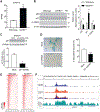
(A) Bar graph shows significant upregulation of CDKN1A expression in SATB1KO DA neurons. n=3, data are represented as mean ± SEM. (B) Western blot probed for p21, p53, gamma H2AX, and b-actin comparing WT and SATB1KO DA neurons (n=5). See also Figure S6C. Bar graph shows significant upregulation of p21. Data are represented as mean ± SEM (C) Representative western blot and quantification of p21 protein level in lentiviral transduced SATB1KO DA neurons. n=3, data are represented as mean ± SEM. (D) Representative microscopic images of SATB1KO neurons subjected to X-Gal staining with and without p21-shRNA transduction. Bar graph shows significant decrease of percentage of SA-βGal positive SATB1KO neurons subjected to p21 knockdown (n=6). Data are represented as mean ± SEM. (E) Heat maps of ATAC-Seq experiments comparing open chromatin patterns in WT and SATB1KO mature DA neurons (ATAC-seq done in independent triplicates). (F) The CDKN1A gene overlaid with ATAC-Seq enrichment tracks from WT and SATB1KO DA neurons as well as SATB1-ChIP-Seq from WT DA neurons. (**p<0.01, ***p<0.001, n.s., not significant). See also Figure S6.
Figure 7.. In vivo reduction of SATB1 induces senescence of DA Neurons.
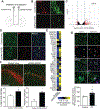
(A) Virus injection strategy. (B) Representative confocal images of TH and Satb1 staining of control-shRNA and _Satb1_-shRNA TH+ neurons in the SNpc, 2 weeks after injection. Scale bar: 50 μm (C) DAT-bacTRAP-based expression profile changes in DA neurons comparing control-shRNA and _Satb1_-shRNA (n=3) (Data from Brichta et al. 2015). Cdkn1a is amongst the highest upregulated transcripts. (D) Representative confocal images of TH and p21 staining of control-shRNA and _Satb1_-shRNA TH+ neurons in the SNpc, 2 weeks after injection. Scale bar: 50 μm (E) Heatmap of mouse genes associated with SASP (n=3) (Data from Brichta et al. 2015). (F) Representative confocal tile scan images of TH and Iba-1 staining of control-shRNA and _Satb1_-shRNA TH+ neurons in the SNpc, 2 weeks after injection. Scale bar: 100 μm. Corresponding bar graphs show the quantification of high activity microglia, and colocalization between Iba-1 and TH signals, in the SNpc, comparing control-shRNA and _Satb1_-shRNA. n=5, data are represented as mean ± SEM. (G) Representative confocal images of TH and p21 staining of human brain slices of the SNpc derived from age-matched control individual or sporadic PD patient. Bar graph shows quantification of intensity of p21 signal in TH+ SNpc neurons of four age-matched control individuals and four PD patients. Scale bar: 50 μm, 5 μm. Data are represented as mean ± SEM. (*p<0.05). See also Figure S7.
Similar articles
- The SATB1-MIR22-GBA axis mediates glucocerebroside accumulation inducing a cellular senescence-like phenotype in dopaminergic neurons.
Russo T, Kolisnyk B, B S A, Plessis-Belair J, Kim TW, Martin J, Ni J, Pearson JA, Park EJ, Sher RB, Studer L, Riessland M. Russo T, et al. Aging Cell. 2024 Apr;23(4):e14077. doi: 10.1111/acel.14077. Epub 2024 Feb 1. Aging Cell. 2024. PMID: 38303548 Free PMC article. - Alpha-Synuclein Preformed Fibrils Induce Cellular Senescence in Parkinson's Disease Models.
Verma DK, Seo BA, Ghosh A, Ma SX, Hernandez-Quijada K, Andersen JK, Ko HS, Kim YH. Verma DK, et al. Cells. 2021 Jul 5;10(7):1694. doi: 10.3390/cells10071694. Cells. 2021. PMID: 34359864 Free PMC article. - Upregulation of the p53-p21 pathway by G2019S LRRK2 contributes to the cellular senescence and accumulation of α-synuclein.
Ho DH, Seol W, Son I. Ho DH, et al. Cell Cycle. 2019 Feb;18(4):467-475. doi: 10.1080/15384101.2019.1577666. Epub 2019 Feb 6. Cell Cycle. 2019. PMID: 30712480 Free PMC article. - SATB1, senescence and senescence-related diseases.
Qi W, Bai J, Wang R, Zeng X, Zhang L. Qi W, et al. J Cell Physiol. 2024 Aug;239(8):e31327. doi: 10.1002/jcp.31327. Epub 2024 May 27. J Cell Physiol. 2024. PMID: 38801120 Review. - SATB1 is a dopaminergic neuron-specific regulator of cellular senescence.
Cancio-Bello A, Saez-Atienzar S. Cancio-Bello A, et al. Mov Disord. 2020 Feb;35(2):235. doi: 10.1002/mds.27978. Epub 2020 Jan 30. Mov Disord. 2020. PMID: 31998985 Free PMC article. Review. No abstract available.
Cited by
- Nuclear alpha-synuclein accelerates cell senescence and neurodegeneration.
Du T, Li G, Zong Q, Luo H, Pan Y, Ma K. Du T, et al. Immun Ageing. 2024 Jul 12;21(1):47. doi: 10.1186/s12979-024-00429-0. Immun Ageing. 2024. PMID: 38997709 Free PMC article. - Cellular senescence and Alzheimer disease: the egg and the chicken scenario.
Saez-Atienzar S, Masliah E. Saez-Atienzar S, et al. Nat Rev Neurosci. 2020 Aug;21(8):433-444. doi: 10.1038/s41583-020-0325-z. Epub 2020 Jun 29. Nat Rev Neurosci. 2020. PMID: 32601397 Review. - Age-dependent instability of mature neuronal fate in induced neurons from Alzheimer's patients.
Mertens J, Herdy JR, Traxler L, Schafer ST, Schlachetzki JCM, Böhnke L, Reid DA, Lee H, Zangwill D, Fernandes DP, Agarwal RK, Lucciola R, Zhou-Yang L, Karbacher L, Edenhofer F, Stern S, Horvath S, Paquola ACM, Glass CK, Yuan SH, Ku M, Szücs A, Goldstein LSB, Galasko D, Gage FH. Mertens J, et al. Cell Stem Cell. 2021 Sep 2;28(9):1533-1548.e6. doi: 10.1016/j.stem.2021.04.004. Epub 2021 Apr 27. Cell Stem Cell. 2021. PMID: 33910058 Free PMC article. - Cell senescence induced by toxic interaction between α-synuclein and iron precedes nigral dopaminergic neuron loss in a mouse model of Parkinson's disease.
Shen QQ, Jv XH, Ma XZ, Li C, Liu L, Jia WT, Qu L, Chen LL, Xie JX. Shen QQ, et al. Acta Pharmacol Sin. 2024 Feb;45(2):268-281. doi: 10.1038/s41401-023-01153-z. Epub 2023 Sep 6. Acta Pharmacol Sin. 2024. PMID: 37674042 Free PMC article. - Regulatory Network Inference of Induced Senescent Midbrain Cell Types Reveals Cell Type-Specific Senescence-Associated Transcriptional Regulators.
Russo T, Plessis-Belair J, Sher R, Riessland M. Russo T, et al. bioRxiv [Preprint]. 2025 Feb 6:2025.02.06.636893. doi: 10.1101/2025.02.06.636893. bioRxiv. 2025. PMID: 39975267 Free PMC article. Preprint.
References
- Acosta JC, O’Loghlen A, Banito A, Guijarro MV, Augert A, Raguz S, Fumagalli M, Da Costa M, Brown C, Popov N, et al. (2008). Chemokine signaling via the CXCR2 receptor reinforces senescence. Cell 133, 1006–1018. - PubMed
Publication types
MeSH terms
Substances
LinkOut - more resources
Full Text Sources
Other Literature Sources
Medical
Molecular Biology Databases
Research Materials
