HMGB1/RAGE axis mediates stress-induced RVLM neuroinflammation in mice via impairing mitophagy flux in microglia - PubMed (original) (raw)
HMGB1/RAGE axis mediates stress-induced RVLM neuroinflammation in mice via impairing mitophagy flux in microglia
Shutian Zhang et al. J Neuroinflammation. 2020.
Abstract
Background: Microglial mediated neuroinflammation in the rostral ventrolateral medulla (RVLM) plays roles in the etiology of stress-induced hypertension (SIH). It was reported that autophagy influenced inflammation via immunophenotypic switching of microglia. High-mobility group box 1 (HMGB1) acts as a regulator of autophagy and initiates the production of proinflammatory cytokines (PICs), but the underlying mechanisms remain unclear.
Methods: The stressed mice were subjected to intermittent electric foot shocks plus noises administered for 2 h twice daily for 15 consecutive days. In mice, blood pressure (BP) and renal sympathetic nerve activity (RSNA) were monitored by noninvasive tail-cuff method and platinum-iridium electrodes placed respectively. Microinjection of siRNA-HMGB1 (siHMGB1) into the RVLM of mice to study the effect of HMGB1 on microglia M1 activation was done. mRFP-GFP-tandem fluorescent LC3 (tf-LC3) vectors were transfected into the RVLM to evaluate the process of autolysosome formation/autophagy flux. The expression of RAB7, lysosomal-associated membrane protein 1 (LAMP1), and lysosomal pH change were used to evaluate lysosomal function in microglia. Mitophagy was identified by transmission electron microscopic observation or by checking LC3 and MitoTracker colocalization under a confocal microscope.
Results: We showed chronic stress increased cytoplasmic translocations of HMGB1 and upregulation of its receptor RAGE expression in microglia. The mitochondria injury, oxidative stress, and M1 polarization were attenuated in the RVLM of stressed Cre-CX3CR1/RAGEfl/fl mice. The HMGB1/RAGE axis increased at the early stage of stress-induced mitophagy flux while impairing the late stages of mitophagy flux in microglia, as revealed by decreased GFP fluorescence quenching of GFP-RFP-LC3-II puncta and decreased colocalization of lysosomes with mitochondria. The expressions of RAB7 and LAMP1 were decreased in the stressed microglia, while knockout of RAGE reversed these effects and caused an increase in acidity of lysosomes. siHMGB1 in the RVLM resulted in BP lowering and RSNA decreasing in SIH mice. When the autophagy inducer, rapamycin, is used to facilitate the mitophagy flux, this treatment results in attenuated NF-κB activation and reduced PIC release in exogenous disulfide HMGB1 (ds-HMGB1)-stimulated microglia.
Conclusions: Collectively, we demonstrated that inhibition of the HMGB1/RAGE axis activation led to increased stress-induced mitophagy flux, hence reducing the activity of microglia-mediated neuroinflammation and consequently reduced the sympathetic vasoconstriction drive in the RVLM.
Keywords: Autophagy; High-mobility group box 1; Hypertension; Microglia; Mitochondria; Neuroinflammation; RAGE; Stress.
Conflict of interest statement
The authors declare that they have no competing interests.
Figures
Fig. 1
The levels of the HMGB1 protein both in CSF and in the RVLM was upregulated after 15 days of stress exposure in mice. a ELISA analysis showed the HMGB1 level in CSF. b Double immunofluorescent staining of HMGB1 in the RVLM of mice brain. The colocalization of HMGB1 with microglia indicates HMGB1 expression both in cytoplasm and nuclear in microglia (red, HMGB1; green, microglia; blue, nucleus/DAPI) (scale bar = 30 μm). c Immunohistochemistry density analysis quantifies the expression of HMGB1. d The levels of colocalization of HMGB1 and OX42 were assessed by using the Pearson coefficient. e Representative band of HMGB1 in nuclear and cytosolic fractions using western immunoblot. f–h Optical density analysis of the immunoblot bands of HMGB1. β-actin was used as a loading control. i, j The levels of acetylation modification of HMGB1. Data are presented as mean ± SEM. n = 6, *P < 0.05, t test
Fig. 2
The suppressive effects of siHMGB1 on cardiovascular activity and noradrenaline (NE) levels in mice. a, b Flow cytometry detection analysis showed the M1 percentage in the RVLM of different groups ex vivo. c SBP (mmHg) recording and measurement under conscious conditions in mice. d NE plasma concentration in mice. Data are presented as mean ± SEM. n = 6, *P < 0.05, ANOVA LSD test
Fig. 3
Stress induces RAGE upregulation while HMGB1 silencing in the RVLM reduced RAGE protein expression. a TLR2, TRL4, TLR9, and RAGE mRNA expression levels in microglia ex vivo were determined by quantitative real-time PCR. b, c The protein was obtained and used to measure the differences in the TLR2, TRL4, TLR9, and RAGE expressions. d Double immunohistochemical to check RAGE and microglia colocalization in the RVLM from siHMGB1, control, and stressed mice. (scale bar = 50 μm). e Densitometric measurement of RAGE immunopositivities. f The levels of Co-localization of RAGE and OX42 was assessed by using the Pearson coefficient. Data are presented as mean ± SEM. n = 6, *P < 0.05, ANOVA LSD test
Fig. 4
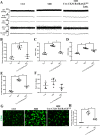
RAGE−/− attenuate the increased M1 polarization, high BP, and great RSNA in stressed mice. a Examples of original tracings of RSNA, HR, and BP recording in different groups of mice. Quantitative analysis of b MAP, c, d RSNA, e SBP, and f heart rate (HR) values for RAGE−/− and stressed mice are shown. g Fluorescence images of microglia immunostained for anti-CD86 (M1 marker) in the RVLM from control, stress, and stress + RAGE−/− mice (scale bar = 50 μm). M1 activation was reduced in RAGE−/− mice. h Quantitative data on the mean densitometry of CD86 positivities. Data are presented as mean ± SEM. n = 6, *P < 0.05, ANOVA LSD test
Fig. 5
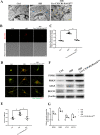
Mitophagy initiation in microglia was increased in the RVLM of stressed mice a Representative photomicrographs of microglia from mice preparation for visualization in transmission electron microscopy (60,000×). Blue arrows indicate disruption of the mitochondria with derangement of the mitochondrial crests. Yellow arrows indicate autophagosome. b, c Representative graph indicates fluorescent probe staining and intensity values of mitoROS; the bottom panel images show the corresponding phase-contrast images (scale bar = 1 μm). d Detection of mitochondria (MitoTracker Green) and LC3 (Red) colocalization using confocal microscopy (scale bar = 2 μm). e The levels of colocalization of LC-3 and MitoTracker were assessed using the Pearson coefficient. f, g Representative immunoblot band and densitometry quantitation of autophagy-related protein (PINK1, PRKN, BECN1, and ATG5) expression in microglia in different groups of mice were shown. Data are presented as mean ± SEM. n = 6, *P < 0.05, ANOVA LSD test
Fig. 6
HMGB1/RAGE axis blocks the late stages of mitophagy flux in stressed microglia. LC3 dots were visualized under fluorescent confocal microscope and quantified following mRFP-GFP-tandem fluorescent LC3 adeno-associated virus transfected to the RVLM in vivo (a, b) (scale bar = 50 μm) and ex vivo (c, d) (scale bar = 2 μm). e–g Whole cell lysates were collected at the indicated time points and analyzed by immunoblotting for LC3II, p62, and β-actin (loading control). The levels of the p62 and LC3-II were increased in the stressed microglia. h Microglia stained with Lyso-Tracker-red and MitoTracker Green to label lysosomes and mitochondria colocalization (scale bar = 2 μm). i The levels of colocalization of MitoTracker and Lyso-Tracker were assessed by using the Pearson coefficient. j Electron micrograph showed few typical autophagosomes in normal cytoplasm of the control microglia. An increased number of mitophagy vesicles were observed in stressed microglia. Red arrows indicate the representative mitophagy, which was visualized as mitochondria-containing autophagosome (scale bar = 0.5 μm). Data are presented as mean ± SEM. n = 6, *P < 0.05, ANOVA LSD test
Fig. 7
Ds-HMGB1 induced increased NF-κB activation resulted from disruption of microglial autophagy. a Representative immunoblot bands of LC3 and SQSTM1/p62 in different groups of microglia. b, c Optical density analysis of LC3 and SQSTM1/p62 immunoblot bands. d the mRNA expression of IL-1β and TNF-α was increased in ds-HMGB1-treated microglia in vitro. e NF-κB p65 was detected from nuclear and cytosolic fractions extracted from microglia using western immunoblot. f–h Optical density analysis of phosphorylation of NF-κB p65 bands both in nuclear and cytosolic fractions of microglia. β-actin and histone were used as the cytoplasmic or nuclear loading control, respectively. Data are presented as mean ± SEM. n = 6, *P < 0.05, ANOVA LSD test
Fig. 8
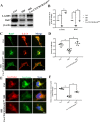
Lysosomal function is impaired in RAGE−/− mice. a Representative western blot images and b statistical analysis of RAB7 and LAMP1 expression in microglia. c Double immunofluorescence showed colocalization of RAB7 and LC3 which was analyzed by confocal fluorescence microscopy. d The level of colocalization of LC3 (red) and RAB7 (green) was assessed by using the Pearson coefficient (scale bar = 2 μm). e, f Acidation of lysosome was detected by using the Lyso-Tracker/Lyso-Sensor staining (scale bar = 2 μm). Data are presented as mean ± SEM. n = 6, *P < 0.05, ANOVA LSD test
Fig. 9
Schematic diagram displaying HMGB1/RAGE axis mediating stress-induced RVLM neuroinflammation via impairing mitophagy flux in microglia
Similar articles
- Neuroinflammation contributes to autophagy flux blockage in the neurons of rostral ventrolateral medulla in stress-induced hypertension rats.
Du D, Hu L, Wu J, Wu Q, Cheng W, Guo Y, Guan R, Wang Y, Chen X, Yan X, Zhu D, Wang J, Zhang S, Guo Y, Xia C. Du D, et al. J Neuroinflammation. 2017 Aug 23;14(1):169. doi: 10.1186/s12974-017-0942-2. J Neuroinflammation. 2017. PMID: 28835252 Free PMC article. - Microglia-Derived NLRP3 Activation Mediates the Pressor Effect of Prorenin in the Rostral Ventrolateral Medulla of Stress-Induced Hypertensive Rats.
Hu L, Zhang S, Ooi K, Wu X, Wu J, Cai J, Sun Y, Wang J, Zhu D, Chen F, Xia C. Hu L, et al. Neurosci Bull. 2020 May;36(5):475-492. doi: 10.1007/s12264-020-00484-9. Epub 2020 Apr 3. Neurosci Bull. 2020. PMID: 32242284 Free PMC article. - Persistent Increase in Microglial RAGE Contributes to Chronic Stress-Induced Priming of Depressive-like Behavior.
Franklin TC, Wohleb ES, Zhang Y, Fogaça M, Hare B, Duman RS. Franklin TC, et al. Biol Psychiatry. 2018 Jan 1;83(1):50-60. doi: 10.1016/j.biopsych.2017.06.034. Epub 2017 Jul 21. Biol Psychiatry. 2018. PMID: 28882317 Free PMC article. - Clinical Implications of High-mobility Group Box-1 (HMGB1) and the Receptor for Advanced Glycation End-products (RAGE) in Cutaneous Malignancy: A Systematic Review.
Nguyen AH, Detty SQ, Agrawal DK. Nguyen AH, et al. Anticancer Res. 2017 Jan;37(1):1-7. doi: 10.21873/anticanres.11282. Anticancer Res. 2017. PMID: 28011467 Review. - Expatiating the molecular approaches of HMGB1 in diabetes mellitus: Highlighting signalling pathways via RAGE and TLRs.
Behl T, Sharma E, Sehgal A, Kaur I, Kumar A, Arora R, Pal G, Kakkar M, Kumar R, Bungau S. Behl T, et al. Mol Biol Rep. 2021 Feb;48(2):1869-1881. doi: 10.1007/s11033-020-06130-x. Epub 2021 Jan 21. Mol Biol Rep. 2021. PMID: 33479829 Review.
Cited by
- High Mobility Group Box 1 in Human Cancer.
Rapoport BL, Steel HC, Theron AJ, Heyman L, Smit T, Ramdas Y, Anderson R. Rapoport BL, et al. Cells. 2020 Jul 10;9(7):1664. doi: 10.3390/cells9071664. Cells. 2020. PMID: 32664328 Free PMC article. Review. - Extracellular vesicles, from the pathogenesis to the therapy of neurodegenerative diseases.
Xia X, Wang Y, Zheng JC. Xia X, et al. Transl Neurodegener. 2022 Dec 12;11(1):53. doi: 10.1186/s40035-022-00330-0. Transl Neurodegener. 2022. PMID: 36510311 Free PMC article. Review. - Sigma-1 Receptor Activation Suppresses Microglia M1 Polarization via Regulating Endoplasmic Reticulum-Mitochondria Contact and Mitochondrial Functions in Stress-Induced Hypertension Rats.
Ooi K, Hu L, Feng Y, Han C, Ren X, Qian X, Huang H, Chen S, Shi Q, Lin H, Wang J, Zhu D, Wang R, Xia C. Ooi K, et al. Mol Neurobiol. 2021 Dec;58(12):6625-6646. doi: 10.1007/s12035-021-02488-6. Epub 2021 Oct 2. Mol Neurobiol. 2021. PMID: 34601668 - Upregulation of Chemokines in the Paraventricular Nucleus of the Hypothalamus in Rats with Stress-Induced Hypertension.
Wu Q, Chen Y, Zhang W, Song S, Xu Z, Zhang H, Liu L, Sun J. Wu Q, et al. Med Sci Monit. 2020 Nov 17;26:e926807. doi: 10.12659/MSM.926807. Med Sci Monit. 2020. PMID: 33199674 Free PMC article. - Novel insight into cGAS-STING pathway in ischemic stroke: from pre- to post-disease.
Ma X, Xin D, She R, Liu D, Ge J, Mei Z. Ma X, et al. Front Immunol. 2023 Oct 17;14:1275408. doi: 10.3389/fimmu.2023.1275408. eCollection 2023. Front Immunol. 2023. PMID: 37915571 Free PMC article. Review.
References
- Grippo AJ, Moffitt JA, Johnson AK. Cardiovascular alterations and autonomic imbalance in an experimental model of depression. Am J Phys Regul Integr Comp Phys. 2002;282(5):R1333–R1341. - PubMed
MeSH terms
Substances
LinkOut - more resources
Full Text Sources
Medical
Research Materials
Miscellaneous


