Nesfatin-1 suppresses interleukin-1β-induced inflammation, apoptosis, and cartilage matrix destruction in chondrocytes and ameliorates osteoarthritis in rats - PubMed (original) (raw)
. 2020 Jan 30;12(2):1760-1777.
doi: 10.18632/aging.102711. Epub 2020 Jan 30.
Kai Xu 1, Jin Li 2, Xindie Zhou 3, Langhai Xu 1, Zhipeng Wu 1, Chiyuan Ma 1, Jisheng Ran 1, Pengfei Hu 1, Jiapeng Bao 1, Lidong Wu 1, Yan Xiong 1
Affiliations
- PMID: 32003758
- PMCID: PMC7053635
- DOI: 10.18632/aging.102711
Nesfatin-1 suppresses interleukin-1β-induced inflammation, apoptosis, and cartilage matrix destruction in chondrocytes and ameliorates osteoarthritis in rats
Lifeng Jiang et al. Aging (Albany NY). 2020.
Abstract
Osteoarthritis (OA) is a chronic degenerative joint disease, related to the overexpression of matrix metalloproteinases (MMPs), a disintegrin and metalloproteinase with thrombospondin motifs (ADAMTS), inflammation, and chondrocyte apoptosis. Nesfatin-1 is an adipokine, which plays an important role in the development of OA, especially in obese people. In the present study, cartilage degradation and apoptosis observed in OA patients was evaluated. Furthermore, the anti-inflammatory and anti-apoptotic effects of nesfatin-1, and its underlying in vitro and in vivo mechanisms were investigated. The results showed that nesfatin-1 increased significantly the expression of collagen type II alpha 1 chain (Col2a1), and reduced the expression of MMPs, ADAMTS5, cyclooxygenase (COX)-2, caspase-3, nitric oxide (NO), inducible nitric oxide synthase (iNOS), prostaglandin E2 (PGE2), interleukin (IL)-6, and chondrocyte apoptosis rate, which may be induced by IL-1β in rat chondrocytes. Furthermore, nesfatin-1 treatment prevented cartilage degeneration in the rat OA model. It was found that nesfatin-1 suppressed the IL-1β-induced activation of NF-κB, the mitogen-activated protein kinase (MAPK), and the Bax/Bcl-2 signal pathway in chondrocytes. These results suggest that in vivo nesfatin-1 could play a protective role in the development of OA and can be potentially used for its treatment.
Keywords: apoptosis; inflammation; matrix metalloproteinases; nesfatin-1; osteoarthritis.
Conflict of interest statement
CONFLICTS OF INTEREST: The authors declare that they have no conflict of interest.
Figures
Figure 1
Chondrocyte apoptosis, inflammation, and matrix degradation in the OA samples. (A) Representative images of H&E staining; (B) Representative images of immunohistochemistry; (C60) Quantitative optical density analysis of immunohistochemistry. Data represent the mean ± SD (n=5) and were analyzed by one-way analysis of variance followed by Tukey's post hoc test. ** p < 0.01 and * p < 0.05 versus normal samples.
Figure 2
Effect of nesfatin-1 and IL-1β on cell viability. (A) Cells treated with increasing concentrations of nesfatin-1 (0, 0.1, 1 to 1000 ng/mL) for 24 h. (B) Pre-treatment with nesfatin-1 for 2 hours, followed by IL-1β treatment for 24 h. Chondrocyte viability was evaluated via CCK-8 analysis. Data represent the mean ± SD (n=3) and were analyzed by one-way analysis of variance followed by Tukey's post hoc test.* p < 0.05 versus IL-1β-treated alone samples.
Figure 3
Apoptosis rate determination using flow cytometry of nesfatin-1- and IL-1β-treated cells. (A) Cells pre-treated with nesfatin-1 (10 ng/mL) for 2 hours, followed by IL-1β treatment for 24 hours, and analyzed by flow cytometry. (B) Flow cytometric analysis. IL-1β-stimulation alone significantly increased the percentage of apoptotic chondrocytes. Annexin V- and PI-positive cells were markedly decreased among nesfatin-1 pre-treated cells. Data represent the mean ± SD (n=3) and were analyzed by one-way analysis of variance followed by Tukey's post hoc test. ** p < 0.01 versus the IL-1β group.
Figure 4
Effect of nesfatin-1 on IL-1β-induced activation of apoptosis in rat chondrocytes. (A) Chondrocytes were treated with nesfatin-1 on IL-1β-induced chondrocytes for 6 h and the protein levels of Bcl-2, Bax, cleaved caspase-3, pro-caspase-3, cleaved PARP, and PARP were evaluated via western blot analysis. (B–D) Quantitative analysis of western blot in rat chondrocytes. Data represent the mean ± SD (n=3) and were analyzed by one-way analysis of variance followed by Tukey's post hoc test. ** p < 0.01 versus the IL-1β group.
Figure 5
Nesfatin-1 suppressed the IL-1β-induced MMP-3, MMP-9, and MMP-13 expression in rat chondrocytes and the secretion level in the supernatant. Chondrocytes were treated with different concentrations of nesfatin-1 on IL-1β-induced chondrocytes for 24 h. The secretion level of MMPs was evaluated by ELISA (A, B, and C) and the mRNA level of MMPs was evaluated via real-time PCR (D, E, and F). The values are expressed as mean ±SD (n=3) and were analyzed by one-way analysis of variance followed by Tukey's post hoc test. **p < 0.01 versus the IL-1β group.
Figure 6
Nesfatin-1 suppressed the IL-1β-induced MMP-3, MMP-9, and MMP-13 expression in rat chondrocytes. Chondrocytes were treated with different concentrations of nesfatin-1 on IL-1β-induced chondrocytes for 24 h. The protein level of MMPs was evaluated via western blot analysis (A, B, C, and D). The values are expressed as mean ±SD (n=3) and were analyzed by one-way analysis of variance followed by Tukey's post hoc test. **p < 0.01 versus the IL-1β group.
Figure 7
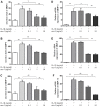
Nesfatin-1 suppressed the IL-1β-induced ADAMTS5 expression and reversed IL-1β-induced Col2a1 degradation in rat chondrocytes. Chondrocytes were treated with different concentrations of nesfatin-1 on IL-1β-induced chondrocytes for 24 h. The mRNA levels of ADAMTS5 and Col2a1 were evaluated via real-time PCR (D, E) and the protein levels of ADAMTS5 and Col2a1 were evaluated via western blot analysis (A, B, and C). The values are expressed as mean ±SD (n=3) and were analyzed by one-way analysis of variance followed by Tukey's post hoc test. **p < 0.01 versus the IL-1β group.
Figure 8
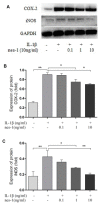
Nesfatin-1 suppressed the IL-1β-induced iNOS and COX-2 expression in rat chondrocytes. Chondrocytes were treated with different concentrations of nesfatin-1 on IL-1β-induced chondrocytes for 24 h. The protein levels of COX-2 and iNOS were evaluated via western blot analysis (A, B, and C). The values are expressed as mean ±SD (n=3) and were analyzed by one-way analysis of variance followed by Tukey's post hoc test. _*p<_0.05, **p < 0.01 versus the IL-1β group.
Figure 9
Nesfatin-1 suppressed the IL-1β-induced IL-6, NO, and PGE2 expression in rat chondrocytes and the supernatant. Chondrocytes were treated with different concentrations of nesfatin-1 on IL-1β-induced chondrocytes for 24 h. The secretion level of IL-6 in the supernatant was evaluated via ELISA (A) and the mRNA level of IL-6 was evaluated via real-time PCR (B). The NO level was evaluated via Griess reaction (C) and the PGE2 level was evaluated via ELISA (D). The values are expressed as mean ±SD (n=3) and were analyzed by one-way analysis of variance followed by Tukey's post hoc test. _*p<_0.05, **p < 0.01 versus the IL-1β group.
Figure 10
Effect of nesfatin-1 on the IL-1β-induced NF-κB and MAPK activation in rat chondrocytes. (A, C). Chondrocytes were treated with different concentrations of nesfatin-1 for 6 h after IL-1β-induction. The protein levels of p38, phosphor-p38, JNK, phosphor-JNK, p65, and phosphor-p65 were evaluated via western blot analysis (B, D, and E). Quantitative analysis of western blot in rat chondrocytes. The values are expressed as mean ±SD (n=3) and were analyzed by one-way analysis of variance followed by Tukey's post hoc test.*p < 0.05, **p < 0.01 versus the IL-1β group.
Figure 11
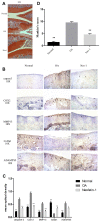
Specimen evaluation in animal models. (A, D) Representative images of safranin-O-stained rat knee joint sections with different treatments and the related Mankin scores of the three groups. Scale bar=200 μm. Data represent the mean ± SD (n = 30) and were analyzed by one-way analysis of variance followed by Tukey's post hoc test. ** p < 0.01 versus the OA group. (B) Representative immunohistochemistry images against MMP-13, COX-2, caspase-3, ADAMTS5, and Col2a1. Scale bar=200 μm; (C) Quantitative optical density analysis of immunohistochemistry for the different groups. Data represent the mean ± SD (n = 30) and were analyzed by one-way analysis of variance followed by Tukey's post hoc test. **p < 0.01 versus the OA group.
Similar articles
- Liquiritigenin inhibits IL-1β-induced inflammation and cartilage matrix degradation in rat chondrocytes.
Tu C, Ma Y, Song M, Yan J, Xiao Y, Wu H. Tu C, et al. Eur J Pharmacol. 2019 Sep 5;858:172445. doi: 10.1016/j.ejphar.2019.172445. Epub 2019 Jun 15. Eur J Pharmacol. 2019. PMID: 31211985 - A chondroprotective effect of moracin on IL-1β-induced primary rat chondrocytes and an osteoarthritis rat model through Nrf2/HO-1 and NF-κB axes.
Zhou S, Shi J, Wen H, Xie W, Han X, Li H. Zhou S, et al. Food Funct. 2020 Sep 23;11(9):7935-7945. doi: 10.1039/d0fo01496f. Food Funct. 2020. PMID: 32832965 - Inhibition of cartilage degradation and suppression of PGE2 and MMPs expression by pomegranate fruit extract in a model of posttraumatic osteoarthritis.
Akhtar N, Khan NM, Ashruf OS, Haqqi TM. Akhtar N, et al. Nutrition. 2017 Jan;33:1-13. doi: 10.1016/j.nut.2016.08.004. Epub 2016 Sep 2. Nutrition. 2017. PMID: 27908544 Free PMC article. - Ghrelin prevents articular cartilage matrix destruction in human chondrocytes.
Liu J, Cao L, Gao X, Chen Z, Guo S, He Z, Qian Y, Yu Y, Wang G. Liu J, et al. Biomed Pharmacother. 2018 Feb;98:651-655. doi: 10.1016/j.biopha.2017.12.050. Epub 2018 Jan 4. Biomed Pharmacother. 2018. PMID: 29291551 Review. - Pachymic acid suppresses the inflammatory response of chondrocytes and alleviates the progression of osteoarthritis via regulating the Sirtuin 6/NF-κB signal axis.
Wu Y, Ying J, Zhu X, Xu C, Wu L. Wu Y, et al. Int Immunopharmacol. 2023 Nov;124(Pt A):110854. doi: 10.1016/j.intimp.2023.110854. Epub 2023 Aug 30. Int Immunopharmacol. 2023. PMID: 37657246 Review.
Cited by
- Hsa_circ_0032131 knockdown inhibits osteoarthritis progression via the miR-502-5p/PRDX3 axis.
Xu J, Ma X. Xu J, et al. Aging (Albany NY). 2021 May 25;13(11):15100-15113. doi: 10.18632/aging.203073. Epub 2021 May 25. Aging (Albany NY). 2021. PMID: 34032607 Free PMC article. - Dual protective role of velutin against articular cartilage degeneration and subchondral bone loss via the p38 signaling pathway in murine osteoarthritis.
Wang K, Lu X, Li X, Zhang Y, Xu R, Lou Y, Wang Y, Zhang T, Qian Y. Wang K, et al. Front Endocrinol (Lausanne). 2022 Jul 22;13:926934. doi: 10.3389/fendo.2022.926934. eCollection 2022. Front Endocrinol (Lausanne). 2022. PMID: 35937813 Free PMC article. - Enteroendocrine cells and gut hormones as potential targets in the crossroad of the gut-kidney axis communication.
Nery Neto JAO, Yariwake VY, Câmara NOS, Andrade-Oliveira V. Nery Neto JAO, et al. Front Pharmacol. 2023 Oct 19;14:1248757. doi: 10.3389/fphar.2023.1248757. eCollection 2023. Front Pharmacol. 2023. PMID: 37927592 Free PMC article. Review. - Hydrogen (H2) Alleviates Osteoarthritis by Inhibiting Apoptosis and Inflammation via the JNK Signaling Pathway.
Lu H, Wang W, Kang X, Lin Z, Pan J, Cheng S, Zhang J. Lu H, et al. J Inflamm Res. 2021 Apr 13;14:1387-1402. doi: 10.2147/JIR.S297622. eCollection 2021. J Inflamm Res. 2021. PMID: 33880054 Free PMC article. - Novel Adipokines and Their Role in Bone Metabolism: A Narrative Review.
Deepika F, Bathina S, Armamento-Villareal R. Deepika F, et al. Biomedicines. 2023 Feb 20;11(2):644. doi: 10.3390/biomedicines11020644. Biomedicines. 2023. PMID: 36831180 Free PMC article. Review.
References
Publication types
MeSH terms
Substances
LinkOut - more resources
Full Text Sources
Medical
Research Materials


