Mannose receptor (CD206) activation in tumor-associated macrophages enhances adaptive and innate antitumor immune responses - PubMed (original) (raw)
. 2020 Feb 12;12(530):eaax6337.
doi: 10.1126/scitranslmed.aax6337.
Rushikesh Sable 3, Michael Ronzetti 4, Wendy Bautista 5, Zachary Knotts 3, Abisola Abisoye-Ogunniyan 2 6, Dandan Li 3, Raul Calvo 4, Myagmarjav Dashnyam 4, Anju Singh 4, Theresa Guerin 5, Jason White 2, Sarangan Ravichandran 7, Parimal Kumar 8, Keyur Talsania 9, Vicky Chen 9, Anghesom Ghebremedhin 2, Balasubramanyam Karanam 2, Ahmad Bin Salam 2, Ruksana Amin 2, Taivan Odzorig 3, Taylor Aiken 6 10, Victoria Nguyen 3, Yansong Bian 3, Jelani C Zarif 11 12, Amber E de Groot 13 14, Monika Mehta 8, Lixin Fan 15, Xin Hu 4, Anton Simeonov 4, Nathan Pate 5, Mones Abu-Asab 16, Marc Ferrer 4, Noel Southall 4, Chan-Young Ock 17, Yongmei Zhao 9, Henry Lopez 18, Serguei Kozlov 5, Natalia de Val 19 20, Clayton C Yates 21, Bolormaa Baljinnyam 22, Juan Marugan 22, Udo Rudloff 23
Affiliations
- PMID: 32051227
- PMCID: PMC7832040
- DOI: 10.1126/scitranslmed.aax6337
Mannose receptor (CD206) activation in tumor-associated macrophages enhances adaptive and innate antitumor immune responses
Jesse M Jaynes et al. Sci Transl Med. 2020.
Abstract
Solid tumors elicit a detectable immune response including the infiltration of tumor-associated macrophages (TAMs). Unfortunately, this immune response is co-opted into contributing toward tumor growth instead of preventing its progression. We seek to reestablish an antitumor immune response by selectively targeting surface receptors and endogenous signaling processes of the macrophage subtypes driving cancer progression. RP-182 is a synthetic 10-mer amphipathic analog of host defense peptides that selectively induces a conformational switch of the mannose receptor CD206 expressed on TAMs displaying an M2-like phenotype. RP-182-mediated activation of this receptor in human and murine M2-like macrophages elicits a program of endocytosis, phagosome-lysosome formation, and autophagy and reprograms M2-like TAMs to an antitumor M1-like phenotype. In syngeneic and autochthonous murine cancer models, RP-182 suppressed tumor growth, extended survival, and was an effective combination partner with chemo- or immune checkpoint therapy. Antitumor activity of RP-182 was also observed in CD206high patient-derived xenotransplantation models. Mechanistically, via selective reduction of immunosuppressive M2-like TAMs, RP-182 improved adaptive and innate antitumor immune responses, including increased cancer cell phagocytosis by reprogrammed TAMs.
Copyright © 2020 The Authors, some rights reserved; exclusive licensee American Association for the Advancement of Science. No claim to original U.S. Government Works.
Conflict of interest statement
Competing interests: J.M.J., H.L., and C.C.Y. have equity interest in Riptide Bioscience Inc., which develops RP-182, RP-185, and RP-832c. J.M.J., H.L., C.C.Y., and U.R. hold a patent on RP-182 (“Peptide-Based Methods for Treating Pancreatic Cancer”; U.S. patent no. 10,016,480). All other authors declare that they have no competing interests.
Figures
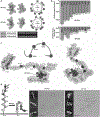
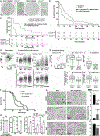
Fig. 1.. RP-182 induces the closed conformation of CD206.
(A) Secondary α-helical structures, helical hydrophobicity wheel projections, and Molly font alignments (bottom) of RP-182 and RP-426. Amphiphilic surface topology shown in cyan (hydrophobic) and magenta (hydrophilic) colors. (<μ>), hydrophobic moment vectors; red arrows indicate strength and direction; yellow and green dots represent N and C termini. (B) Relative binding energies for the top 10 C-type lectin receptors using ClusPro. Green bars, C-type lectin class VI receptors, blue class II receptors. CRD4, carbohydrate recognition domain 4 of CD206. (C) Model of conformational bend in CRD4 and CRD5 of CD206 induced by RP-182. Hydrophobic plane of RP-182 bound to CRD5 (cyan color). (D) Negatively stained electron micrographs of CD206 proteins incubated with vehicle (blue squares) and RP-182 (red squares) and corresponding 2D single-particle images (insets); schematic of open “elongated” and “closed” conformations on left. Scale bars, 50 nm; insets, 5 nm.
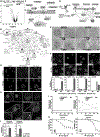
Fig. 2.. RP-182 selectively induces phagocytosis, autophagy, and apoptosis in M2-polarized macrophages.
(A) Volcano plot of RNA-seq analysis of vehicle-versus RP-182-treated M2 macrophages. Red color indicates transcripts with false discovery rate (FDR) q < 0.05, orange transcripts with −1 < log2[FC] >1, transcripts with both in blue. FC, fold change. (B) Cytoscape Functional GO Enrichment and Network Analyses of DEGs of vehicle versus RP-182-treated M2 BMDMs. (C) Pathway Studio graph of GO Cell Processes of the most common genes across enriched gene sets in RP-182-treated M2 BMDMs. Dashed arrows indicate positive regulation, and blue arrows indicate positive expression. (D) Protein network and related cellular processes of CD206 interactome induced by RP-182 in M2 macrophages. (E) Electron microscopy images of M1- and M2-polarized BMDMs. Scale bars, 2 μm; insets, 0.5 μm. (F) Immunofluorescence images of BMDMs polarized into M2 stained with anti-RAB5a, RAB7, LAMP1, and CD206 antibodies and nuclei stained with DAPI (4′,6-diamidino-2-phenylindole). Quantification of induced fluorescence on bottom. For all figures, data shown are representative of three independent experiments and normalized to corresponding vehicle treatment unless indicated otherwise. a.u., arbitrary units. (G) Immunofluorescent images of M2 BMDMs stained with anti-NF-κBp65. (H) Immunofluorescence images of M2 BMDMs costained with anti-CD206 (green) and anti-RAB7 (red). White arrows indicate costaining for both markers. (I) Quantification of activation of phagocytosis (RAB7), autophagy (LC3), and apoptosis (cleaved caspase 8) in M1 and M2 macrophages over time. (J) Quantification of cleaved caspase 3 and 7 after 24 hours of treatment. (K) Cell viability of human and murine M1 (blue curves) and M2 (red curves) macrophages after 48 hours of treatment with RP-182 relative to vehicle treatment.
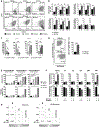
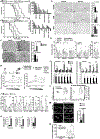
Fig. 3.. RP-182 reprograms M2 macrophages toward an M1-like phenotype.
(A) Flow cytometry plots of CD86 and CD206-positive CD11b+F4/80+Gr1− macrophage fractions of M2 BMDMs after treatment with vehicle or RP-182 at indicated time points. (B) Quantification of fractions of IL-1β, IL-12β, and TNF-α-positive CD11b+F4/80+Gr1− cells, and of CD86+CD206−, CD86+CD206+ double-positive, and CD86−CD206+ subpopulations of M2 BMDMs by flow cytometry. Data shown are representative of three independent experiments conducted in triplicate. (C) Immune checkpoint and M1 cytokine-positive macrophage populations in vehicle-treated CD86−CD206+ M2 BMDMs, and RP-182-treated CD86+CD206− and CD86+CD206+ subpopulations. Univariate histograms with percentage of positive cell fractions, quantifications of n = 3 independent experiments are shown. (D) Flow cytometry analysis and quantification of CD11b+F4/80+Gr1− cell fractions with phagocytosed _Escherichia coli_-covered latex beads (red beads), quantification of n = 3 independent experiments. (E) Quantification of annexin V-positive (top) and cleaved caspase 3-positive cell fractions (bottom) of CD86+CD206−, CD206+CD86+, and CD86−CD206+ M2 BMDMs treated with RP-182 at indicated time points. (F) Quantification of vehicle- and RP-182-treated CD86+ (top) and CD206+ (bottom) CD11b+F4/80+Gr1− BMDM-M2 cells coincubated with NF-κB inhibitors JSH-23 and QNZ (EVP4593), autophagy inhibitors bafilomycin (BF) and chloroquine (CQ), and MEK inhibitor AZD6244 (selumetinib; AZD). (G) Pearson’s correlation analysis of gene expression matrices between samples using global RNA-seq data (left) and M1 M2 marker set derived from BMDMs (right). Values range from 0 to 1, where a high value indicates high degree of correlation between two sample sets.
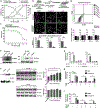
Fig. 4.. Biological activity of RP-182 is CD206 dependent and initiates activation of RAC1/CDC42 signaling.
(A) RP-182 dose-response curves of binding to recombinant CD206 (MST assay; red curve), induction of the closed conformation of CD206 [electron microscopy (EM); green curve], induction of phagocytosis (anti-RAB7; purple), and M2 cell viability (blue) in M2 BMDMs. (B) Immunofluorescence images of BMDMs derived from wild-type and CD206−/− mice polarized into M2 stained with anti-RAB7, LC3, and cleaved caspase 8, quantification of three independent experiments at the bottom. (C) Cell viability of M2 BMDMs derived from CD206wt (red curve) and CD206−/− (brown curve) mice. (D) Flow cytometry plots of CD86+ and CD206+ fractions (top) and quantification of M1 marker-positive cells in CD11b+F4/80+Gr1− M2-BMDMs isolated from CD206−/− mice. Mean percent positive cells of n = 2 independent experiments in triplicate are shown. (E) Immunoblot (IB) of lysates immunoprecipitated (IP) with biotinylated peptides (left) or with anti-GRB2 antibody (right). Proteins visualized using anti-GRB2 and anti-CD206 antibodies. Preloading control superoxide dismutase 1 (SOD1) shown at the bottom. (F) Immunoblot analysis of lysates from M2 BMDMs immunoprecipitated for active GTP-bound form of RAC1/CDC42 and visualized with anti-CDC42 or anti-RAC1 antibodies (left). Immunoblots of M2 lysates with anti-phospho-PAK1 and anti-phospho-AKT on the right. Quantification of band intensities summarizes n = 3 independent experiments. (G) Quantification of RAB7 immunofluorescence in M2 BMDMs treated with RP-182 and preincubated with ZCL278 (left) or NSC23766 (right). Data shown are representative of two independent experiments and normalized to corresponding vehicle treatment unless indicated otherwise. (H) LC3 and cleaved caspase 8 quantification in M2 macrophages preincubated with chloroquine and bafilomycin; n = 2 in triplicate. (I) Quantification of phagocytosis (RAB7) and cleaved caspase 8 in M2 BMDMs in the presence of NF-κB inhibitors JSH23 and QNZ; n = 2 in triplicate.
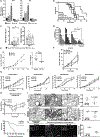
Fig. 5.. Infiltration of CD206high TAMs is associated with clinical outcome and intratumoral immunity.
(A) Immunohistochemical staining of CD206 in CD206high and CD206low pancreatic ductal adenocarcinoma (PDAC) [scale bars, 10 μm (insets)]. (B) Kaplan-Meier plots of overall survival of 125 patients with PDAC stratified by CD206 expression. Log-rank test. (C) Kaplan-Meier analysis of patients with CD206high TAMs stratified by CD8high versus CD8low. (D) Correlation of CD8A, IFNG expression, eight and six gene CD8 T cell activation signatures (bottom), and M2 marker expression in clinical specimens from TCGA cancer dataset. Samples across all cancers were divided into CD206high and CD86low using median of all specimens. (E) Correlation of macrophage subtypes and CD8+ T cell function in pancreatic cancer TCGA dataset. (F) Kaplan-Meier analysis of KPC tumors allografted in CD206−/− B6.129P2-Mrc1 tm1Mnz/J mice (blue curve) and in C57B/L wild-type mice (red curve). Log-rank test, two tailed. (G) Immunohistochemical staining of KPC wild-type (KPC) and KPC tumors generated in CD206−/− B6.129P2-Mrc1 tm1Mnz/J mice (KPC CD206 KO−/−), quantification on right (n ≥ 4 per group). (H) Quantification of flow cytometry of TAM subpopulations in KPC tumors grown in C57B/L6 wild-type and CD206−/− mice (n ≥ 5 per group).
Fig. 6.. RP-182 exerts antitumor activity and improves tumor immunogenicity.
(A) Kaplan Meier analysis of KP16 mice. Log-rank test, two-tailed. (B) Waterfall plot of best objective response in KP16 mice. (C) Kaplan-Meier analysis of KPC mice. (D) Waterfall plot of best objective response in KPC mice. (E) Images of immunohistochemical stains of tumors from KP16 mice treated with vehicle or RP1–82. Quantification depicts mean percent positive cells by computer-based tissue analysis of n = 4 per group. Arrows indicate membranous staining of CD206-positive cells or CD8+ T cells. (F) Immunohistochemical staining of E-cadherin and vimentin, quantification of n ≥ 4 per group on right. (G) Percentages of CD206-positive M2 macrophage, MDSC, dendritic, CD8-, and CD4-positive cell fractions of total cells in KP16 tumors treated for 7 days. Percentages of FoxP3-positive Tregs of CD4+ T cells shown on the right. (H) IFN-γ-positive T cells after addition of TAMs isolated from KP16 and KPC tumors to cocultured cancer and splenic CD8+ T cells from tumor-bearing mice. (I) Quantification of quantitative reverse transcription PCR analysis of M1 and M2 gene expression of TAMs isolated from KPC and KP16 tumors (n ≥ 3 per group in triplicate). (J) Quantification of CD11b+F4/80+/Gr1− TAM fractions expressing M1 cytokines and immune checkpoints is shown. (K) Quantification of cleaved caspase 3, RAB7, and LAMP1-positive CD11b+F4/80+Gr1− TAM fractions by flow cytometry in KPC tumors of vehicle and RP-182-treated mice (n ≥ 5 mice per group). (L) _t_-distributed stochastic neighbor embedding (_t_-SNE) plots after tumor single-cell sequencing of CD11b+and filtering out KRT19+, CD11c+, Ly6G+ cells (n = 4 per group) of vehicle- (light blue) versus RP-182-treated (dark blue) tumors; color bar indicates log10[molecules per cell]. Increased expression of RP-182-induced DEGs identified in M2 BMDMs in vitro (“in vitro gene M2 signature”) was projected onto CD11b+KRT19−CD11c−Ly6G− cluster from RP-182-treated tumors (right), color bar indicates log10(sum of in vitro gene expression changes). (M) Images of immunofluorescence of KP16 tumors treated with RP-182 (top) and vehicle (bottom) costained with anti-CD206 (red) and anti-LC3 (green), computer-based quantification of costaining cells (of total cells, n = 4 per group). Insets show representative images of cells scored as costaining for CD206 and LC3 (1A, 2A), and cells scored as LC3 (2B) and CD206 (2C) positive. (N) Tumor growth after intratumoral cell transfer of M2 BMDMs into KPC allografts (n = 5).
Fig. 7.. RP-182 increases antitumor activity of CD8+ T cells and inhibits tumor growth in CD206high patient-derived pancreatic cancer xenografts.
(A) Quantification of enzyme-linked immune absorbent spots (ELISpots) (IFN-γ-secreting CD8+ T cells of added total CD8+ T cells) after coculture of KP16 (left) and KPC cancer cells (right) and CD8+ T cells isolated from tumors and spleens. (B) Kaplan-Meier analysis of KP16 mice treated with anti-CD8 neutralizing antibody, anti-IgG2 isotype control, and indicated combinations. (C) Quantification of flow cytometry analysis of CD45−CK19+ cancer cells expressing PD-L1 (left) and PD-1 expression on CD45+CD3e+CD8+ T cells (right) in KP16 tumors. (D) Best objective response (BOR) of KP16 tumors treated with vehicle (gray bars), anti-PD-L1 injections (purple), RP-182 (red), and anti-PD-L1 in combination with RP-182; n ≥ 7 animals per group. E. Tumor growth of CT-26 allografts, tumor weights at study endpoint shown on right. (F) Tumor growth of murine B16 melanoma. (G) Pancreatic cancer patient-derived xenotransplantation models that are CD206high (#133R, #328R) or CD206low (#295R, #057R) treated with RP-182, RP-426, or vehicle control; n ≥ 7 per group. (H) RP-182 administration rescues mice with chemically induced pulmonary fibrosis. Quantification of total body weights (in grams; top) and Kaplan-Meier survival analysis, error bars indicate SDs. (I) Pulmonary inflammatory infiltrates after bleomycin instillation. Images of H&E stains, quantification of measured weights of excised lungs on right; n = 4 per group. Scale bars, 50 μm. (J) Images of Masson’s trichrome staining, quantification of percent fibrosis positive area of 100 mm2 examined lung surface on right. Scale bars, 50 μm. (K) Reduction of CD206-positive alveolar cell infiltrate in RP-182-treated mice. Immunofluorescence lung field images of noninstilled and bleomycin-instilled mice treated with vehicle or RP-182 stained with DAPI and anti-CD206 (green). Scale bars, 100 μm. Red arrows in insets indicate CD206-positive cells. Quantification of number of CD206-positive cells shown on right, n = 4 per group.
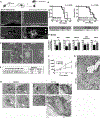
Fig. 8.. RP-182 increases cancer cell phagocytosis.
(A) Immunofluorescence images of KPC tumors treated with biotinylated RP-182 (bio-RP-182) and costained with anti-CD206 (green), streptavidin phycoerythrin (PE) (red), and DAPI (blue). Laser intensity profiles (upper right of linear scanning of random tissue section measuring intensity (fluorescence intensity, y axis) versus distance (in micrometers; x axis). Colocalization of CD206-expressing cells (green) and bio-RP-182 (red channel) (lower right) generating yellow/purple emission. (B) Kaplan-Meier analysis of KPC wild-type (left) and KPC CD206 KO−/− allografts (right) treated with vehicle (black) or RP-182 (red). (C) Phase-contrast images of M2 BMDMs incubated with carboxyfluorescein succinimidyl ester (CFSE)-labeled cancer cells (green). Inset shows a representative macrophage with engulfed green-labeled cancer cell and induced cytoplasmatic vacuoles and vesicles. (D) Quantification of the number of CFSE-positive macrophages of total number of M2 BMDMs (in %, phagocytic index). (E) CFSE-positive fractions in CD11b+F4/80+Gr1−CD86+ and CD206+ BMDMs by flow cytometry after coculture of CFSE-labeled KPC cancer cells and treatment with vehicle or RP-182. (F) Tumor growth of KPC xenografts (n ≥ 7 per group). (G) H&E images of KP16 tumors treated with vehicle (top) and RP-182 (bottom). Arrows indicate ballooned, vesicle-filled macrophages with peripheral nuclei, and asterisks indicate ingested cellular debris. Scale bar, 10 μm. (H) Transmission electron microscopy of KP16 tumors treated with vehicle or RP-182. TAMs with intracellular vesicles are indicated by arrows, and clasping of cancer cell and partial or complete cancer cell phagocytosis events are highlighted by solid red lines. Inset (dashed line) shows complete engulfment of cancer cell by TAM. Scale bars, 1 μm.
Comment in
- Tapping the therapeutic potential of the innate immune system.
Paiva SL. Paiva SL. Nat Rev Drug Discov. 2020 Apr;19(4):236. doi: 10.1038/d41573-020-00040-0. Nat Rev Drug Discov. 2020. PMID: 32157208 No abstract available.
Similar articles
- Drug-free mannosylated liposomes inhibit tumor growth by promoting the polarization of tumor-associated macrophages.
Ye J, Yang Y, Dong W, Gao Y, Meng Y, Wang H, Li L, Jin J, Ji M, Xia X, Chen X, Jin Y, Liu Y. Ye J, et al. Int J Nanomedicine. 2019 May 2;14:3203-3220. doi: 10.2147/IJN.S207589. eCollection 2019. Int J Nanomedicine. 2019. PMID: 31118632 Free PMC article. - Targeting Pro-Tumoral Macrophages in Early Primary and Metastatic Breast Tumors with the CD206-Binding mUNO Peptide.
Lepland A, Asciutto EK, Malfanti A, Simón-Gracia L, Sidorenko V, Vicent MJ, Teesalu T, Scodeller P. Lepland A, et al. Mol Pharm. 2020 Jul 6;17(7):2518-2531. doi: 10.1021/acs.molpharmaceut.0c00226. Epub 2020 Jun 1. Mol Pharm. 2020. PMID: 32421341 - M1hot tumor-associated macrophages boost tissue-resident memory T cells infiltration and survival in human lung cancer.
Garrido-Martin EM, Mellows TWP, Clarke J, Ganesan AP, Wood O, Cazaly A, Seumois G, Chee SJ, Alzetani A, King EV, Hedrick CC, Thomas G, Friedmann PS, Ottensmeier CH, Vijayanand P, Sanchez-Elsner T. Garrido-Martin EM, et al. J Immunother Cancer. 2020 Jul;8(2):e000778. doi: 10.1136/jitc-2020-000778. J Immunother Cancer. 2020. PMID: 32699181 Free PMC article. - Exploiting Manipulated Small Extracellular Vesicles to Subvert Immunosuppression at the Tumor Microenvironment through Mannose Receptor/CD206 Targeting.
Fiani ML, Barreca V, Sargiacomo M, Ferrantelli F, Manfredi F, Federico M. Fiani ML, et al. Int J Mol Sci. 2020 Aug 31;21(17):6318. doi: 10.3390/ijms21176318. Int J Mol Sci. 2020. PMID: 32878276 Free PMC article. Review. - Role of the mannose receptor in the immune response.
Apostolopoulos V, McKenzie IF. Apostolopoulos V, et al. Curr Mol Med. 2001 Sep;1(4):469-74. doi: 10.2174/1566524013363645. Curr Mol Med. 2001. PMID: 11899091 Review.
Cited by
- Molecular and pathological subtypes related to prostate cancer disparities and disease outcomes in African American and European American patients.
Mori JO, White J, Elhussin I, Duduyemi BM, Karanam B, Yates C, Wang H. Mori JO, et al. Front Oncol. 2022 Aug 10;12:928357. doi: 10.3389/fonc.2022.928357. eCollection 2022. Front Oncol. 2022. PMID: 36033462 Free PMC article. - BP1003 Decreases STAT3 Expression and Its Pro-Tumorigenic Functions in Solid Tumors and the Tumor Microenvironment.
Gagliardi M, Kean R, Dai B, Augustine JJ, Roberts M, Fleming J, Hooper DC, Ashizawa AT. Gagliardi M, et al. Biomedicines. 2024 Aug 20;12(8):1901. doi: 10.3390/biomedicines12081901. Biomedicines. 2024. PMID: 39200368 Free PMC article. - TAM-targeted reeducation for enhanced cancer immunotherapy: Mechanism and recent progress.
Shen X, Zhou S, Yang Y, Hong T, Xiang Z, Zhao J, Zhu C, Zeng L, Zhang L. Shen X, et al. Front Oncol. 2022 Nov 7;12:1034842. doi: 10.3389/fonc.2022.1034842. eCollection 2022. Front Oncol. 2022. PMID: 36419877 Free PMC article. Review. - Harnessing the Electrochemical Effects of Electroporation-Based Therapies to Enhance Anti-tumor Immune Responses.
Salameh ZS, Aycock KN, Alinezhadbalalami N, Imran KM, McKillop IH, Allen IC, Davalos RV. Salameh ZS, et al. Ann Biomed Eng. 2024 Jan;52(1):48-56. doi: 10.1007/s10439-023-03403-x. Epub 2023 Nov 21. Ann Biomed Eng. 2024. PMID: 37989902 Free PMC article. - Mannosylated-serum albumin nanoparticle imaging to monitor tumor-associated macrophages under anti-PD1 treatment.
Gu GJ, Chung H, Park JY, Yoo R, Im HJ, Choi H, Lee YS, Seok SH. Gu GJ, et al. J Nanobiotechnology. 2023 Jan 27;21(1):31. doi: 10.1186/s12951-023-01791-9. J Nanobiotechnology. 2023. PMID: 36707872 Free PMC article.
References
- Hanahan D, Coussens LM, Accessories to the crime: Functions of cells recruited to the tumor microenvironment. Cancer Cell 21, 309–322 (2012). - PubMed
Publication types
MeSH terms
Substances
Grants and funding
- ZIA BC011267/ImNIH/Intramural NIH HHS/United States
- U54 MD007585/MD/NIMHD NIH HHS/United States
- ZIA TR000302/ImNIH/Intramural NIH HHS/United States
- U54 CA118623/CA/NCI NIH HHS/United States
- P30 CA006973/CA/NCI NIH HHS/United States
LinkOut - more resources
Full Text Sources
Other Literature Sources
Miscellaneous
