CLR01 protects dopaminergic neurons in vitro and in mouse models of Parkinson's disease - PubMed (original) (raw)
. 2020 Sep 28;11(1):4885.
doi: 10.1038/s41467-020-18689-x.
Emilie Faggiani 2 3, Paula Ramos-Gonzalez 4, Ecem Kirkiz 1, Natalie Connor-Robson 1, Liam V Brown 5, Ibrar Siddique 6, Zizheng Li 6, Siv Vingill 1, Milena Cioroch 1, Fabio Cavaliere 4, Sarah Threlfell 1, Bradley Roberts 1, Thomas Schrader 7, Frank-Gerrit Klärner 7, Stephanie Cragg 1, Benjamin Dehay 2 3, Gal Bitan 6, Carlos Matute 4, Erwan Bezard 2 3, Richard Wade-Martins 8
Affiliations
- PMID: 32985503
- PMCID: PMC7522721
- DOI: 10.1038/s41467-020-18689-x
CLR01 protects dopaminergic neurons in vitro and in mouse models of Parkinson's disease
Nora Bengoa-Vergniory et al. Nat Commun. 2020.
Abstract
Parkinson's disease (PD) affects millions of patients worldwide and is characterized by alpha-synuclein aggregation in dopamine neurons. Molecular tweezers have shown high potential as anti-aggregation agents targeting positively charged residues of proteins undergoing amyloidogenic processes. Here we report that the molecular tweezer CLR01 decreased aggregation and toxicity in induced pluripotent stem cell-derived dopaminergic cultures treated with PD brain protein extracts. In microfluidic devices CLR01 reduced alpha-synuclein aggregation in cell somas when axonal terminals were exposed to alpha-synuclein oligomers. We then tested CLR01 in vivo in a humanized alpha-synuclein overexpressing mouse model; mice treated at 12 months of age when motor defects are mild exhibited an improvement in motor defects and a decreased oligomeric alpha-synuclein burden. Finally, CLR01 reduced alpha-synuclein-associated pathology in mice injected with alpha-synuclein aggregates into the striatum or substantia nigra. Taken together, these results highlight CLR01 as a disease-modifying therapy for PD and support further clinical investigation.
Conflict of interest statement
The chemical composition of CLR01 is protected by International Patent No. PCT/US2010/026419, USA patent No. 8,791,092, and European patent No. EP2403859 A2.
Figures
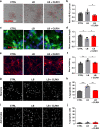
Fig. 1. CLR01 reduces α-syn aggregation and toxicity in iPSC-derived dopaminergic and primary rat cortical cultures.
a, c, e Representative brightfield and immunofluorescent images of live and dead cells (labeled by To-pro), dopaminergic cells (TH-positive), AS-PLA (red puncta), and neuronal processes of four independent control cell lines analyzed. Cells were treated with LB extracts, which had been pretreated with CLR01 or PBS as a negative control. LB treatment caused an abnormal deposition of material in treated wells, accompanied by increased AS-PLA signal process degeneration, which were reduced by CLR01 pre-treatment. Scale bars = 100, 25, 25 µm, respectively. b, d, f Quantification of indicated parameters (from c and e) of four independent control cell lines analyzed using a one-way ANOVA (Sidak’s). b F(2, 9) = 5.154, p = 0.0213. d F(2, 9) = 7.309, p = 0.0112, p = 0.0356. f F(2, 9) = 10.67, p = 0.0038, p = 0.0126. g, i Representative images of neuronal (top) and astrocytic (bottom) primary rat cultures stained with DAPI (n = 3 independent cultures and treatments). Scale bars 20 µm. h, j Quantification of apoptotic cells (expressed as % from total) analyzed using a one-way ANOVA (Sidak’s, n = 3 independent cultures and treatments). k F(2, 6) = 35.09, p = 0.0005, p = 0.0012. *p < 0.05, **p < 0.01, ***p < 0.001. For all appropriate panels, data are presented as mean values ± SEM. BF brightfield, Norm normalized.
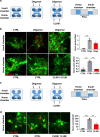
Fig. 2. CLR01 prevents α-syn aggregation in microfluidic chambers.
a, c Schematic representation of the experimental design for the microfluidic-chamber experiments. b, d Representative immunofluorescence images of dopaminergic neurons grown in the microfluidic devices insulted with oligomers and/or treated with CLR01 for 5 days (25 µg/ml and/or 10 µM, respectively). Images were taken at least one field of view away from the microgrooves to avoid artifacts due to contact with the silicone. Scale bars = 25 µm. Quantification of normalized puncta per field of three independent control cell lines analyzed using a one-way ANOVA (Tukey). Oligo: oligomer. b F(2, 6) = 24.31, p = 0.0009 and F(2, 6) = 39.09, p = 0.0005, p = 0.0006. d F(2, 6) = 71.45. *p < 0.05, **p < 0.01, ***p < 0.001. For all appropriate panels, data are presented as mean values ± SEM.
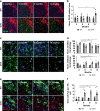
Fig. 3. Glial activation and α-syn aggregation in SNCA-OVX mice.
a, c, e Representative images of immunofluorescence of GFAP (astrocytes), IBA1 (microglia), and AS-PLA in dopaminergic neurons, respectively. Scale bars = 200, 25, and 25 µm, respectively. b, d, f Quantification of normalized stained area, morphology (expressed as a % from total), and puncta per TH+ cell analyzed using a two-way ANOVA (Dunnett’s for age and Sidak’s for genotype, for age all values compared to 3 months), n = 3–4 animals per group. b F(3, 20) = 1.211, p = 0.0177 for age and F(1, 20) = 0.1572, p = 0.0106 for genotype. d F(1, 22) = 2.216, p = 0.0287 for genotype and F(3, 22) = 1.764, p = 0.0209, p = 0.0104, p = 0.0192 for age. f F(3, 21) = 4.528 for age, p = 0.0058, p = 0.0016, p = 0.0024 and F(1, 21) = 33.41, p = 0.0043, p = 0.0015, p = 0.0061 for genotype. *p < 0.05. For all appropriate panels, data are presented as mean values ± SEM. OVX: _SNCA_-OVX.
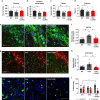
Fig. 4. CLR01 restores motor behavior and reduces early pathology in vivo at 12 months of age.
a–d Behavior analysis of rotarod (a) and catwalk gait analysis (b–d) after 2 months of subcutaneous administration of 40 µg/kg/day drug or PBS analyzed using a one-way ANOVA (Sidak), n = 11–14 animals per group. e, f Representative images and quantification of AS-PLA puncta per TH+ cell. Scale bars = 25 µm. g–j Representative images and quantification of GFAP-stained area per field and microglial morphology (expressed as a % from total). Scale bars = 100 and 50 µm, respectively. a–j were analyzed using one-way ANOVA (Holm–Sidak), e–j n = 8/8. CLR: CLR01 *p < 0.05, **p < 0.01. a F(2, 35) = 4.138, p = 0.0376, p = 0.0205. b F(2, 37) = 4.000, p = 0.0058. c F(2, 38) = 4.884, p = 0.0078, p = 0.0451. d F(2, 38) = 3.982, p = 0.0151. f F(2, 19) = 6.057, p = 0.0072, p = 0.0338. h F(2, 21) = 8.797, p = 0.0091, p = 0.0012. j F(2, 23) = 4.750, p = 0.0106. For all appropriate panels, data are presented as mean values ± SEM.
Fig. 5. CLR01 reduces α-syn aggregation in vivo at 18 months of age.
a–e Representative images and quantification of AS-PLA puncta per TH+, GFAP+, and Iba1+ cells after osmotic mini-pump implantation of 40 µg/kg/days CLR01 or PBS, analyzed using a two-tailed _t_-test, n = 3/4 independent animals. Scale bars = 50 µm. c p = 0.0117, d p = 0.0319, e p = 0.0179. f, g Western blottings of PGC1α and Lamp2a, analyzed using a one-tailed Mann–Whitney _U_-test, n = 3–4 independent animals. f p = 0.0286, g p = 0.0286. h, i Native western blottings of Triton X-100 and SDS-soluble α-syn, analyzed using a one-tailed Mann–Whitney _U_-test, n = 3–4 independent animals. i p = 0.0286. *p < 0.05. AV average, CLR CLR01. For all appropriate panels, data are presented as mean values ± SEM.
Fig. 6. CLR01 protects dopaminergic neurons from LB-induced cell death through reduction of α-syn aggregation in mice.
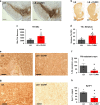
a, b Representative photomicrographs of TH-immunostained SNc and striatum (respectively) in LB-inoculated mice after osmotic mini-pump implantation for CLR01 (or PBS) delivery (40 µg/kg/h). c Stereological cell counts of SNc TH-immunoreactive neurons (a) in LB-inoculated mice, at 3 months post-LB inoculation. p = 0.0177. d Optical densitometry of striatal TH immunoreactivity in LB-inoculated mice (b), at 3 months post-LB inoculation. p = 0.0354. e, g Representative photomicrographs of α-syn and PK-resistant α-syn immunostained SN from LB-inoculated mice, and corresponding quantification. f, h Representative images of Syn-F1 immunostaining in the SN in LB-inoculated mice and corresponding quantification of the intensity levels of Syn-F1 staining. f p = 0.0333, h p = 0.0556. a–h n = 4–5 for LB-inoculated mice, n = 5–7 for LB + CLR01-independently treated animals, analyzed with a two-tailed Mann–Whitney _U_-test. *p < 0.05. Scale bars = 0.1 mm (SN) and 1 mm (Str). For all appropriate panels, data are presented as mean values ± SEM.
Similar articles
- A Molecular Tweezer Ameliorates Motor Deficits in Mice Overexpressing α-Synuclein.
Richter F, Subramaniam SR, Magen I, Lee P, Hayes J, Attar A, Zhu C, Franich NR, Bove N, De La Rosa K, Kwong J, Klärner FG, Schrader T, Chesselet MF, Bitan G. Richter F, et al. Neurotherapeutics. 2017 Oct;14(4):1107-1119. doi: 10.1007/s13311-017-0544-9. Neurotherapeutics. 2017. PMID: 28585223 Free PMC article. - The molecular tweezer CLR01 reduces aggregated, pathologic, and seeding-competent α-synuclein in experimental multiple system atrophy.
Herrera-Vaquero M, Bouquio D, Kallab M, Biggs K, Nair G, Ochoa J, Heras-Garvin A, Heid C, Hadrovic I, Poewe W, Wenning GK, Klärner FG, Schrader T, Bitan G, Stefanova N. Herrera-Vaquero M, et al. Biochim Biophys Acta Mol Basis Dis. 2019 Nov 1;1865(11):165513. doi: 10.1016/j.bbadis.2019.07.007. Epub 2019 Jul 16. Biochim Biophys Acta Mol Basis Dis. 2019. PMID: 31319154 Free PMC article. - Depopulation of dense α-synuclein aggregates is associated with rescue of dopamine neuron dysfunction and death in a new Parkinson's disease model.
Wegrzynowicz M, Bar-On D, Calo' L, Anichtchik O, Iovino M, Xia J, Ryazanov S, Leonov A, Giese A, Dalley JW, Griesinger C, Ashery U, Spillantini MG. Wegrzynowicz M, et al. Acta Neuropathol. 2019 Oct;138(4):575-595. doi: 10.1007/s00401-019-02023-x. Epub 2019 May 31. Acta Neuropathol. 2019. PMID: 31165254 Free PMC article. - The Overcrowded Crossroads: Mitochondria, Alpha-Synuclein, and the Endo-Lysosomal System Interaction in Parkinson's Disease.
Lin KJ, Lin KL, Chen SD, Liou CW, Chuang YC, Lin HY, Lin TK. Lin KJ, et al. Int J Mol Sci. 2019 Oct 25;20(21):5312. doi: 10.3390/ijms20215312. Int J Mol Sci. 2019. PMID: 31731450 Free PMC article. Review. - Initiation and propagation of α-synuclein aggregation in the nervous system.
Hijaz BA, Volpicelli-Daley LA. Hijaz BA, et al. Mol Neurodegener. 2020 Mar 6;15(1):19. doi: 10.1186/s13024-020-00368-6. Mol Neurodegener. 2020. PMID: 32143659 Free PMC article. Review.
Cited by
- Alpha-Synuclein Targeting Therapeutics for Parkinson's Disease and Related Synucleinopathies.
Menon S, Armstrong S, Hamzeh A, Visanji NP, Sardi SP, Tandon A. Menon S, et al. Front Neurol. 2022 May 9;13:852003. doi: 10.3389/fneur.2022.852003. eCollection 2022. Front Neurol. 2022. PMID: 35614915 Free PMC article. Review. - The molecular tweezer CLR01 improves behavioral deficits and reduces tau pathology in P301S-tau transgenic mice.
Di J, Siddique I, Li Z, Malki G, Hornung S, Dutta S, Hurst I, Ishaaya E, Wang A, Tu S, Boghos A, Ericsson I, Klärner FG, Schrader T, Bitan G. Di J, et al. Alzheimers Res Ther. 2021 Jan 4;13(1):6. doi: 10.1186/s13195-020-00743-x. Alzheimers Res Ther. 2021. PMID: 33397489 Free PMC article. - Precision Medicine in Parkinson's Disease: From Genetic Risk Signals to Personalized Therapy.
Straccia G, Colucci F, Eleopra R, Cilia R. Straccia G, et al. Brain Sci. 2022 Sep 28;12(10):1308. doi: 10.3390/brainsci12101308. Brain Sci. 2022. PMID: 36291241 Free PMC article. Review. - Recent Advances in Clinical Trials in Multiple System Atrophy.
Bendetowicz D, Fabbri M, Sirna F, Fernagut PO, Foubert-Samier A, Saulnier T, Le Traon AP, Proust-Lima C, Rascol O, Meissner WG. Bendetowicz D, et al. Curr Neurol Neurosci Rep. 2024 Apr;24(4):95-112. doi: 10.1007/s11910-024-01335-0. Epub 2024 Feb 28. Curr Neurol Neurosci Rep. 2024. PMID: 38416311 Review. - Grafts Derived from an α-Synuclein Triplication Patient Mediate Functional Recovery but Develop Disease-Associated Pathology in the 6-OHDA Model of Parkinson's Disease.
Shrigley S, Nilsson F, Mattsson B, Fiorenzano A, Mudannayake J, Bruzelius A, Ottosson DR, Björklund A, Hoban DB, Parmar M. Shrigley S, et al. J Parkinsons Dis. 2021;11(2):515-528. doi: 10.3233/JPD-202366. J Parkinsons Dis. 2021. PMID: 33361611 Free PMC article.
References
- Braak H, et al. Staging of brain pathology related to sporadic Parkinson’s disease. Neurobiol. Aging. 2003;24:197–211. - PubMed
Publication types
MeSH terms
Substances
Grants and funding
- MR/N029453/1/MRC_/Medical Research Council/United Kingdom
- G0700932/MRC_/Medical Research Council/United Kingdom
- G-1504/PUK_/Parkinson's UK/United Kingdom
- R01 AG050721/AG/NIA NIH HHS/United States
- H-1003/PUK_/Parkinson's UK/United Kingdom
- MR/L023784/1/MRC_/Medical Research Council/United Kingdom
- G-0803/PUK_/Parkinson's UK/United Kingdom
- MR/L023784/2/MRC_/Medical Research Council/United Kingdom
- G-1103/PUK_/Parkinson's UK/United Kingdom
- MR/J004324/1/MRC_/Medical Research Council/United Kingdom
- J-0901/PUK_/Parkinson's UK/United Kingdom
- G-1305/PUK_/Parkinson's UK/United Kingdom
- G-0808/PUK_/Parkinson's UK/United Kingdom
- MR/K013866/1/MRC_/Medical Research Council/United Kingdom
- MC_EX_MR/N50192X/1/MRC_/Medical Research Council/United Kingdom
- MR/M024962/1/MRC_/Medical Research Council/United Kingdom
- MR/P007058/1/MRC_/Medical Research Council/United Kingdom
LinkOut - more resources
Full Text Sources
Medical
Molecular Biology Databases
