Transcriptional suppression of ribosomal DNA with phase separation - PubMed (original) (raw)
Transcriptional suppression of ribosomal DNA with phase separation
Satoru Ide et al. Sci Adv. 2020.
Abstract
The nucleolus is a nuclear body with multiphase liquid droplets for ribosomal RNA (rRNA) transcription. How rRNA transcription is regulated in the droplets remains unclear. Here, using single-molecule tracking of RNA polymerase I (Pol I) and chromatin-bound upstream binding factor (UBF), we reveal suppression of transcription with phase separation. For transcription, active Pol I formed small clusters/condensates that constrained rDNA chromatin in the nucleolus fibrillar center (FC). Treatment with a transcription inhibitor induced Pol I to dissociate from rDNA chromatin and to move like a liquid within the nucleolar cap that transformed from the FC. Expression of a Pol I mutant associated with a craniofacial disorder inhibited transcription by competing with wild-type Pol I clusters and transforming the FC into the nucleolar cap. The cap droplet excluded an initiation factor, ensuring robust silencing. Our findings suggest a mechanism of rRNA transcription suppression via phase separation of intranucleolar molecules governed by Pol I.
Copyright © 2020 The Authors, some rights reserved; exclusive licensee American Association for the Advancement of Science. No claim to original U.S. Government Works. Distributed under a Creative Commons Attribution NonCommercial License 4.0 (CC BY-NC).
Figures
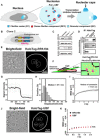
Fig. 1. Generation of cell lines expressing HaloTag-RPA194 or HaloTag-UBF and single-molecule imaging of HaloTag-RPA194 and HaloTag-UBF.
(A) Diagram of nucleolar reorganization in response to transcription inhibition. (B) Genome-edited HeLa cell line used for labeling Pol I molecules. (C) Immunoblotting of the parental HeLa cells, clones 1 (monoallelic tagging) and 2 (biallelic tagging) cell lysates with antibodies of RPA194, HaloTag, and β-actin. Asterisks indicate the position of HaloTag-RPA194. (D) Coimmunoprecipitation of RPA194-RPA135 in the Pol I complex from the clone 2 cell lysate. (E) Bright-field cell nucleus image (left) and oblique illumination microscopy image of HaloTag-RPA194 molecules (right) in a live HeLa cell. The nucleus and nucleolar area are indicated by white and dashed lines, respectively. (F) Left: Diagram of oblique illumination. Right: Sparse fluorescence labeling (red). (G) Single-step photobleaching of HaloTag-RPA194 dots. The vertical and horizontal axes represent the fluorescence intensities of the HaloTag-RPA194 dots and the tracking time series (the photobleaching point is set as time = 0; n = 35 cells), respectively. (H) Displacement (movement) distribution of HaloTag-RPA194 over 50 ms (n = 24 cells). (I) MSD plots of HaloTag-RPA194 molecules from 0.05 to 5 s (n = 24 cells). The data were fitted to a subdiffusive curve (gray line). Error bars indicate the 95% CI computed via bootstrap resampling. (J) Localization of TMR-HaloTag-UBF in the nucleolus. (K) MSD plots of HaloTag-UBF (red, n = 24 cells) and HaloTag-RPA194 (black, n = 24 cells) molecules with 95% CIs. N.S., not significant; P = 0.34 via bootstrapping for HaloTag-UBF versus HaloTag-RPA194.
Fig. 2. Dynamics of Pol I and UBF with and without transcription inhibitor.
(A) 47S pre-rRNA levels in the cells treated with (right) or without (left) CX-5461. Error bars represent the SD calculated from four to five independent experiments. ***P < 0.001, two-sided unpaired Student’s t test. (B) Localizations of fluorescently labeled HaloTag-RPA194 in clone 2 HeLa cells with (right) or without (left) CX-5461. (C) Top: Three representative trajectories of HaloTag-RPA194 dots in untreated (left column) and CX-5461-treated (right column) cells over 2 s. Bottom: Displacement distributions of HaloTag-RPA194 molecules over 2 s in CX-5461–treated (pink) and untreated control (blue) cells. Significant differences were determined using the Wilcoxon rank sum test (P < 0.01). (D) MSD plots of HaloTag-RPA194 molecules without (green, n = 24 cells) and with CX-5461 treatment (red, n = 23 cells) and HaloTag-UBF molecules without (black, n = 29 cells) and with CX-5461 treatment (blue, n = 29 cells) with 95% CIs. ***P < 0.0001 via bootstrapping for HaloTag-RPA194 in untreated control versus CX-5461–treated cells (P = 1.0 × 10⁻⁶) and ***P < 0.001 via bootstrapping for HaloTag-UBF in untreated control versus CX-5461–treated cells (P = 2.2 × 10⁻⁴). (E) D distributions of PAmCherry-RPA194 in untreated control (left, n = 20 cells) and CX-5461–treated cells (right, n = 20 cells) with a logarithmic scale. The D distributions of untreated control and CX-5461 treatment were fitted with a mixture of two slow (red) and fast (blue) Gaussian distributions and a single Gaussian distribution (green), respectively. (F) Summary table of the D of PAmCherry-RPA194. _D_S is the diffusion coefficient of the slow fraction, and _D_F is that of the fast fraction in untreated cells. (G) Fitting of the MSD of PAmCherry-RPA194 to a subdiffusion (top) or free-diffusion model (bottom). The AIC (48) for each fit is shown.
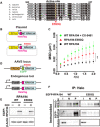
Fig. 3. Mutant Pol I with an RPA194 variant (RPA194-E593Q) that causes a craniofacial disorder.
(A) Amino acid sequence comparison of RPA194 including the active site for Mg2+ binding among Homo sapiens, Mus musculus, Danio rerio, Xenopus laevis, Drosophila melanogaster, Saccharomyces cerevisiae, and Escherichia coli. In the RPA194 variant from the patient, the conserved glutamic acid residue (E) at position 593 (highlighted orange) was substituted with glutamine (Q). (B) Diagram of plasmids expressing HaloTag-WT RPA194 and HaloTag-RPA194-E593Q used for single-molecule imaging. (C) MSD plots of HaloTag-RPA194 molecules after expressing HaloTag-RPA194 (WT, black, n = 18 cells) or HaloTag-RPA194-E593Q (E593Q, red, n = 17 cells), with 95% CIs. For comparison, MSD data for WT HaloTag-RPA194 with CX-5461 treatment are reproduced from Fig. 2D (red). **P < 0.01 via bootstrapping for the WT RPA194 versus RPA194-E593Q (P = 5.2 × 10⁻³). (D) Diagram of the clone 2 cell line (Fig. 1B) expressing EGFP-RPA194-E593Q (or EGFP-RPA194) from an exogenous AAVS locus. (E) Expression of EGFP-RPA194-E593Q induced by doxycycline (DOX; 2 μg/ml) for 24 hours. (F) Coimmunoprecipitation of endogenous HaloTag-RPA194 with EGFP-RPA194 or EGFP-RPA194-E593Q. I, input; N, negative control precipitant (HaloTag-ligand minus); P, precipitant (HaloTag-ligand plus).
Fig. 4. Expression of mutant Pol I with RPA194-E593Q induces nucleolar cap structure formation.
(A) Localizations of HaloTag-RPA194 (magenta) and conditionally expressed EGFP-RPA194 (top, green) or EGFP-RPA194-E593Q (bottom, green) in cells fixed with formaldehyde. Note that HaloTag-RPA194 was fluorescently labeled with an excess amount of the HaloTag ligand TMR. (B) Time-lapse images of RPA194 foci in a cell expressing HaloTag-RPA194 (magenta) and EGFP-RPA194-E593Q (green). HaloTag-RPA194 was fluorescently labeled with an excess amount of the HaloTag ligand TMR. Left: Nucleolar regions were identified using Hoechst 33342 DNA staining in the same live cell. Right: Enlarged time-lapse images of the boxed region on the left. Arrows indicate individual RPA194 foci fusing. (C) Live-cell images of the localization of EGFP-RPA194. (D) MSD plots of HaloTag-RPA194 molecules before (black) and after induction of EGFP-RPA194 (WT, red), or before (green) and after induction of EGFP-RPA194-E593Q (E593Q, blue) with 95% CIs. For each condition, n = 23 to 26 cells. ***P < 0.0001 via bootstrapping for WT expression (red) versus E593Q expression (blue) (P = 6.8 × 10⁻⁵) and no expression of E593Q (green) versus E593Q expression (blue) (P = 8.0 × 10⁻⁶). (E) D distribution of PAmCherry-RPA194-E593Q (n = 30 cells) with a logarithmic scale (for details, see Materials and Methods), which was fitted to a single Gaussian distribution (red). (F) MSD plots of HaloTag-UBF molecules before (black) and after induction of EGFP-RPA194 (blue) with 95% CIs. For each condition, n = 40 to 45 cells. For comparison, the MSD plot of HaloTag-RPA194-E593Q (red) was reproduced from Fig. 3C. ***P < 0.0001 via bootstrapping for UBF (black) versus UBF with RPA194-E593Q (blue) (P = 1.0 × 10⁻⁶). P = 0.29 for UBF with RPA194-E593Q versus RPA194-E593Q.
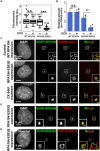
Fig. 5. Accumulation of RPA194-E593Q in the nucleolus inhibits rRNA transcription.
(A) rRNA synthesis was monitored by incorporating EU. Boxplot of fluorescence intensity of EU conjugated with Alexa Fluor 594 in cells before and after DOX induction of RPA194 (WT) or RPA194-E593Q (E593Q). Median values are indicated. ***P < 0.001, Wilcoxon rank sum test. (B) 47S pre-rRNA levels before and after DOX induction of RPA194 or RPA194-E593Q. Error bars represent SD calculated from three to five independent experiments. **P < 0.01, Student’s t test. (C) Localization of the TAF1A-HaloTag (red) in cells transiently expressing EGFP-WT RPA194 (first row) or EGFP-RPA194-E593Q (second row). Third row: WT RPA194 localization in a CX-5461–treated cell. Insets show enlarged images of regions indicated in the box. Scale bars, 1 μm. (D) Localization of RRN3 in cells expressing EGFP-RPA194-E593Q. Insets show enlarged images of the regions indicated in the box. Scale bar, 1 μm. (E) Localizations of the TAF1A-HaloTag and transiently expressed EGFP-RPA194-E593Q in a living HeLa cell. The merged image has line plots of measurements along the dotted line.
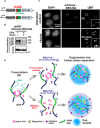
Fig. 6. Rapid depletion of Pol I and diagram of two distinct suppression mechanisms of rRNA transcription.
(A) Diagram of a genome-edited HCT116 line expressing mAID-mClover-RPA194 from the endogenous RPA194 gene locus. (B) Rapid Pol I degradation in HCT116 cells after auxin addition. (C) Localization of UBF in the cells before (first row, untreated control) and after rapid depletion of Pol I (second row, +auxin). Insets show enlarged images of the regions indicated with boxes. Scale bars, 1 μm. (D) Left: Active Pol I molecules form a stable cluster/condensate to transcribe rRNA genes (rDNA), constraining rDNA chromatin. Top: Once transcription is inhibited by a drug, the Pol I cluster/condensate detaches from chromatin, thus releasing the chromatin constraint. Pol I behaves like a liquid in the nucleolar cap through further phase separation. Bottom: Mutant Pol I stably binds to rDNA chromatin and inhibits WT Pol I cluster/condensate formation. The whole Pol I population becomes mobile in the nucleolar cap. An initiation factor is excluded from the cap, ensuring robust transcription suppression within the cap. Figure 6D consists of illustrations reproduced from figs. S3E, S4H, and S7A. Note that this model is highly simplified.
Similar articles
- Real-time imaging of RNA polymerase I activity in living human cells.
Fu Y, Liu Y, Wen T, Fang J, Chen Y, Zhou Z, Gu X, Wu H, Sheng J, Xu Z, Zou W, Chen B. Fu Y, et al. J Cell Biol. 2023 Jan 2;222(1):e202202110. doi: 10.1083/jcb.202202110. Epub 2022 Oct 25. J Cell Biol. 2023. PMID: 36282216 Free PMC article. - The rDNA is biomolecular condensate formed by polymer-polymer phase separation and is sequestered in the nucleolus by transcription and R-loops.
Lawrimore J, Kolbin D, Stanton J, Khan M, de Larminat SC, Lawrimore C, Yeh E, Bloom K. Lawrimore J, et al. Nucleic Acids Res. 2021 May 7;49(8):4586-4598. doi: 10.1093/nar/gkab229. Nucleic Acids Res. 2021. PMID: 33836082 Free PMC article. - Beyond rRNA: nucleolar transcription generates a complex network of RNAs with multiple roles in maintaining cellular homeostasis.
Feng S, Manley JL. Feng S, et al. Genes Dev. 2022 Aug 1;36(15-16):876-886. doi: 10.1101/gad.349969.122. Genes Dev. 2022. PMID: 36207140 Free PMC article. Review. - Tissue-selective effects of nucleolar stress and rDNA damage in developmental disorders.
Calo E, Gu B, Bowen ME, Aryan F, Zalc A, Liang J, Flynn RA, Swigut T, Chang HY, Attardi LD, Wysocka J. Calo E, et al. Nature. 2018 Feb 1;554(7690):112-117. doi: 10.1038/nature25449. Epub 2018 Jan 24. Nature. 2018. PMID: 29364875 Free PMC article. - Pseudo-NORs: a novel model for studying nucleoli.
Prieto JL, McStay B. Prieto JL, et al. Biochim Biophys Acta. 2008 Nov;1783(11):2116-23. doi: 10.1016/j.bbamcr.2008.07.004. Epub 2008 Jul 18. Biochim Biophys Acta. 2008. PMID: 18687368 Review.
Cited by
- Development of Highly Fluorogenic Styrene Probes for Visualizing RNA in Live Cells.
Kim MJ, Li Y, Junge JA, Kim NK, Fraser SE, Zhang C. Kim MJ, et al. ACS Chem Biol. 2023 Jul 21;18(7):1523-1533. doi: 10.1021/acschembio.3c00141. Epub 2023 May 18. ACS Chem Biol. 2023. PMID: 37200527 Free PMC article. - Nucleolar-based Dux repression is essential for embryonic two-cell stage exit.
Xie SQ, Leeke BJ, Whilding C, Wagner RT, Garcia-Llagostera F, Low Y, Chammas P, Cheung NT, Dormann D, McManus MT, Percharde M. Xie SQ, et al. Genes Dev. 2022 Mar 1;36(5-6):331-347. doi: 10.1101/gad.349172.121. Epub 2022 Mar 10. Genes Dev. 2022. PMID: 35273077 Free PMC article. - Targeting the ribosome to treat multiple myeloma.
Maclachlan KH, Gitareja K, Kang J, Cuddihy A, Cao Y, Hein N, Cullinane C, Ang CS, Brajanovski N, Pearson RB, Khot A, Sanij E, Hannan RD, Poortinga G, Harrison SJ. Maclachlan KH, et al. Mol Ther Oncol. 2024 Feb 7;32(1):200771. doi: 10.1016/j.omton.2024.200771. eCollection 2024 Mar 21. Mol Ther Oncol. 2024. PMID: 38596309 Free PMC article. - The chemotherapeutic CX-5461 primarily targets TOP2B and exhibits selective activity in high-risk neuroblastoma.
Pan M, Wright WC, Chapple RH, Zubair A, Sandhu M, Batchelder JE, Huddle BC, Low J, Blankenship KB, Wang Y, Gordon B, Archer P, Brady SW, Natarajan S, Posgai MJ, Schuetz J, Miller D, Kalathur R, Chen S, Connelly JP, Babu MM, Dyer MA, Pruett-Miller SM, Freeman BB 3rd, Chen T, Godley LA, Blanchard SC, Stewart E, Easton J, Geeleher P. Pan M, et al. Nat Commun. 2021 Nov 9;12(1):6468. doi: 10.1038/s41467-021-26640-x. Nat Commun. 2021. PMID: 34753908 Free PMC article. - A homozygous POLR1A variant causes leukodystrophy and affects protein homeostasis.
Misceo D, Lirussi L, Strømme P, Sumathipala D, Guerin A, Wolf NI, Server A, Stensland M, Dalhus B, Tolun A, Kroes HY, Nyman TA, Nilsen HL, Frengen E. Misceo D, et al. Brain. 2023 Aug 1;146(8):3513-3527. doi: 10.1093/brain/awad086. Brain. 2023. PMID: 36917474 Free PMC article.
References
- Hyman A. A., Weber C. A., Jülicher F., Liquid-liquid phase separation in biology. Annu. Rev. Cell Dev. Biol. 30, 39–58 (2014). - PubMed
Publication types
MeSH terms
Substances
LinkOut - more resources
Full Text Sources
Research Materials
Miscellaneous


