Cholesterol 25-hydroxylase suppresses SARS-CoV-2 replication by blocking membrane fusion - PubMed (original) (raw)
. 2020 Dec 15;117(50):32105-32113.
doi: 10.1073/pnas.2012197117. Epub 2020 Nov 25.
James Brett Case 3, Eylan Yutuc 4, Xiucui Ma 5 6, Sheng Shen 7, Maria Florencia Gomez Castro 1, Zhuoming Liu 1, Qiru Zeng 1, Haiyan Zhao 8, Juhee Son 1 9, Paul W Rothlauf 1 10, Alex J B Kreutzberger 11 12, Gaopeng Hou 1, Hu Zhang 7, Sayantan Bose 13, Xin Wang 2, Michael D Vahey 14, Kartik Mani 5 6, William J Griffiths 4, Tom Kirchhausen 11 12, Daved H Fremont 8, Haitao Guo 7, Abhinav Diwan 5 6, Yuqin Wang 4, Michael S Diamond 1 3 8, Sean P J Whelan 1, Siyuan Ding 15
Affiliations
- PMID: 33239446
- PMCID: PMC7749331
- DOI: 10.1073/pnas.2012197117
Cholesterol 25-hydroxylase suppresses SARS-CoV-2 replication by blocking membrane fusion
Ruochen Zang et al. Proc Natl Acad Sci U S A. 2020.
Abstract
Cholesterol 25-hydroxylase (CH25H) is an interferon (IFN)-stimulated gene that shows broad antiviral activities against a wide range of enveloped viruses. Here, using an IFN-stimulated gene screen against vesicular stomatitis virus (VSV)-SARS-CoV and VSV-SARS-CoV-2 chimeric viruses, we identified CH25H and its enzymatic product 25-hydroxycholesterol (25HC) as potent inhibitors of SARS-CoV-2 replication. Internalized 25HC accumulates in the late endosomes and potentially restricts SARS-CoV-2 spike protein catalyzed membrane fusion via blockade of cholesterol export. Our results highlight one of the possible antiviral mechanisms of 25HC and provide the molecular basis for its therapeutic development.
Keywords: COVID-19; SARS-CoV-2; innate immunity; interferon; virus entry.
Copyright © 2020 the Author(s). Published by PNAS.
Conflict of interest statement
Competing interest statement: M.S.D. is a consultant for Inbios, Eli Lilly, Vir Biotechnology, NGM Biopharmaceuticals, and Emergent BioSolutions and on the Scientific Advisory Board of Moderna. The Diamond Laboratory at Washington University School of Medicine in St. Louis has received sponsored research agreements from Moderna. Invention disclosure filed with Washington University in St. Louis for the recombinant VSV-SARS-CoV-2 used herein. W.J.G. and Y.W. are listed as inventors on the patent “Kit and method for quantitative detection of steroids” US9851368B2. W.J.G., E.Y., and Y.W. are shareholders in CholesteniX Ltd.
Figures
Fig. 1.
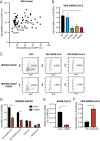
ISG screen identifies CH25H as an antiviral host factor that restricts SARS-CoV-2 infection. (A) HEK293-hACE2-mCherry cells were transduced with lentiviral vectors encoding individual ISGs for 72 h and infected with VSV-SARS-CoV or VSV-SARS-CoV-2 (MOI = 1) for 24 h. The percentage of GFP+ cells were quantified and plotted. Five ISGs were colored and selected for further analysis. (B) Wild-type (WT) HEK293-hACE2 cells or HEK293-hACE2 cells stably expressing indicated ISGs were infected with VSV-SARS-CoV-2 (MOI = 1). At 18 hpi, the mRNA level of VSV N was measured by qRT-PCR and normalized to GAPDH expression. (C) HEK293-hACE2 cells with or without CH25H expression were infected with wild-type VSV, VSV-SARS-CoV, or VSV-SARS-CoV-2 (MOI = 10) for 6 h. Cells were harvested and measured for GFP percentage and intensity by flow cytometry. Numbers indicate the percentage of FITC+ virus-infected cells within the entire population. (D) HEK293-hACE2 cells with or without CH25H expression were infected with VSV-SARS-CoV, VSV-SARS-CoV-2, rhesus rotavirus RRV strain, or adenovirus serotype 5 (MOI = 3) for 24 h. The levels of VSV N, rotavirus NSP5, and adenovirus hexon were measured by qRT-PCR and normalized to GAPDH expression. (E) HEK293-hACE2 cells with or without CH25H expression were infected with a clinical isolate of SARS-CoV-2 (2019-nCoV/USA-WA1/2020 strain, MOI = 0.5). At 24 hpi, the mRNA level of SARS-CoV-2 N was measured by qRT-PCR and normalized to GAPDH expression. (F) HEK293-hACE2 cells expressing CH25H were transduced with mock or CH25H CRISPR/Cas9 targeting lentiviruses and infected with VSV-SARS-CoV-2 (MOI = 1). At 24 hpi, the mRNA level of VSV N was measured by qRT-PCR and normalized to GAPDH expression. For all panels except A, experiments were repeated at least three times with similar results. The experiment in A was performed twice with average numbers indicated on the graph. Raw data are listed in
Dataset S1
. Data are represented as mean ± SEM. Statistical significance is from pooled data of the multiple independent experiments (*P ≤ 0.05; **P ≤ 0.01; ***P ≤ 0.001).
Fig. 2.
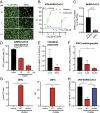
25HC inhibits SARS-CoV-2 replication. (A) HEK293-hACE2 cells were treated with 7-α, 25-diHC or 25HC at 0.1, 1, or 10 µM for 1 h and infected with VSV-SARS-CoV-2 (MOI = 5). GFP signals were detected at 24 hpi. (Scale bars, 200 µm.) (B) MA104 cells were treated with 25HC at 0.3 to 30 µM for 1 h and infected with VSV-SARS-CoV-2 (MOI = 0.1) for 24 h. GFP signals were captured by Typhoon, quantified by ImageJ, and plotted as percentage of inhibition. For CC50 measurement, cells were treated with inhibitors at 0.3 μM to 1 mM for 25 h and analyzed by a Cell Counting Kit 8 and BioTek ELx800 Microplate Reader. (C) HEK293-hACE2 cells were treated with 7-α, 25-diHC or 25HC at 10 µM for 1 h and infected with SARS-CoV-2 (MOI = 0.5). At 24 hpi, the mRNA level of SARS-CoV-2 N was measured by qRT-PCR and normalized to GAPDH expression. (D) HEK293T cells were transfected with ACE2 and TMPRSS2, treated with 25HC at 10 or 30 µM for 1 h, and infected with SARS-CoV-2-S-lenti-GFP pseudoviruses (1.45 × 10⁴ pg of HIV p24). GFP+ cells were quantified at 24 hpi. (E) Differentiated human duodenum enteroids in monolayer were treated with 25HC at 10 µM for 1 h and apically infected with VSV-SARS-CoV-2 (MOI = 1). At 24 hpi, the mRNA level of VSV-N was measured by qRT-PCR and normalized to GAPDH expression. (F) Human induced pluripotent stem cell (iPSC)-derived cardiomyocytes were treated with 25HC at 3 or 10 µM for 1 h and infected with VSV-SARS-CoV-2 (MOI = 0.01). At 96 hpi, the mRNA level of VSV-N was measured by qRT-PCR and normalized to GAPDH expression. (G) HEK293-hACE2 cells were transfected with wild-type or enzymatic mutant CH25H for 36 h. Cell pellets and culture supernatants were harvested for 25HC mass spectrometry. (H) HEK293-hACE2 cells were transfected with wild-type or enzymatic mutant CH25H for 24 h and infected with VSV-SARS-CoV-2 (MOI = 1). At 18 hpi, the mRNA level of VSV-N was measured by qRT-PCR and normalized to GAPDH expression. For all figures, experiments were repeated at least three times with similar results. Data are represented as mean ± SEM. Statistical significance is from pooled data of the multiple independent experiments (*P ≤ 0.05; **P ≤ 0.01; ***P ≤ 0.001).
Fig. 3.
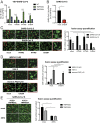
CH25H and 25HC block SARS-CoV-2 S-mediated membrane fusion. (A) Wild-type HEK293-hACE2 cells with or without TMPRSS2 or TMPRSS4 expression were transfected with mock, IFITM2, IFITM3, or CH25H for 24 h and infected with VSV-SARS-CoV-2 (MOI = 1). At 24 hpi, the mRNA level of VSV N was measured by qRT-PCR and normalized to GAPDH expression. (B) HEK293-hACE2-TMPRSS2 cells with or without CH25H expression were infected with a clinical isolate of SARS-CoV-2 (MOI = 0.5). At 24 hpi, the mRNA level of SARS-CoV-2 N was measured by qRT-PCR and normalized to GAPDH expression. (C) HEK293-hACE2-TMPRSS2 cells were cotransfected with eGFP, either SARS-CoV S or SARS-CoV-2 S, and IFITM2, IFITM3, or CH25H for 24 h. The red arrows highlight the syncytia formation. Enlarged images of mock condition are highlighted by red boxes and included as Insets (magnification, 160-fold). (Scale bars, 200 µm.) The number of cells in each GFP+ syncytia was quantified based on the six brightest syncytia per image. (D) HEK293 cells were cotransfected with eGFP, Western equine encephalomyelitis virus (WEEV) E1 and E2, VSV G, or reovirus FAST p10, with or without CH25H for 24 h. The red arrows highlight the syncytia formation. Enlarged images of mock condition are highlighted by red boxes and included as Insets (magnification, 160-fold). (Scale bars, 200 µm.) Quantification of membrane fusion assays was performed by calculating the number of cells in GFP+ syncytia. (E) HEK293-hACE2 cells stably expressing TMPRSS2 or TMPRSS4 were cotransfected with SARS-CoV-2 S and eGFP with or without 25HC (10 µM) for 24 h. The red arrows highlight the syncytia formation. (Scale bars, 200 µm.) Quantification of membrane fusion assays was performed by calculating the number of cells in GFP+ syncytia. For all figures, experiments were repeated at least three times with similar results. Data are represented as mean ± SEM. Statistical significance is from pooled data of the multiple independent experiments (*P ≤ 0.05; **P ≤ 0.01; n.s., not significant).
Fig. 4.
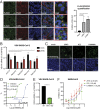
25HC inhibits endosomal cholesterol export to block SARS-CoV-2 fusion. (A) HEK293 cells were incubated with C4 TopFluor-25HC (F-25HC, 2 µM) for 1 h, fixed, and stained for recycling endosome (Rab4), late endosome (LBPA), lysosome (LAMP1), and nucleus (blue, DAPI) (magnification, 800-fold). (Scale bars, 30 µm.) Quantification of colocalization was calculated by Volocity. (B) HEK293-hACE2 cells were transfected with wild-type (WT) or dominant-negative (DN) mutants of Rab5 or Rab7 for 24 h and infected with VSV-SARS-CoV-2 (MOI = 1) with or without 25HC (10 µM). At 24 hpi, the mRNA level of VSV N was measured by qRT-PCR and normalized to GAPDH expression. (C) HEK293 cells were treated with TopFluor-cholesterol (F-cholesterol, 2 µM) for 1 h (Upper) or stained with 50 µg/mL filipin for 30 min (Lower) with or without 25HC (10 µM), ICZ (5 µM), or U18666A (5 µM). (Scale bars, 30 µm.) (D) MA104 cells were treated with U18666A at 0.01 to 30 µM for 1 h and infected with VSV-SARS-CoV-2 (MOI = 0.1) for 24 h. GFP signals were captured by Typhoon, quantified by ImageJ, and plotted as percentage of inhibition. (E) HEK293-hACE2-TMPRSS2 cells with or without NPC1 expression were infected with VSV-SARS-CoV-2 (MOI = 1). At 24 hpi, the mRNA level of VSV N was measured by qRT-PCR and normalized to GAPDH expression. (F) Vero E6 cells were treated with 25HC, ICZ, or U18666A at indicated concentrations for 1 h and infected with recombinant SARS-CoV-2-mNeonGreen virus (MOI = 0.5) for 24 h. Cells were fixed and green signals were scanned with Typhoon and quantified by ImageJ. EC50 values for each compound are provided in the parentheses. For all figures, experiments were repeated at least three times with similar results. Data are represented as mean ± SEM. Statistical significance is from pooled data of the multiple independent experiments (*P ≤ 0.05; **P ≤ 0.01).
Similar articles
- Cholesterol 25-Hydroxylase inhibits SARS-CoV-2 and other coronaviruses by depleting membrane cholesterol.
Wang S, Li W, Hui H, Tiwari SK, Zhang Q, Croker BA, Rawlings S, Smith D, Carlin AF, Rana TM. Wang S, et al. EMBO J. 2020 Nov 2;39(21):e106057. doi: 10.15252/embj.2020106057. Epub 2020 Oct 5. EMBO J. 2020. PMID: 32944968 Free PMC article. - 25-Hydroxycholesterol Production by the Cholesterol-25-Hydroxylase Interferon-Stimulated Gene Restricts Mammalian Reovirus Infection.
Doms A, Sanabria T, Hansen JN, Altan-Bonnet N, Holm GH. Doms A, et al. J Virol. 2018 Aug 29;92(18):e01047-18. doi: 10.1128/JVI.01047-18. Print 2018 Sep 15. J Virol. 2018. PMID: 29950420 Free PMC article. - Cholesterol 25-Hydroxylase Suppresses Swine Acute Diarrhea Syndrome Coronavirus Infection by Blocking Spike Protein-Mediated Membrane Fusion.
Liu D, Shi D, Shi H, Zhang L, Zhang J, Zeng M, Feng T, Yang X, Zhang X, Chen J, Jing Z, Ji Z, Zhang J, Feng L. Liu D, et al. Viruses. 2023 Dec 11;15(12):2406. doi: 10.3390/v15122406. Viruses. 2023. PMID: 38140647 Free PMC article. - An Updated Review on Betacoronavirus Viral Entry Inhibitors: Learning from Past Discoveries to Advance COVID-19 Drug Discovery.
Sabbah DA, Hajjo R, Bardaweel SK, Zhong HA. Sabbah DA, et al. Curr Top Med Chem. 2021;21(7):571-596. doi: 10.2174/1568026621666210119111409. Curr Top Med Chem. 2021. PMID: 33463470 Review. - The biogenesis of SARS-CoV-2 spike glycoprotein: multiple targets for host-directed antiviral therapy.
Santopolo S, Riccio A, Santoro MG. Santopolo S, et al. Biochem Biophys Res Commun. 2021 Jan 29;538:80-87. doi: 10.1016/j.bbrc.2020.10.080. Epub 2020 Nov 28. Biochem Biophys Res Commun. 2021. PMID: 33303190 Free PMC article. Review.
Cited by
- Platycodin D, a natural component of Platycodon grandiflorum, prevents both lysosome- and TMPRSS2-driven SARS-CoV-2 infection by hindering membrane fusion.
Kim TY, Jeon S, Jang Y, Gotina L, Won J, Ju YH, Kim S, Jang MW, Won W, Park MG, Pae AN, Han S, Kim S, Lee CJ. Kim TY, et al. Exp Mol Med. 2021 May;53(5):956-972. doi: 10.1038/s12276-021-00624-9. Epub 2021 May 25. Exp Mol Med. 2021. PMID: 34035463 Free PMC article. - SARS-CoV-2 genomic surveillance identifies naturally occurring truncation of ORF7a that limits immune suppression.
Nemudryi A, Nemudraia A, Wiegand T, Nichols J, Snyder DT, Hedges JF, Cicha C, Lee H, Vanderwood KK, Bimczok D, Jutila MA, Wiedenheft B. Nemudryi A, et al. Cell Rep. 2021 Jun 1;35(9):109197. doi: 10.1016/j.celrep.2021.109197. Epub 2021 May 14. Cell Rep. 2021. PMID: 34043946 Free PMC article. - The Role of REC8 in the Innate Immune Response to Viral Infection.
Chen S, Liu Q, Zhang L, Ma J, Xue B, Li H, Deng R, Guo M, Xu Y, Tian R, Wang J, Cao W, Yang Q, Wang L, Li X, Liu S, Yang D, Zhu H. Chen S, et al. J Virol. 2022 Mar 23;96(6):e0217521. doi: 10.1128/jvi.02175-21. Epub 2022 Feb 2. J Virol. 2022. PMID: 35107381 Free PMC article. - Cholesterol determines the cytosolic entry and seeded aggregation of tau.
Tuck BJ, Miller LVC, Katsinelos T, Smith AE, Wilson EL, Keeling S, Cheng S, Vaysburd MJ, Knox C, Tredgett L, Metzakopian E, James LC, McEwan WA. Tuck BJ, et al. Cell Rep. 2022 May 3;39(5):110776. doi: 10.1016/j.celrep.2022.110776. Cell Rep. 2022. PMID: 35508140 Free PMC article. - Serum 25-hydroxycholesterol levels are increased in patients with coronavirus disease 2019.
Asano T, Wakabayashi T, Kondo Y, Okada K, Yamamuro D, Koga Y, Oka K, Sakurai M, Sawayama N, Takahashi M, Okazaki H, Ebihara K, Minami K, Morisawa Y, Hatakeyama S, Matsumura M, Ishibashi S. Asano T, et al. J Clin Lipidol. 2023 Jan-Feb;17(1):78-86. doi: 10.1016/j.jacl.2022.10.012. Epub 2022 Nov 6. J Clin Lipidol. 2023. PMID: 36522261 Free PMC article.
References
- Durbin J. E., et al. , Type I IFN modulates innate and specific antiviral immunity. J. Immunol. 164, 4220–4228 (2000). - PubMed
Publication types
MeSH terms
Substances
Grants and funding
- R35 GM130386/GM/NIGMS NIH HHS/United States
- 75N93019C00062/AI/NIAID NIH HHS/United States
- R00 AI135031/AI/NIAID NIH HHS/United States
- R01 HL107594/HL/NHLBI NIH HHS/United States
- T32 AI007245/AI/NIAID NIH HHS/United States
- GM130386/NH/NIH HHS/United States
- R01 AI150796/AI/NIAID NIH HHS/United States
- R37 AI059371/AI/NIAID NIH HHS/United States
- I01 BX004235/BX/BLRD VA/United States
- R01 AI127828/AI/NIAID NIH HHS/United States
- P30 DK052574/DK/NIDDK NIH HHS/United States
LinkOut - more resources
Full Text Sources
Other Literature Sources
Molecular Biology Databases
Research Materials
Miscellaneous


