Elevated NSD3 histone methylation activity drives squamous cell lung cancer - PubMed (original) (raw)
. 2021 Feb;590(7846):504-508.
doi: 10.1038/s41586-020-03170-y. Epub 2021 Feb 3.
Natasha M Flores # 2, Simone Hausmann 2, Shane M Lofgren 2, Vladlena Kharchenko 3, Maria Angulo-Ibanez 4 5, Deepanwita Sengupta 1, Xiaoyin Lu 2, Iwona Czaban 3, Dulat Azhibek 3, Silvestre Vicent 6, Wolfgang Fischle 3, Mariusz Jaremko 3, Bingliang Fang 7, Ignacio I Wistuba 8, Katrin F Chua 4 5, Jack A Roth 7, John D Minna 9 10 11, Ning-Yi Shao 12, Łukasz Jaremko 13, Pawel K Mazur 14, Or Gozani 15
Affiliations
- PMID: 33536620
- PMCID: PMC7895461
- DOI: 10.1038/s41586-020-03170-y
Elevated NSD3 histone methylation activity drives squamous cell lung cancer
Gang Yuan et al. Nature. 2021 Feb.
Abstract
Amplification of chromosomal region 8p11-12 is a common genetic alteration that has been implicated in the aetiology of lung squamous cell carcinoma (LUSC)1-3. The FGFR1 gene is the main candidate driver of tumorigenesis within this region4. However, clinical trials evaluating FGFR1 inhibition as a targeted therapy have been unsuccessful5. Here we identify the histone H3 lysine 36 (H3K36) methyltransferase NSD3, the gene for which is located in the 8p11-12 amplicon, as a key regulator of LUSC tumorigenesis. In contrast to other 8p11-12 candidate LUSC drivers, increased expression of NSD3 correlated strongly with its gene amplification. Ablation of NSD3, but not of FGFR1, attenuated tumour growth and extended survival in a mouse model of LUSC. We identify an LUSC-associated variant NSD3(T1232A) that shows increased catalytic activity for dimethylation of H3K36 (H3K36me2) in vitro and in vivo. Structural dynamic analyses revealed that the T1232A substitution elicited localized mobility changes throughout the catalytic domain of NSD3 to relieve auto-inhibition and to increase accessibility of the H3 substrate. Expression of NSD3(T1232A) in vivo accelerated tumorigenesis and decreased overall survival in mouse models of LUSC. Pathological generation of H3K36me2 by NSD3(T1232A) reprograms the chromatin landscape to promote oncogenic gene expression signatures. Furthermore, NSD3, in a manner dependent on its catalytic activity, promoted transformation in human tracheobronchial cells and growth of xenografted human LUSC cell lines with amplification of 8p11-12. Depletion of NSD3 in patient-derived xenografts from primary LUSCs containing NSD3 amplification or the NSD3(T1232A)-encoding variant attenuated neoplastic growth in mice. Finally, NSD3-regulated LUSC-derived xenografts were hypersensitive to bromodomain inhibition. Thus, our work identifies NSD3 as a principal 8p11-12 amplicon-associated oncogenic driver in LUSC, and suggests that NSD3-dependency renders LUSC therapeutically vulnerable to bromodomain inhibition.
Figures
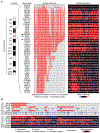
Extended Figure 1.. Characterization of genetic drivers of LUSC tumorigenesis.
a, Genetic alterations and mRNA expression of genes in the 8p11-12 amplification genomic region of chromosome 8 from the 85 8p11-12 amplified human LUSC specimens in the TCGA dataset. b, Genetic alterations and mRNA expression of NSD3, FGFR1, PIK3CA, PTEN, SOX2, CDKN2A, CDKN2B from all 464 of the human LUSC specimens in the TCGA dataset (ID: phs000178) analyzed using cBioPortal.
Extended Figure 2.. NSD3 but not FGFR1 depletion inhibits LUSC tumorigenesis in vivo.
a, Western blot analysis with the indicated antibodies of whole-cell lysates from H520 cells expressing sgControl or sgNSD3. The bands representing NSD3 and NSD3Short are indicated. Tubulin was used as a loading control. b, Western blot analysis with the indicated antibodies of whole-cell lysates from H520 cells expressing sgControl or sgFGFR1. Tubulin was used as a loading control. c, Real-time (RT) qPCR analysis of PLPP5 mRNA expression in H520 cells expressing sgControl or sgPLPP5. We note that several commercial antibodies against PLPP5 were tested but we could not detect any reproducible band close to the correct size (data not shown). The RT-qPCR data were normalized to Actb and presented as fold change relative to the sgControl sample. Error bars represent mean ± s.d. from three independent experiments. P value determined by two-tailed unpaired t-test. d, Treatment of the 8p11AMP-positive H520 LUSC cell line with sgRNAs targeting the 8p11-amplified region does not cause an increase in phosphorylated H2AX (γH2AX). Western blot analysis with the indicated antibodies of H520 cells expressing Cas9 and the indicated sgRNAs. DNA damage-induced by hydroxyurea (HU) treatment was used as a positive control, H3 was used as a loading control. e, Depletion of NSD3, but not depletion of FGFR1 or PLPP5, attenuates xenograft growth of the 8p11AMP H520 LUSC cells. Tumor volume quantification of the indicated H520 xenografts generated in immunocompromised mice (n = 5 mice, for each treatment group). P values indicated determined by two-way ANOVA with Tukey’s post hoc test. Data are represented as mean ± s.e.m. Data showing sgControl, sgNSD3 and sgFGFR1 are the same as from Figure 1b. f, Representative HE-stained sections and IHC staining of lung tissue from PSC mouse model lung tumor showing key diagnostic histological features of LUSC including positive staining for keratin and p63 and negative staining for TTF1 (representative of n = 8 samples for each group). Human LUSC samples are shown for comparison (representative of n = 8 samples for each group). Scale bars, 50 μm. g, Increased expression of NSD3 in lungs tracks with tumor progression. IHC analysis of NSD3 levels in wild type lung and tumor biopsies collected from the PSC model at 150 days and at the clinical endpoint when animals develop significant morbidity (representative of n = 8 samples for each group). Scale bars, 50 μm. h, Quantification of NSD3 levels in tumor biopsies as in (g) within tumor areas that have high-, low-intensity or negative staining for chromogen. Data are represented as mean ± s.e.m. i, NSD3 mRNA overexpression is common (~60%) and not limited to 8p11-12 amplified tumors. Genetic alterations and mRNA expression of the indicated genes in human LUSC patient samples from the TCGA dataset showing frequency of overexpression and alternations in NSD3 and known driver mutations PIK3CA, PTEN, SOX2, CDKN2A, CDKN2B. j, Representative HE-stained sections and IHC staining of lung tissue from PSC (control), PSCFGFR1-KO and PSCNSD3-KO mutant mice, (representative of n = 8 mice for each experimental group). Scale bars, 50 μm; arrowheads, positive cleaved Caspase 3 cells. k, l, Quantification of Ki67 (Ki67+ positive cells) a marker of proliferation (k) and cleaved Caspase 3 (cl. Caspase 3+ positive cells) a marker of apoptosis (l) in samples as in (j). In k, l and in all subsequent box plots, the line indicates the median, the box marks the 75th and 25th percentiles and the whiskers indicate the minimum and maximum values. All data points are shown. P values indicated determined by one-way ANOVA with Tukey’s post hoc test (k, l).
Extended Figure 3.. Identification of the cancer-associated NSD3T1232A variant as a gain of function variant.
a, Schematic diagram of the distribution of the different NSD3 candidate mutants tested in (b). b, In vitro methylation assay as in Figure 2b on rNuc with recombinant wild-type NSD3SET or the indicated mutants (1-35) with non-radiolabeled SAM (the T1232A mutant is indicated in red). For each screening panel set, the top of the panel shows the Western blot and the bottom panel, Coomassie blue stain of the NSD3 proteins. c, Schematic diagram of NSD3 fragments used in this study. d, In vitro methylation reactions with rNucs and different concentrations of recombinant wild-type NSD3SET or NSD3SET-T1232A with 3H-SAM. Methylation intensity was measured by liquid scintillation counting. Error bars represent mean ± s.d. from three independent experiments. e, Western blot analysis with the indicated antibodies of whole cell extracts from NSD2-deficient HT1080 cells (to deplete H3K36me2 compared to control HT1080 cells (lanes 1 and 2)) overexpressing the indicated NSD3 variants. Total H3 was used as a loading control. f, Methylation assays as in Figure 2b with rNuc with linker DNA (187 bp) and increasing concentrations of enzyme as indicated. Western blot shows H3K36me2 generation, H3 is shown as a loading control. Bottom panel, Coomassie blue stain of NSD3 proteins.
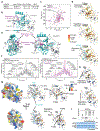
Extended Figure 4.. Biophysical characterization of T1232A substitution on the NSD3SET domain.
a, Kd values with corresponding errors being s.d. are shown for binding studies of NSD3SET and NSD3SET-T1232A to recombinant nucleosomes (rNuc) reconstituted on 147bp and 187bp 601 Widom DNA as indicated (determined by microscale thermophoresis (MST)) and the cofactor SAM (determined by ITC) (see Supplementary Table 1; see Methods). Error bars represent mean ± s.d. from three independent experiments. b, The topology of NSD3SET domain segments of Pre-SET (white-gray), SET (cyan), Post-SET (dark gray) and regulatory loop (magenta) marked onto the ribbon representations of existing NSD3SET domain crystal structures (PDB 5UPD, 6CEN). The missing residues in the tip of the regulatory loop, not modelled into the electron densities, are denoted with dotted lines. The zinc(II) ions are depicted as gray spheres, SAM cofactor with sticks. Residues T1232 and V1243 are marked with their side-chains. Bottom panel: Schematic representation of the primary sequence with indicated domains and the location of the T1232A substitution. c, The overlay of the 2D [1H,15N] TROSY-HSQC (Transverse Relaxation Optimized SpectroscopY - Heteronuclear Single Quantum Coherence) spectra of 250 μM U-[15N] NSD3SET wild-type (dark gray) and NSD3SET-T1232A (magenta) at pH 7.5 and 25°C. The 1H/15N backbone amide cross-peaks of T1232 in NSD3SET wild-type and A1232 of NSD3SETT1232A mutant are marked. d, The backbone amide chemical shift perturbations (CSP_i_ = [(ΔδH,i)2+0.25·(ΔδN,i)2]0.5) between NSD3SET and NSD3SET-T1232A are mapped onto the ribbon representations of protein structures; left: the NSD3SET with regulatory loop in closed (PDB 5UPD), center: in open (based on the NSD2SET crystal structure (PDB 5LSU) modelled with SwissModel) and right: the open conformation with the H3.1 A29-R42 substrate docked (see Methods). The T1232 and V1243 residues are marked with their side-chains. Residues are colored as follows: 0.03 ≤ CSP_i_ < 0.05 (yellow), 0.05 ≤ CSP_i_ < 0.11 (light orange), 0.11 ≤ CSP_i_ < 0.75 ppm (orange), CSP_i_ > 4.60 (red), prolines and residues missing amide assignments are marked gray. e, The overlay of NSD3SET domains with the regulatory loop in open and closed conformations. The open state is the crystal structure of NSD3SET, while the closed state is based on the NSD2SET crystal structure (PDB 5LSU) modelled with SwissModel. The protein sequence graph and coloring as in 4h. f, The projections of 2D TROSY-type heteronuclear {1H}-15N nuclear Overhauser effect (NOE) experiments collected for 370 μM U-[15N] NSD3SET wild-type (left panel) and NSD3SET-T1232A (right panel) at pH 7.5 and 25°C with several residues marked. (Experimental details in Methods). The higher NOE ratio value the more rigid the N-H vector, meaning less dynamic motion, whereas the lower value means more dynamic, indicative of less restricted motions. The tryptophan imidazole side-chain 1H/15N correlations are also detected in this experiment, Hε1/Nε1 from W1235 and W1157. g, The observed changes in {1H}-15N NOE values (ΔNOEi) reporting on ps-ns polypeptide main-chain mobility differences between NSD3SET and NSD3SET-T1232A are plotted on the 3D static structures of NSD3SET (PDB: 6CEN, left column represented as protein surface, middle column ribbon with H3 peptide, right column ribbon with no substrate). Key features are indicated. The light blue to dark blue indicates the decreased fast dynamics after T1232A substitution, and yellow to red increased dynamics on ps-ns time scale. h, The T1232A substitution enhances the mobility of the regulatory loop. The observed changes in heteronuclear {1H}-15N nuclear Overhauser effect (NOE) mapped on the ribbon representations of the open and closed states of the regulatory loop within the NSD3SET and in Figure 2e. The structures are the same as in (e). i, Methylation assays as in Figure 2a with rNuc(187bp) and the indicated NSD3 variants.
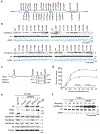
Extended Figure 5.. Generation of PSCN LUSC mouse model and NSD3 coordination of an oncogenic gene expression program in LUSC.
a, Alignment of NSD3 human and mouse residues spanning human T1232 indicates that human NSD3 T1232 corresponds with murine NSD3 T1242. b, Schematic of the LSL-V5-Nsd3T1242A conditional allele. In the presence of Cre recombinase, a translational stop cassette flanked by LoxP recombination sites is deleted to enable V5-Nsd3T1242A expression. P1 and P2 indicate location of genotyping primers. c, Confirmation of successful generation of LSL-Nsd3T1242A allele by PCR (P1+P2+P3 primers) on DNA isolated from mouse tail biopsies from indicated mouse genotypes, expected products sizes are marked (upper panel). d, Western blots with the indicated antibodies (V5 antibody detects V5-tagged NSD3T1242A) of lysates from LSL-V5-Nsd3T1242A lung fibroblast transduced ex vivo with Ad-Cre or vehicle (control). Actin is shown as a loading control. e, Left panel: Sanger sequencing confirmation Nsd3T1242A mutation is present in generated conditional LSL-V5-Nsd3T1242A mutant mouse. Wild-type NSD3 sequence from control animals is shown on the right panel. f, Representative HE-stained and IHC staining with indicated antibodies of lung tissue sections from PSC and PSCN mutant mice, (representative of n = 8 mice for each group). Scale bars, 50 μm; arrowheads, positive cleaved Caspase 3 cells. g, Quantification of cleaved Caspase 3 (cl. Caspase 3+ positive cells) a marker of apoptosis in samples as in (f). P values indicated determined by two-tailed unpaired t-test. h, Western blots with indicated antibodies of whole-cell lysates from PSCC or two different PSCN cell line. Total H3 was used as a loading control. i, Volcano plot of RNA-seq comparison between PSCN and PSC tumor biopsies (three independent biological replicates for each condition) results in higher expression of 891 genes shown in red (fold change log2 ≤ −0.5 and P < 0.05 by Wald test) and decreasing expression of 1839 genes shown in green (fold change log2 ≥ 0.5 and P < 0.05 by Wald test). False discovery rate (FDR) values are provided. j, Volcano plot of RNA-seq comparison of PSCN cells ± sgNSD3 (three biological replicates for each condition) causes decreasing expression of 234 genes shown in red (adjusted P < 0.001 by likelihood ratio test) and increasing expression of 229 genes shown in green (adjusted P < 0.001 by likelihood ratio test). False discovery rate (FDR) values are provided. k, Top hallmark gene sets identified in the GSEA analysis of datasets from (i-j) shows high overlap. Normalized enrichment scores (NES) provided (detailed statistics description in Methods). l, Reconstitution of NSD3-deficient PSCN cells with NSD3 and derivatives. Western blot analysis with the indicated antibodies of PSCN whole cell lysates ± sgNSD3 and complemented with the indicated CRISPR-resistant NSD3 derivatives. H3 and tubulin were used as loading controls. m, Quantitative real-time (RT)-PCR analysis of the transcript levels of the indicated genes in the cells as described in (l). The RT-qPCR data for each gene were normalized to Actb and presented as fold change relative to the sgControl sample. Error bars represent mean ± s.d. from three independent experiments. P values indicated determined by one-way ANOVA with Tukey’s post hoc test.
Extended Figure 6.. NSD3T1242A-mediated H3K36me2 in LUSC oncogenic reprogramming.
a, Independent CUT&RUN replicate for H3K36me2 as in Figure 3i. b, Normalized gene expression levels from the indicated groups from PSCN cell line RNA-seq datasets. dDEG (downregulated DEGs) and uDEG (upregulated DEGs) from Extended Data Fig. 5j, and all genes. P values indicated determined by two-tailed robust t-test (detailed statistics description in Methods). dDEG n = 234, uDEG n = 229, all genes n = 16091. Boxes: 25th to 75th percentile, whiskers: min. to max., center: median. c, CUT&RUN profile for H3K36me2 and H3K27me3 in PSCN cells ± sgNSD3 over average of intergenic regions on a genome-wide scale. d, CUT&RUN profile for a monoclonal IgG (against GFP) as in Figure 3i for all genes and dDEG as indicated in PSCN cells ±sgNSD3 is shown as a negative control. e, Genome browser view of CUT&RUN signals for H3K36me2 and H3K27me3 on the indicated genes and conditions. Arrow indicates the direction of gene transcription. f, Loss of occupancy of NSD3T1242A and H3K36me2 at the indicated NSD3-target genes (Irgm1 and Prkaa2) upon NSD3 depletion. Btg2 and Gadd45g are not NSD3-target genes and shown as control regions that do not change in response to NSD3 depletion. ChIP-qPCR analysis of V5-NSD3T1242A (top panel) and H3K36me2 (bottom panel) in the body of the indicated genes. The data were plotted as percent enrichment relative to input. Error bars represent mean ± s.d. from three independent experiments. P values indicated determined by two-tailed unpaired t-test. g, NSD3T1242A and H3K36me2 occupy the promoter and gene body regions of target genes Irgm1 and Prkaa2. Top panel, schematic of general gene structure and site of primers for Irgm1 (left panel) and Prkaa2 (right panel) gene loci. ChIP-qPCR analysis of V5-NSD3T1242A (left panel) and H3K36me2 (right panel) in promoter (p1), gene body (p2) and transcription end site (TES; p3) regions of target genes. TSS: transcription start site. The data were plotted as percent enrichment relative to input. Error bars represent mean ± s.d. from three independent experiments. P values indicated determined by two-tailed unpaired t-test. h, ChIP-qPCR analysis of NSD3T1242A (left panel) and H3K36me2 (right panel) occupancy at the gene body regions of Irgm1 and Prkaa2 gene loci in reconstituted cells as described in Extended Data Fig. 5l. The enrichment was normalized to the sgControl sample and presented as fold change relative to the sgControl sample. Error bars represent mean ± s.d. from three independent experiments. P values indicated determined by one-way ANOVA with Tukey’s post hoc test.
Extended Figure 7.. NSD3 depletion attenuates growth of 8p11-amplified and NSD3-overexpressing human LUSC cell lines and ectopic expression of NSD3 cooperates with SOX2 to transform tracheobronchial epithelial cells.
a, Genetic alterations and mRNA expression of LUSC-associated genes in human LUSC cell lines used in this study. b, NSD3 depletion by CRISPR/Cas9 attenuates xenograft tumor growth of 8p11AMP and NSD3-overexpressing LUSC cell lines. Upper panel: Tumor volume quantification of human LUSC cell line xenografts described in (Figure 4a and Extended Data Fig 7a) treated with sgControl or sgNSD3 as indicated and grown in immunocompromised mice at 28 days after implantation (n = 5 mice, for each treatment group). P values indicated determined by one-way ANOVA with Tukey’s post hoc test. Data are represented as mean ± s.e.m. Lower panel: Western blot analysis with the indicated antibodies of whole cell lysates from cells in upper panel. γH2AX levels are shown to assess whether sgNSD3 expression induces non-specific DNA damage. H3 and Actin are used as loading controls. (upper panel). c, NSD3 depletion by shRNA attenuates xenograft tumor growth of 8p11AMP positive LUSC cell lines. Upper panel: Tumor volume quantification of the indicated 8p11AMP-positive and two control 8p11AMP-negative human LUSC cell line xenografts described as in (a) treated with shControl or shNSD3 as indicated and grown in immunocompromised mice at 28 days after implantation (n = 5 mice, for each treatment group). P values indicated determined by one-way ANOVA with Tukey’s post hoc test. Data are represented as mean ± s.e.m. Lower panel: Western blot analysis with the indicated antibodies of whole cell lysates from cells in upper panel. Actin is used as a loading control. d, NSD3-deficient H520 cells reconstituted with the indicated V5-tagged CRISPR-resistant NSD3 derivatives: NSD3T1232A (NSD3TA) NSD3T1232A/Y1174A (NSD3TA/YA). Western blots of H520 lysates with indicated antibodies H3 and tubulin were used as loading controls (see Figure 4b). e, Western blots of whole cell lysate of AALE cells used in transformation assays for Figure 4c with ectopic expression of SOX2 and the indicated V5-tagged constructs (NSD3WT, NSD3TA, NSD3YA, NSD3TA/YA, NSD3Short or FOXE1). f, Quantification of soft agar colony formation for AALE tracheobronchial epithelial cells with ectopic expression of SOX2 and NSD3WT, NSD3TA, NSD3YA, NSD3TA/YA, NSD3Short or FOXE1 as in (e). Data are represented as mean ± s.e.m. of three technical replicates in two independent experiments. g, Representative soft-agar images from AALE transformation assays in (f). h, In vivo AALE transformation assay images from Figure 4c. Optical overlay of bioluminescent signal with X-ray image of mice grafted under the renal capsule with AALE cells expressing plasmids as in (e) and AkaLuc after substrate (AkaLumine-HCl; see Methods) administration (n = 5 for each condition). The color bar indicates the total bioluminescence radiance (photons/s/cm2/sr).
Extended Figure 8.. Genomic characterization of patient-derived xenografts (PDX) from primary LUSC.
a, Distribution of whole-genome copy number alterations in LUSC PDXs utilized in this study by OncoScan (detailed description in Methods). Green lines: 3p11 amplification (including PIK3CA and SOX2); red lines: marks, 8p11-12 (e.g. NSD3 and FGFR1 as shown); blue lines: biallelic deletion in 9p21.3 (including CDKN2A/B). b, Sanger sequencing analysis of NSD3 SET domain mutation status in collection of 37 LUSC PDX identified NSD3T1232A mutation in one of the PDX samples (PDXT1232A) and Nsd3 wildtype in other analyzed PDXs.
Extended Figure 9.. NSD3-dependency renders PDXs from LUSC patients therapeutically vulnerable to BETi.
a-c, Tumor volume quantification of PDXCTR-1 (a), PDXCTR-2 (b) and PDXAMP-2 (c) growing in immunocompromised mice (n = 5 mice, for each treatment group). Western blots with the indicated antibodies of lysates from the PDX ± sgNSD3 is shown. Actin is shown as a loading control. d, BRD4 interacts with NSD3 in PSCN cells. Left panel: Western blot of whole cell lysates from PSCN cells ± sgNSD3 to show the relative position of NSD3 and NSD3Short in PSCN cells. Tubulin used as a loading control. Right panel: BRD4 interacts with both NSD3 and NSD3Short isoforms in PSCN cells. Co-immunoprecipitation (IP) experiments in PSCN cells with indicated antibodies for IPs and western analyses. Input, PSCN cell nuclear extract. e, Proliferation assay of PSCC and PSCN treated with vehicle control or 20nM AZD5153 (BETi). Data represent mean ± s.e.m. of three technical replicates in two independent experiments. f, Treatment of PSCN cells with the BETi JQ1 inhibits expression of the indicated NSD3 target genes. Real-time (RT) qPCR analysis of the indicated mRNAs from PSCN cells treated with DMSO or 100nM of JQ1. The RT-qPCR data for each target gene were normalized to Actb and presented as fold change relative to DMSO treated sample. Error bars represent mean ± s.d. from three independent experiments. P values were determined by two-tailed unpaired t-test. g-h, Tumor volume quantification of PDXCTR-1 (g) and PDXCTR-2 (h) treated with BETi or vehicle (control). Arrowhead indicates start of the treatment. P values were determined by two-tailed unpaired t-test. (a-c, f) or two-way ANOVA with Tukey’s post hoc test (e, g-h). Data are represented as mean ± s.e.m. (a-c, e, f-h).
Extended Figure 10.. Model of the role for elevated NSD3 H3K36 methylation activity in LUSC pathogenesis.
LUSC is characterized by a number of driver mutations such as increased expression of PI3K and SOX2, PI3K activating mutations, deletion of PTEN and other deletions and alterations. One of the more common genetic alterations is amplification of the 8p11-12 genomic region (~20% of LUSC patients). While increased expression of FGFR1 is postulated to be the causative mutation of the 8p11-12 amplicon, our work implicates amplification of the neighboring gene NSD3 as the main driving alteration. As shown, NSD3 amplification leads to increased NSD3 expression and hence increased synthesis of H3K36me2, which works in concert with other LUSC driver mutations to promote LUSC pathogenesis. In addition, as shown in Extended Data Fig. 2i, NSD3 overexpression is detected in 60% of LUSC patients, thus NSD3 is frequently highly expressed in LUSC that does not harbor the 8p11-12 amplifications. We also describe NSD3T1232A as a gain-of-function (GOF) variant, that while far less common than the 8p11-12 amplicon and NSD3 overexpression, is an alteration present in human LUSC. The NSD3T1232A variant, due to enhanced catalytic behavior, functionally acts like amplified or overexpressed NSD3 in increasing H3K36me2 synthesis and cooperating with other LUSC driver mutations to accelerate tumorigenesis. The increase in H3K36me2 by NSD3 overexpression or NSD3T1232A reprograms the chromatin landscape, blocking synthesis of H3K27me3 and increasing H3K36me2, which stimulates transcription of key oncogenic targets including genes involved in mTOR signaling and MYC-associated pathways. We speculate that NSD3-regulated tumors become addicted to H3K36me2-driven transcriptional activation, rendering these tumors particularly vulnerable to BETi as NSD3 and BRD4 interact and cooperate in transcription. This hypersensitivity could potentially be exploited clinically due to an expanded therapeutic window for BETi and by using these drugs as targeted therapy for the tens of thousands of patients that are 8p11-12 positive. Not shown in the model, NSD3 is overexpressed in many LUSC samples without an underlying known alteration and we speculate that in such cases, increased NSD3 would contribute to tumorigenesis in a similar fashion as the scenarios described above in which NSD3 is hyperactive or overexpressed due to amplification.
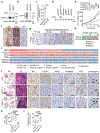
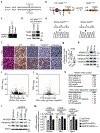
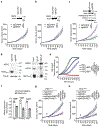
Figure 1.. Deletion of NSD3, but not FGFR1, inhibits LUSC tumorigenesis in vivo.
a, Analysis of 8p11-12 amplified LUSC datasets from TCGA indicates increased NSD3, but not FGFR1, mRNA expression correlates with gene amplification (n = 85 patients). b, Depletion of NSD3, not FGFR1, attenuates xenograft growth of the 8p11AMP LUSC cell line H520. Tumor volume quantification of H520 xenografts in immunocompromised mice (n = 5 mice for each group). c, d, Western blots with the indicated antibodies of LUSC tumor lysates from PSC (control), PSCNSD3-KO (c) and PSCFGFR1-KO (d) mutant mice. Two independent and representative samples are shown for each genotype. Tubulin used as a loading control. e, Micro-computed tomography (μCT) analysis of tumor volume of the indicated mouse models (n = 5 mice for each group). In this and subsequent box plots, the line indicates the median, the box marks the 75th and 25th percentiles, and the whiskers minimum and maximum values. All data points are shown. P values determined by two-way ANOVA with Tukey’s post hoc test (b, e). f, Kaplan-Meier survival curves of PSC (n = 10, median survival = 200.5 days), PSCFGFR1-KO (n = 8, median survival = 202.5 days) and PSCNSD3-KO (n = 10, median survival = 257 days) mice, P value determined by log-rank test.
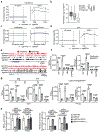
Figure 2.. Molecular basis of increased H3K36me2 catalysis by NSD3T1232A.
a, In vitro methylation reactions of wild-type (WT) or mutant NSD3SET using recombinant free histone H3 or nucleosome (rNuc) and 3H-SAM as substrates. No enzyme is a negative control. Top panel, autoradiography; bottom panel, Coomassie blue staining. b, Methylation assays on rNuc as in (a) with non-radiolabeled SAM. Westerns of reaction products shown with the indicated antibodies. H3 is shown as loading control. c, Methylation assays as in (b) with recombinant full-length wild-type or mutant NSD3. Data in a-c are representative of three or more biologically independent experiments with similar results. d-e, T1232A substitution induces widespread mobility changes on the NSD3 catalytic domain. d, Amide CSPs between NSD3SET-T1232A and NSD3SET is shown mapped onto the surface representation of the NSD3SET structure (PDB: 6CEN) with docked H3.1 residues A29 to R42 (stick representation). Gray: prolines and residues missing amide assignments. e, Changes in heteronuclear {1H}-15N nuclear Overhauser effect (NOE) values plotted on the structure of NSD3 as in (d) in ribbon representation. T1232 and V1243 residues are indicated. Uncolored residues: undetectable NOE changes.
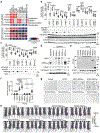
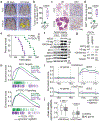
Figure 3.. Mutant NSD3-mediated H3K36me2 synthesis promotes oncogenic programming and LUSC tumorigenesis.
a, Representative μCT scans at 90 and 120 days after adenoviral-Cre mediated tumor induction in PSC and PSCN mice. Scale bars: 10 mm. b, Quantitation of tumor volume as in (a) at 120 days (n = 5 mice for each group). c, Representative HE and IHC staining of lung tissue from PSCN and control PSC mutant mice (n = 8 mice for each group). Scale bars: 100 μm. d, Quantification of proliferation (Ki67+-cells) as in (c). P values determined by two-tailed unpaired t-test. (b, d). e, Kaplan-Meier survival curves of PSCN (n = 11, median survival = 145 days) and PSC (same data as in Fig. 1f, n = 10, median survival = 200.5 days) mutant mice, indicated P value determined by log-rank test. f, Western blots with the indicated antibodies of LUSC tumor lysates from PSCN and PSC mice. Two independent and representative samples are shown for each genotype. g, Western blots with the indicated antibodies of cell lysates from either control (sgControl) or NSD3-depleted (sgNSD3) PSCN cells. H3 and tubulin shown as loading controls in (f, g). h, GSEA identifies upregulation of hallmark gene sets: MYC targets and mTOR signaling (MSigDB: M5928, M5924) in RNA-seq data from PSCN versus PSC tumor biopsies and PSCN cells ± sgNSD3 (n = 3 biologically independent samples per group). Normalized enrichment scores (NES) and nominal P values are provided (detailed statistics description in Methods). i, CUT&RUN profiles of H3K36me2 (upper panel) or H3K27me3 (lower panel) over averaged gene body for all genes or dDEG in PSCN cells ± sgNSD3 as indicated. j, Quantification of H3K36me2 and H3K27me3 peak intensity change in PSCN cells ±sgNSD3 on the indicated gene sets. dDEG n = 234, all genes n = 16091. Two-sided t-test P value provided.
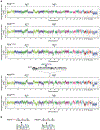
Figure 4.. NSD3 promotes human lung cell transformation and xenograft tumor growth of LUSC cells and PDXs and renders PDXs hyper-susceptible to BETi.
a, NSD3 depletion attenuates xenograft tumor growth of 8p11AMP and NSD3-overexpressing LUSC cell lines. Summary of xenograft tumor growth for the indicated cell lines treated with sgNSD3 or shNSD3 as indicated. NSD3 levels: H, high mRNA (Z-score > 1.0); L, low mRNA (Z-score < 1.0), scoring was consistent with relative protein levels (see Extended Data Figs 7a-b); xenograft tumor growth: ↓: reduced; ↔: no change (see Extended Data Figs. 7b-c); n.d., not determined. b, NSD3 catalytic activity required for full H520 xenograft tumor growth. Tumor volume change of H520 xenografts reconstituted with the indicated V5-tagged CRISPR-resistant NSD3 derivatives in immunocompromised mice (n = 5 mice, for each group). c, NSD3WT and NSD3TA transform _SOX2_-expressing AALE cells in vivo. Quantification of tumor size determined by bioluminescence of AALE cells grafted under the renal capsule and expressing the indicated plasmids plus the AkaLuc reporter (n=5 mice for each group; see Methods). FOXE1 is a positive control, NSD3WT and NSD3TA vs. FOXE1 P < 0.0001. Lines denote median. d, Western blots of lysates from the indicated LUSC PDX samples and using the indicated antibodies. H3 and Actin are loading controls. e, Western blots as in (d) of lysates from PDXT1232A (left) and PDXAMP (right) ±sgNSD3 treatment. f, g, PDX tumor volume quantification of f, PDXT1232A and g, PDXAMP ±sgNSD3 in immunocompromised mice (n = 5 for each group). h, i, Tumor volume quantification of h, PDXT1232A and i, PDXAMP ±sgNSD3 and ±BETi (AZD5153 2.5mg/kg, i.p.) treatments as indicated (n = 5 mice for each group). Control animals received vehicle (placebo) treatment. Arrowhead indicates start of the treatment. P values determined by two-way ANOVA with Tukey’s post hoc test (b, c, h, i) or two-tailed unpaired t-test. (f, g). Data are represented as mean ± s.e.m. (b, f-i).
Comment in
- An epigenetic tipping point in cancer comes under the microscope.
Sroka MW, Vakoc CR. Sroka MW, et al. Nature. 2021 Feb;590(7846):399-400. doi: 10.1038/d41586-021-00002-5. Nature. 2021. PMID: 33536596 No abstract available. - Squamous cell lung cancer changes driver.
Villanueva MT. Villanueva MT. Nat Rev Drug Discov. 2021 Mar;20(3):177. doi: 10.1038/d41573-021-00028-4. Nat Rev Drug Discov. 2021. PMID: 33568801 No abstract available. - A driver gene hiding in plain sight.
Seton-Rogers S. Seton-Rogers S. Nat Rev Cancer. 2021 Apr;21(4):213. doi: 10.1038/s41568-021-00341-5. Nat Rev Cancer. 2021. PMID: 33608665 No abstract available.
Similar articles
- Elevated expression of nuclear receptor-binding SET domain 3 promotes pancreatic cancer cell growth.
Sun Y, Xie J, Cai S, Wang Q, Feng Z, Li Y, Lu JJ, Chen W, Ye Z. Sun Y, et al. Cell Death Dis. 2021 Oct 6;12(10):913. doi: 10.1038/s41419-021-04205-6. Cell Death Dis. 2021. PMID: 34615858 Free PMC article. - NSD3-Induced Methylation of H3K36 Activates NOTCH Signaling to Drive Breast Tumor Initiation and Metastatic Progression.
Jeong GY, Park MK, Choi HJ, An HW, Park YU, Choi HJ, Park J, Kim HY, Son T, Lee H, Min KW, Oh YH, Lee JY, Kong G. Jeong GY, et al. Cancer Res. 2021 Jan 1;81(1):77-90. doi: 10.1158/0008-5472.CAN-20-0360. Epub 2020 Sep 23. Cancer Res. 2021. PMID: 32967925 - Molecular basis of nucleosomal H3K36 methylation by NSD methyltransferases.
Li W, Tian W, Yuan G, Deng P, Sengupta D, Cheng Z, Cao Y, Ren J, Qin Y, Zhou Y, Jia Y, Gozani O, Patel DJ, Wang Z. Li W, et al. Nature. 2021 Feb;590(7846):498-503. doi: 10.1038/s41586-020-03069-8. Epub 2020 Dec 23. Nature. 2021. PMID: 33361816 Free PMC article. - NSD3: A Promising Target for Cancer Therapy.
Huang T, Zhang B, Yang Y, Lin Q, Shao G. Huang T, et al. Cell Biochem Funct. 2025 Apr;43(4):e70071. doi: 10.1002/cbf.70071. Cell Biochem Funct. 2025. PMID: 40143436 Review. - NSD3 in Cancer: Unraveling Methyltransferase-Dependent and Isoform-Specific Functions.
Nuñez Y, Vera S, Baeza V, Gonzalez-Pecchi V. Nuñez Y, et al. Int J Mol Sci. 2024 Jan 12;25(2):944. doi: 10.3390/ijms25020944. Int J Mol Sci. 2024. PMID: 38256018 Free PMC article. Review.
Cited by
- Identification of mechanism of the oncogenic role of FGFR1 in papillary thyroid carcinoma.
Li XB, Li JL, Wang C, Zhang Y, Li J. Li XB, et al. Eur J Histochem. 2024 Jul 22;68(3):4048. doi: 10.4081/ejh.2024.4048. Eur J Histochem. 2024. PMID: 39037153 Free PMC article. - Deciphering the Immune-Tumor Interplay During Early-Stage Lung Cancer Development via Single-Cell Technology.
Chen WW, Liu W, Li Y, Wang J, Ren Y, Wang G, Chen C, Li H. Chen WW, et al. Front Oncol. 2022 Jan 3;11:716042. doi: 10.3389/fonc.2021.716042. eCollection 2021. Front Oncol. 2022. PMID: 35047383 Free PMC article. Review. - CENPE is a diagnostic and prognostic biomarker for cervical cancer.
Peng P, Zheng J, He K, Wang K, Wang L, Zheng X, Wu H, Yang Z, Zhang S, Zhao L. Peng P, et al. Heliyon. 2024 Dec 4;10(24):e40860. doi: 10.1016/j.heliyon.2024.e40860. eCollection 2024 Dec 30. Heliyon. 2024. PMID: 39759304 Free PMC article. - NSD3 protein methylation and stabilization transforms human ES cells into variant state.
Krishnamoorthy VK, Hamdani F, Shukla P, Rao RA, Anaitullah S, Biligiri KK, Kadumuri RV, Pothula PR, Chavali S, Rampalli S. Krishnamoorthy VK, et al. Life Sci Alliance. 2024 Dec 31;8(3):e202402871. doi: 10.26508/lsa.202402871. Print 2025 Mar. Life Sci Alliance. 2024. PMID: 39741006 Free PMC article. - Analyzing integrated network of methylation and gene expression profiles in lung squamous cell carcinoma.
Heryanto YD, Katayama K, Imoto S. Heryanto YD, et al. Sci Rep. 2022 Sep 22;12(1):15799. doi: 10.1038/s41598-022-20232-5. Sci Rep. 2022. PMID: 36138066 Free PMC article.
References
- Balsara BR et al. Comparative genomic hybridization analysis detects frequent, often high-level, overrepresentation of DNA sequences at 3q, 5p, 7p, and 8q in human non-small cell lung carcinomas. Cancer Res 57, 2116–2120 (1997). - PubMed
Publication types
MeSH terms
Substances
Grants and funding
- R35 GM139569/GM/NIGMS NIH HHS/United States
- I01 BX000286/BX/BLRD VA/United States
- R01 GM079641/GM/NIGMS NIH HHS/United States
- K99 CA255936/CA/NCI NIH HHS/United States
- P50 CA070907/CA/NCI NIH HHS/United States
- R01 CA236118/CA/NCI NIH HHS/United States
- R00 CA197816/CA/NCI NIH HHS/United States
- R01 CA236949/CA/NCI NIH HHS/United States
- R01 AG050997/AG/NIA NIH HHS/United States
- U54 CA224065/CA/NCI NIH HHS/United States
LinkOut - more resources
Full Text Sources
Other Literature Sources
Medical
Molecular Biology Databases
Research Materials
Miscellaneous
