Advanced Microscopy for Liver and Gut Ultrastructural Pathology in Patients with MVID and PFIC Caused by MYO5B Mutations - PubMed (original) (raw)
. 2021 Apr 28;10(9):1901.
doi: 10.3390/jcm10091901.
Iris M Krainer 2, Przemyslaw A Filipek 2, Barbara Witting 1, Karin Gutleben 1, Ilja Vietor 3, Heinz Zoller 4, Denise Aldrian 5, Ekkehard Sturm 6, James R Goldenring 7, Andreas R Janecke 5, Thomas Müller 5, Lukas A Huber 3, Georg F Vogel 3 5
Affiliations
- PMID: 33924896
- PMCID: PMC8125609
- DOI: 10.3390/jcm10091901
Advanced Microscopy for Liver and Gut Ultrastructural Pathology in Patients with MVID and PFIC Caused by MYO5B Mutations
Michael W Hess et al. J Clin Med. 2021.
Abstract
Mutations in the actin motor protein myosinVb (myo5b) cause aberrant apical cargo transport and the congenital enteropathy microvillus inclusion disease (MVID). Recently, missense mutations in myo5b were also associated with progressive familial intrahepatic cholestasis (MYO5B-PFIC). Here, we thoroughly characterized the ultrastructural and immuno-cytochemical phenotype of hepatocytes and duodenal enterocytes from a unique case of an adult MYO5B-PFIC patient who showed constant hepatopathy but only periodic enteric symptoms. Selected data from two other patients supported the findings. Advanced methods such as cryo-fixation, freeze-substitution, immuno-gold labeling, electron tomography and immuno-fluorescence microscopy complemented the standard procedures. Liver biopsies showed mislocalization of Rab11 and bile canalicular membrane proteins. Rab11-positive vesicles clustered around bile canaliculi and resembled subapical clusters of aberrant recycling endosomes in enterocytes from MVID patients. The adult patient studied in detail showed a severe, MVID-specific enterocyte phenotype, despite only a mild clinical intestinal presentation. This included mislocalization of numerous proteins essential for apical cargo transport and morphological alterations. We characterized the heterogeneous population of large catabolic organelles regarding their complex ultrastructure and differential distribution of autophagic and lysosomal marker proteins. Finally, we generated duodenal organoids/enteroids from biopsies that recapitulated all MVID hallmarks, demonstrating the potential of this disease model for personalized medicine.
Keywords: NHE3; Rab11a; congenital diarrheal disorder; high-pressure freezing; immuno-electron microscopy; myosinVb; organoid; progressive familial intrahepatic cholestasis; recycling endosome; syntaxin3.
Conflict of interest statement
The authors have declared that no conflict of interest exists.
Figures
Figure 1
Aberrant localization of apical proteins in MYO5B-PFIC enterocytes. Laser-scanning immuno-fluorescence micrographs of duodenal enterocytes of patient #1 show (a) apical and aberrant, subapical localization of mutated myo5b, subapical accumulation of Rab11 (b) and syntaxin3 (c), as well as cytoplasmic mislocalization of NHE3 (d) in comparison to controls. DPP4 localization (d) seems unaltered. Brush border microvilli indicated by actin staining; scale bars = 10 µm.
Figure 2
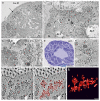
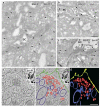
Ultrastructural MVID-phenotype in duodenal biopsy (bx #1) and enteroid samples (ent.) from MYO5B-PFIC patient #1. (a) Villus enterocytes from chemically fixed biopsy showing a microvillus inclusion (asterisk) and subapical clusters of aberrant, dark recycling endosomes (RE: arrows) specific for this disease [10]; N = nucleus; scale bar = 5 μm. (b) PAS-cytochemistry at EM-level detects strongly reactive compounds in aberrant RE; scale bar = 1 μm. (c) Cryo-fixed enteroid displaying MVID-specific, subapical RE clusters, as well as huge lysosomes (LY) and autophagolysosomes (ALY), but normal Golgi/TGN (arrow-heads); scale bar = 2 μm. (d) Light micrograph of cryo-fixed enteroid highlights the high vitality of those enterocytes; scale bar = 20 μm. (e) Distinct PAS-reaction of subapical RE in cryo-fixed enteroid; scale bar = 500 nm. (f–h) Electron tomographic reconstruction of 3D-architecture of subapical RE in cryo-fixed enteroids. 2D slice (f) from an electron tomographic reconstruction with red contour lining (g) and the resulting 3D model (h) of those organelles (see also Supplementary Movie M1); scale bars = 500 nm.
Figure 3
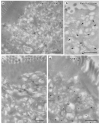
Immuno-gold EM of cryo-sections from formaldehyde-fixed duodenal biopsy and enteroid samples from MYO5B-PFIC patient #1. Corresponding mislocalization patterns of apical markers to aberrant subapical RE are evident in biopsy #1 (a,c) and enteroid (b,d); all scale bars = 500 nm. (a) Rab11 in biopsy visualized by 1.4nm Nanogold plus silver enhancement. (b) Rab11a in enteroid visualized by 5nm colloidal gold (arrows). (c) NHE3 in biopsy (enhanced Nanogold), (d) NHE3 in enteroid (enhanced Nanogold).
Figure 4
Synoptic illustration of immuno-gold and ultrastructural characteristics of duodenal biopsies and enteroids from MYO5B-PFIC patient #1. Compare this particular case with a respective synopsis of multiple MVID cases in Figure 2 of Ref. [10]. Drawing almost to scale. See also Supplementary Material Table S1.
Figure 5
Localization of myo5b in MYO5B-PFIC hepatocytes. Laser-scanning immuno-fluorescence micrographs (IF) of hepatocytes from patient #1 and #2 show regular localization of mutated myo5b to the apical plasma membrane compared to healthy controls. Bile canaliculus with microvilli indicated by actin staining; scale bars = 5 µm.
Figure 6
Localization of Rab11 in MYO5B-PFIC hepatocytes. IF of hepatocytes from patient #1 and #2 show subapical accumulation of Rab11 (arrow-heads) compared to healthy controls. Bile canaliculus with microvilli indicated by actin staining; scale bars = 5 µm.
Figure 7
Aberrant localization of apical proteins in MYO5B-PFIC hepatocytes. IF of hepatocytes of patient #1 and #2 show subapical accumulation of MRP2 (arrow-heads) in both patients compared to healthy controls. Bile canaliculus with microvilli indicated by actin staining; scale bars = 5 µm.
Figure 8
Aberrant localization of apical proteins in MYO5B-PFIC hepatocytes. IF of hepatocytes of patient #1 and #2 show subapical accumulation of BSEP in patient #2 (arrow-heads), but not in patient #1 and in healthy controls. Bile canaliculus with microvilli indicated by actin staining; scale bars = 5 µm.
Figure 9
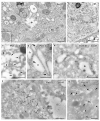
Ultrastructure and immuno-gold EM of aldehyde-fixed liver biopsies from MYO5B-PFIC patient #1 (a,c–f) and control (b,g). (a) Endomembrane compartments distinguished in MYO5B-PFIC sample comprise large, ribosome-decorated unstained cisternae (marked by stars), ill-defined “swollen membrane sacks” (marked by a cross: +), abundant small vesicles and lysosomes (LY). Mitochondria (M) appear normal, peroxisomes and locally occurring large lipid droplets (indicating steatosis) are not shown in this frame of apical hepatocyte area facing bile canaliculus (BC); scale bar = 1 μm. Insert shows a mitochondrion at higher magnification; scale bar = 200 nm. (b) Control biopsy with normal, well-organized Golgi stack/TGN (G). Note LY and peroxisome (PX) nearby; Scale bar = 1 μm (c) ER-marker PDI labels specifically 100–200 nm-wide, small vesicles/tubules (arrows) identifying sER; scale bar = 500 nm. (d) PDI labelling of ribosome decorated cisternae (stars), thus, rER, that display numerous 75 nm-wide buds (arrows), likely at ER-exit sites; scale bar = 500 nm. (e) Anti-TGN46 label (arrows) at cisternae (cross) and associated vesicles identifies “swollen membrane sacks” as dilated TGN; scale bar = 1 μm. (f) Rab 11 label clusters locally at, or in close vicinity of ≈150 nm-wide vesicles in the hepatocytes close to the bile canaliculus (BC); scale bar = 500 nm. (g) Normal Rab11 distribution (arrows) in control hepatocytes; scale bar = 500 nm.
Figure 10
Immuno-gold EM of cryo-sections and 3D reconstruction of subapical vesicle clusters in hepatocytes of biopsy from MYO5B-PFIC patient #1 (a,c–f) plus labeling control (b). (a) BSEP immuno-gold label (arrows) appears weak at the apical plasma membrane but abnormally enriched in the cytoplasm and/or at vesicles around the bile canaliculus; scale bar = 500 nm. (b) Bona fide normal BSEP distribution (arrows) concentrated at the plasma membrane of control hepatocytes; scale bar = 500 nm. (c) Very moderate, local mislocalization of MRP2 (arrows) in biopsy of patient #1; scale bar = 500 nm. (d–f) Electron tomographic reconstruction of 3D-architecture of subapical vesicles (plus rER cisternae) in hepatocytes of aldehyde-fixed, HPF/FS sample from patient #1. 2D slice (d) from an electron tomographic reconstruction with contour lining (e) of vesicles (red), rER (blue), plasma membrane (green) and the resulting 3D model (f); scale bars = 600 nm.
Figure 11
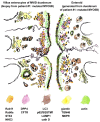
Synoptic view on a virtual (“compound”) bile canaliculus. The illustration compares the immuno-labeling patterns of cholestatic hepatocytes from patient #1 (with mutated MYO5B; shown on the left) with those of normal hepatocytes (shown on the right). Immuno-EM (EM) provided more detailed information in terms of structure and the precision of marker localization than immuno-fluorescence (IF). Partly mislocalized Rab11 and BSEP label is seen in cholestatic hepatocytes, whereas DPP4 and MRP2 are located normally. Drawing roughly to scale. See also Supplementary Material Table S1.
Similar articles
- MYO5B and bile salt export pump contribute to cholestatic liver disorder in microvillous inclusion disease.
Girard M, Lacaille F, Verkarre V, Mategot R, Feldmann G, Grodet A, Sauvat F, Irtan S, Davit-Spraul A, Jacquemin E, Ruemmele F, Rainteau D, Goulet O, Colomb V, Chardot C, Henrion-Caude A, Debray D. Girard M, et al. Hepatology. 2014 Jul;60(1):301-10. doi: 10.1002/hep.26974. Epub 2014 May 27. Hepatology. 2014. PMID: 24375397 - Abnormal Rab11-Rab8-vesicles cluster in enterocytes of patients with microvillus inclusion disease.
Vogel GF, Janecke AR, Krainer IM, Gutleben K, Witting B, Mitton SG, Mansour S, Ballauff A, Roland JT, Engevik AC, Cutz E, Müller T, Goldenring JR, Huber LA, Hess MW. Vogel GF, et al. Traffic. 2017 Jul;18(7):453-464. doi: 10.1111/tra.12486. Epub 2017 May 17. Traffic. 2017. PMID: 28407399 Free PMC article. - Editing Myosin VB Gene to Create Porcine Model of Microvillus Inclusion Disease, With Microvillus-Lined Inclusions and Alterations in Sodium Transporters.
Engevik AC, Coutts AW, Kaji I, Rodriguez P, Ongaratto F, Saqui-Salces M, Medida RL, Meyer AR, Kolobova E, Engevik MA, Williams JA, Shub MD, Carlson DF, Melkamu T, Goldenring JR. Engevik AC, et al. Gastroenterology. 2020 Jun;158(8):2236-2249.e9. doi: 10.1053/j.gastro.2020.02.034. Epub 2020 Feb 26. Gastroenterology. 2020. PMID: 32112796 Free PMC article. - Altered MYO5B Function Underlies Microvillus Inclusion Disease: Opportunities for Intervention at a Cellular Level.
Bowman DM, Kaji I, Goldenring JR. Bowman DM, et al. Cell Mol Gastroenterol Hepatol. 2022;14(3):553-565. doi: 10.1016/j.jcmgh.2022.04.015. Epub 2022 Jun 1. Cell Mol Gastroenterol Hepatol. 2022. PMID: 35660026 Free PMC article. Review. - MYO5B, STX3, and STXBP2 mutations reveal a common disease mechanism that unifies a subset of congenital diarrheal disorders: A mutation update.
Dhekne HS, Pylypenko O, Overeem AW, Zibouche M, Ferreira RJ, van der Velde KJ, Rings EHHM, Posovszky C, van der Sluijs P, Swertz MA, Houdusse A, van IJzendoorn SCD. Dhekne HS, et al. Hum Mutat. 2018 Mar;39(3):333-344. doi: 10.1002/humu.23386. Epub 2018 Jan 17. Hum Mutat. 2018. PMID: 29266534 Free PMC article. Review.
Cited by
- Modeling the cell biology of monogenetic intestinal epithelial disorders.
Kaji I, Thiagarajah JR, Goldenring JR. Kaji I, et al. J Cell Biol. 2024 Jul 1;223(7):e202310118. doi: 10.1083/jcb.202310118. Epub 2024 Apr 29. J Cell Biol. 2024. PMID: 38683247 Free PMC article. Review. - Long-Term Results of Pediatric Liver Transplantation for Progressive Familial Intrahepatic Cholestasis.
Hang C, Jin Y, Luo Y, Feng M, Zhou T, Zhu J, Zhang J, Liu Y, Xia Q. Hang C, et al. J Clin Med. 2022 Aug 11;11(16):4684. doi: 10.3390/jcm11164684. J Clin Med. 2022. PMID: 36012923 Free PMC article. - Applications of human organoids in the personalized treatment for digestive diseases.
Wang Q, Guo F, Jin Y, Ma Y. Wang Q, et al. Signal Transduct Target Ther. 2022 Sep 27;7(1):336. doi: 10.1038/s41392-022-01194-6. Signal Transduct Target Ther. 2022. PMID: 36167824 Free PMC article. Review. - Case Report: MYO5B Homozygous Variant c.2090+3A>T Causes Intron Retention Related to Chronic Cholestasis and Diarrhea.
Zheng Y, Peng Y, Zhang S, Zhao H, Chen W, Yang Y, Hu Z, Yin Q, Peng Y. Zheng Y, et al. Front Genet. 2022 May 30;13:872836. doi: 10.3389/fgene.2022.872836. eCollection 2022. Front Genet. 2022. PMID: 35706451 Free PMC article. - Structural basis of autoinhibition of the human NHE3-CHP1 complex.
Dong Y, Li H, Ilie A, Gao Y, Boucher A, Zhang XC, Orlowski J, Zhao Y. Dong Y, et al. Sci Adv. 2022 May 27;8(21):eabn3925. doi: 10.1126/sciadv.abn3925. Epub 2022 May 25. Sci Adv. 2022. PMID: 35613257 Free PMC article.
References
- Qidwai K., Afkhami M., Day C.E. The pathologist’s guide to fixatives. Methods Mol. Biol. 2014;1180:21–30. - PubMed
- Geller S.A. Liver: Tissue handling and evaluation. Methods Mol. Biol. 2014;1180:303–321. - PubMed
- Ruemmele F.M., Müller T., Schiefermeier N., Ebner H.L., Lechner S., Pfaller K., Thöni C.E., Goulet O., Lacaille F., Schmitz J., et al. Loss-of-function of MYO5B is the main cause of microvillus inclusion disease: 15 novel mutations and a CaCo-2 RNAi cell model. Hum. Mutat. 2010;31:544–551. doi: 10.1002/humu.21224. - DOI - PubMed
- Wiegerinck C.L., Janecke A.R., Schneeberger K., Vogel G.F., Van Haaften-Visser D.Y., Escher J.C., Adam R., Thöni C.E., Pfaller K., Jordan A.J., et al. Loss of Syntaxin 3 causes variant microvillus inclusion disease. Gastroenterology. 2014;147:65–68.e10. doi: 10.1053/j.gastro.2014.04.002. - DOI - PubMed
Grants and funding
- R01 DK048370/DK/NIDDK NIH HHS/United States
- SFB021/Austrian Science Fund
- 18019/Jubiläumsfonds der Österreichischen Nationalbank
- RC2 DK118640/NH/NIH HHS/United States
- RC2 DK118640/DK/NIDDK NIH HHS/United States
- R01 DK48370/NH/NIH HHS/United States
- 16678/Jubiläumsfonds der Österreichischen Nationalbank
- P30 DK058404/DK/NIDDK NIH HHS/United States
- 0404/2386/Tiroler Wissenschaftsfonds
LinkOut - more resources
Full Text Sources
Other Literature Sources

