RIP1 Perturbation Induces Chondrocyte Necroptosis and Promotes Osteoarthritis Pathogenesis via Targeting BMP7 - PubMed (original) (raw)
RIP1 Perturbation Induces Chondrocyte Necroptosis and Promotes Osteoarthritis Pathogenesis via Targeting BMP7
Jin Cheng et al. Front Cell Dev Biol. 2021.
Abstract
Osteoarthritis (OA) is a highly prevalent and debilitating joint disorder that characterized by progressive destruction of articular cartilage. There is no effective disease-modifying therapy for the condition due to limited understanding of the molecular mechanisms on cartilage maintenance and destruction. Receptor-interacting protein kinase 1 (RIP1)-mediated necroptosis plays a vital role in various diseases, but the involvement of RIP1 in OA pathogenesis remains largely unknown. Here we show that typical necrotic cell morphology is observed within human OA cartilage samples in situ, and that RIP1 is significantly upregulated in cartilage from both OA patients and experimental OA rat models. Intra-articular RIP1 overexpression is sufficient to induce structural and functional defects of cartilage in rats, highlighting the crucial role of RIP1 during OA onset and progression by mediating chondrocyte necroptosis and disrupting extracellular matrix (ECM) metabolism homeostasis. Inhibition of RIP1 activity by its inhibitor necrostatin-1 protects the rats from trauma-induced cartilage degradation as well as limb pain. More importantly, we identify bone morphogenetic protein 7 (BMP7) as a novel downstream target that mediates RIP1-induced chondrocyte necroptosis and OA manifestations, thereby representing a non-canonical regulation mode of necroptosis. Our study supports a model whereby the activation of RIP1-BMP7 functional axis promotes chondrocyte necroptosis and subsequent OA pathogenesis, thus providing a new therapeutic target for OA.
Keywords: cartilage; chondrocyte; extracellular matrix; necroptosis; osteoarthritis; receptor-interacting protein kinase 1.
Copyright © 2021 Cheng, Duan, Fu, Jiang, Yang, Cao, Li, Zhang, Hu, Zhang and Ao.
Conflict of interest statement
The authors declare that the research was conducted in the absence of any commercial or financial relationships that could be construed as a potential conflict of interest.
Figures
FIGURE 1
Chondrocyte necrosis and RIP1 upregulation are both presented in OA cartilage tissues. (A,B) Representative photomicrographs (A) and quantitative data (B) of chondral EBD uptake (red) in healthy and OA human cartilage (n = 6 for each group). Cell nuclei were labeled by Hoechst. (C) LDH concentrations in the cultural supernatant of healthy and OA human cartilage explants cultured ex vivo for 10 days (n = 5 for each group). (D) Representative TEM images of healthy and OA human cartilage. (E) Safranin O staining of healthy and OA human cartilage (n = 10 for each group). (F,G) The integrated optical density (IOD) value (F) and positive staining area (%) (G) of proteoglycan content in healthy and OA human cartilage tissues determined by safranin O staining (n = 10 for each group). (H) RIP1 immunostaining of healthy and OA human cartilage (n = 10 for each group). (I) The IOD value of RIP1 immunostaining in healthy and OA human cartilage tissues (n = 10 for each group). (J) The mRNA level of RIP1 in primary chondrocytes derived from healthy and OA human cartilage tissues measured by qRT-PCR (n = 10 for each group). (K) Safranin O staining and RIP1 immunostaining of cartilage from sham- and ACLT-operated rats (n = 10 for each group). (L) Safranin O staining and RIP1 immunostaining of cartilage from 3- and 12-month old rats (n = 10 for each group). (M) RIP1 immunofluorescent staining of rat chondrocytes treated with or without 10 ng/mL IL-1β for 24 h (n = 3 for each group; three independent experiments). **P < 0.01 and ***P < 0.001.
FIGURE 2
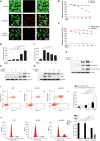
Overexpression of RIP1 in chondrocytes causes necroptosis and apoptosis. (A) Live-dead staining of rat chondrocytes treated with Ad-Ctl (100 MOI), Ad-Rip1, or Ad-Rip1 with 50 μM Nec-1 (n = 3 for each group). Green fluorescence: live cells; red fluorescence: dead cells. (B) Relative cell viability of rat chondrocytes assessed by CCK-8 assay after treatment with indicated MOI of Ad-Ctl or Ad-Rip1 for 24 h (n = 6 for each group). (C) Relative cell viability of rat chondrocytes assessed by CCK-8 assay after treatment with indicated doses of TNF-α with or without 50 μM Nec-1 for 24 h (n = 6 for each group). (D) LDH concentrations in the cultural supernatant of rat chondrocytes treated with Ad-Ctl (100, 200 MOI) or Ad-Rip1 for 24 h (n = 3 for each group; three independent experiments). (E) The protein levels of RIP1 and RIP3 detected by western blotting assay in rat chondrocytes treated with Ad-Ctl (100, 200 MOI) or Ad-Rip1 for 24 h. (F) LDH concentrations in the cultural supernatant of rat chondrocytes treated with Ad-Ctl (100 MOI), Ad-Rip1 or Ad-Rip1 and Nec-1 (50, 100, and 200 μM) for 24 h (n = 3 for each group; three independent experiments). (G) The protein levels of RIP1 and RIP3 detected by western blotting assay in rat chondrocytes treated with Ad-Ctl (100 MOI), Ad-Rip1 or Ad-Rip1 and Nec-1 (50, 100, and 200 μM) for 24 h. (H) The protein levels of RIP1 and cleaved PARP and cleaved caspase-3 detected by western blotting assay in rat chondrocytes treated with Ad-Ctl (100, 200 MOI) or Ad-Rip1 for 48 h. (I) Necrotic and apoptotic rat chondrocytes stained by annexin V and PI and analyzed by flow cytometry after treatment with Ad-Ctl (100 MOI) or Ad-Rip1 for 24 h, rat chondrocytes without treatment were used as negative control (n = 3 for each group; three independent experiments). (J) Cell cycle distribution of rat chondrocytes treated with Ad-Ctl (100 MOI) or Ad-Rip1 for 24 h, rat chondrocytes without treatment were used as negative control (n = 3 for each group; three independent experiments). *P < 0.05 and **P < 0.01.
FIGURE 3
RIP1 promotes catabolism and inhibits anabolism in chondrocytes. (A) The mRNA levels of ECM-related biomarkers Mmp1, Mmp13, Il6, Acan, Col2a1, and Sox9 in rat chondrocytes treated with Ad-Ctl (100, 200 MOI) or Ad-Rip1 for 24 h (n = 5 for each group; three independent experiments). (B) The protein levels of MMP1, MMP13, IL6, COL2A1, SOX9, and RIP1 detected by western blotting assay in rat chondrocytes treated with Ad-Ctl (100, 200 MOI) or Ad-Rip1 for 24 h. (C,D) The concentration of GAG in cartilage explants (C) and the concentration of COMP released from the explants (D) treated with Ad-Ctl (100 MOI), Ad-Rip1 or Ad-Rip1 and Nec-1 (50 and 100 μM) for 10 days (n = 6 for each group). (E) Toluidine blue staining of the cartilage explants treated with Ad-Ctl (100 MOI), Ad-Rip1 or Ad-Rip1 and Nec-1 (100 μM) for 10 days (n = 6 for each group). (F) Alcian blue staining of the chondrocytes treated with Ad-Ctl (100 MOI), Ad-Rip1 or Ad-Rip1 and Nec-1 (100 μM) for 24 h (n = 6 for each group). *P < 0.05, **P < 0.01, and ***P < 0.001.
FIGURE 4
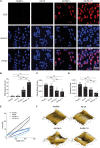
Intra-articular injection of Ad-Rip1 causes chondrocyte necroptosis and impaired biomechanical properties of rat cartilage. (A,B) Representative photomicrographs (A) and quantitative data (B) of chondral EBD uptake (red) in cartilage from rats intra-articularly injected with Ad-Ctl (5 × 10⁸ pfu) and two different doses of Ad-Rip1 (108 pfu, 5 × 10⁸ pfu) (n = 6 for each group). Cell nuclei were labeled by Hoechst. (C–F) Elastic modulus (C), hardness (D), load-displacement curves (E), and microscopic geomorphology (F) of cartilage surface from rats intra-articularly injected with Ad-Ctl (5 × 10⁸ pfu) and two different doses of Ad-Rip1 (108 pfu, 5 × 10⁸ pfu) evaluated by nanoindentation test (n = 5 for each group). *P < 0.05 and **P < 0.01.
FIGURE 5
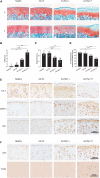
Intra-articular overexpression of RIP1 induces OA-related symptoms in rats. (A,B) Safranin O and fast green staining (A) and the corresponding OARSI scores (B) of the cartilage from rats intra-articularly injected with Ad-Ctl (5 × 10⁸ pfu) and two different doses of Ad-Rip1 (108 pfu, 5 × 10⁸ pfu) (n = 5 for each group) F: femur; T: tibia. (C) The pain response times for the rats of each group when placed on the 55°C hotplate meter (n = 6 for each group). (D) The ratios of weight placed on the hindlimb with adenovirus injection vs. that on the contralateral sham hindlimb for the rats of each group (n = 6 for each group). (E) COL II, MMP13, and RIP1 immunostaining of the cartilage from rats intra-articularly injected with Ad-Ctl (5 × 10⁸ pfu) and two different doses of Ad-Rip1 (108 pfu, 5 × 10⁸ pfu) (n = 5 for each group). (F) RIP3 immunostaining and TUNEL staining of the cartilage from rats intra-articularly injected with Ad-Ctl (5 × 10⁸ pfu) and two different doses of Ad-Rip1 (108 pfu, 5 × 10⁸ pfu) (n = 5 for each group). *P < 0.05, **P < 0.01, and ***P < 0.001.
FIGURE 6
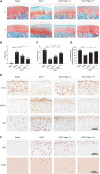
Inhibition of RIP1 enzymatic activity by Nec-1 blocks OA cartilage destruction and the related pain. (A,B) Safranin O and fast green staining (A) and the corresponding OARSI scores (B) of the cartilage from rats with sham or ACLT surgery following by intra-articular injection of vehicle control or two different doses of Nec-1 (0.025 and 0.05 mg/kg) (n = 5 for each group) F, femur; T, tibia. (C) The pain response times for the rats of each group when placed on the 55°C hotplate meter (n = 6 for each group). (D) The ratios of weight placed on the operated hindlimb vs. that on the contralateral sham hindlimb for the rats of each group (n = 6 for each group). (E) COL II, MMP13, and RIP1 immunostaining of the cartilage from rats with sham or ACLT surgery following by intra-articular injection of vehicle control or two different doses of Nec-1 (0.025 and 0.05 mg/kg) (n = 5 for each group). (F) RIP3 immunostaining and TUNEL staining of the cartilage from rats with sham or ACLT surgery following by intra-articular injection of vehicle control or two different doses of Nec-1 (0.025 and 0.05 mg/kg) (n = 5 for each group). *P < 0.05, and ***P < 0.001.
FIGURE 7
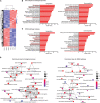
Chondrocyte transcriptome after RIP1 overexpression determined by RNA-seq. (A) Heatmap of differential expressed genes in rat chondrocytes treated with Ad-Ctl (100 MOI) or Ad-Rip1 for 24 h (n = 3 for each group). (B,C) GO analysis (B) and pathway analysis (C) for differentially expressed genes of rat chondrocyte transcriptome. (D) Enrichment map generated for graphical representations of top 30 enriched biological processes and KEGG pathways.
FIGURE 8
BMP7 mediates RIP1-induced OA pathological signatures in chondrocytes. (A) The mRNA levels of Bmp2, Bmp6, and Bmp7 in rat chondrocytes treated with Ad-Ctl (100, 200 MOI) or Ad-Rip1 for 24 h (n = 4 for each group; three independent experiments). (B) The concentration of secreted BMP7 in the cultural supernatant of rat chondrocytes treated with Ad-Ctl (100, 200 MOI) or Ad-Rip1 for 48 h (n = 3 for each group; three independent experiments). (C) Alizarin red staining of rat chondrocytes treated with Ad-Ctl (100 MOI) or Ad-Rip1 for 48 h (n = 4 for each group). (D) LDH concentration in the cultural supernatant of rat chondrocytes treated with indicated doses of recombinant BMP7 for 24 h (n = 4 for each group). (E) The protein level of RIP3 in rat chondrocytes treated with indicated doses of recombinant BMP7 for 24 h. (F) The mRNA and protein levels of BMP7 in rat chondrocytes transfected with scrambled or BMP7-targeted siRNAs (n = 4 for each group). (G) LDH concentration in the cultural supernatant of rat chondrocytes treated with Ad-Ctl (100 MOI) or Ad-Rip1 following by transfection of BMP7-targeted siRNAs (n = 4 for each group). (H) The protein levels of RIP1, RIP3, and BMP7 in rat chondrocytes treated with Ad-Ctl (100 MOI) or Ad-Rip1 following by transfection of BMP7-targeted siRNA. (I) The mRNA level of Rip3 in rat chondrocytes treated with Ad-Ctl (100 MOI) or Ad-Rip1 following by transfection of BMP7-targeted siRNA (n = 4 for each group; three independent experiments). (J) The mRNA levels of Mmp1, Mmp13, Il6, Acan, Col2a1, and Sox9 in rat chondrocytes treated with Ad-Ctl (100 MOI) or Ad-Rip1 following by transfection of BMP7-targeted siRNA (n = 4 for each group; three independent experiments). *P < 0.05, **P < 0.01, and ***P < 0.001.
Similar articles
- Necrostatin-1 ameliorates adjuvant arthritis rat articular chondrocyte injury via inhibiting ASIC1a-mediated necroptosis.
Chen Y, Zhu CJ, Zhu F, Dai BB, Song SJ, Wang ZQ, Feng YB, Ge JF, Zhou RP, Chen FH. Chen Y, et al. Biochem Biophys Res Commun. 2018 Oct 12;504(4):843-850. doi: 10.1016/j.bbrc.2018.09.031. Epub 2018 Sep 12. Biochem Biophys Res Commun. 2018. PMID: 30219231 - Receptor-interacting protein 1 inhibition prevents mechanical stress-induced temporomandibular joint osteoarthritis by regulating apoptosis and later-stage necroptosis of chondrocytes.
Zhou Y, Lin S, Huang Z, Zhang C, Wang H, Li B, Li H. Zhou Y, et al. Arch Oral Biol. 2023 Mar;147:105612. doi: 10.1016/j.archoralbio.2022.105612. Epub 2022 Dec 28. Arch Oral Biol. 2023. PMID: 36603515 - Mechanical force-mediated pathological cartilage thinning is regulated by necroptosis and apoptosis.
Zhang C, Lin S, Li T, Jiang Y, Huang Z, Wen J, Cheng W, Li H. Zhang C, et al. Osteoarthritis Cartilage. 2017 Aug;25(8):1324-1334. doi: 10.1016/j.joca.2017.03.018. Epub 2017 Apr 7. Osteoarthritis Cartilage. 2017. PMID: 28396243 - Chondrocyte Apoptosis in the Pathogenesis of Osteoarthritis.
Hwang HS, Kim HA. Hwang HS, et al. Int J Mol Sci. 2015 Oct 30;16(11):26035-54. doi: 10.3390/ijms161125943. Int J Mol Sci. 2015. PMID: 26528972 Free PMC article. Review. - Molecular regulation of articular chondrocyte function and its significance in osteoarthritis.
Schroeppel JP, Crist JD, Anderson HC, Wang J. Schroeppel JP, et al. Histol Histopathol. 2011 Mar;26(3):377-94. doi: 10.14670/HH-26.377. Histol Histopathol. 2011. PMID: 21210351 Review.
Cited by
- Targeting Cell Death: Pyroptosis, Ferroptosis, Apoptosis and Necroptosis in Osteoarthritis.
Yang J, Hu S, Bian Y, Yao J, Wang D, Liu X, Guo Z, Zhang S, Peng L. Yang J, et al. Front Cell Dev Biol. 2022 Jan 18;9:789948. doi: 10.3389/fcell.2021.789948. eCollection 2021. Front Cell Dev Biol. 2022. PMID: 35118075 Free PMC article. Review. - Identification of SLC3A2 as a Potential Therapeutic Target of Osteoarthritis Involved in Ferroptosis by Integrating Bioinformatics, Clinical Factors and Experiments.
Liu H, Deng Z, Yu B, Liu H, Yang Z, Zeng A, Fu M. Liu H, et al. Cells. 2022 Oct 30;11(21):3430. doi: 10.3390/cells11213430. Cells. 2022. PMID: 36359826 Free PMC article. - RIPK3 deficiency blocks R-2-hydroxyglutarate-induced necroptosis in IDH-mutated AML cells.
Zhu S, Luo Y, Li K, Mei C, Wang Y, Jiang L, Wang W, Zhang Q, Yang W, Lang W, Zhou X, Wang L, Ren Y, Ma L, Ye L, Huang X, Chen J, Sun J, Tong H. Zhu S, et al. Sci Adv. 2024 Apr 19;10(16):eadi1782. doi: 10.1126/sciadv.adi1782. Epub 2024 Apr 17. Sci Adv. 2024. PMID: 38630819 Free PMC article. - SCP2 mediates the transport of lipid hydroperoxides to mitochondria in chondrocyte ferroptosis.
Dai T, Xue X, Huang J, Yang Z, Xu P, Wang M, Xu W, Feng Z, Zhu W, Xu Y, Chen J, Li S, Meng Q. Dai T, et al. Cell Death Discov. 2023 Jul 8;9(1):234. doi: 10.1038/s41420-023-01522-x. Cell Death Discov. 2023. PMID: 37422468 Free PMC article. - Selumetinib - a potential small molecule inhibitor for osteoarthritis treatment.
Zheng X, Qiu J, Pan W, Gong Y, Zhang W, Jiang T, Chen L, Chen W, Hong Z. Zheng X, et al. Front Pharmacol. 2022 Sep 27;13:938133. doi: 10.3389/fphar.2022.938133. eCollection 2022. Front Pharmacol. 2022. PMID: 36238555 Free PMC article.
References
LinkOut - more resources
Full Text Sources
Other Literature Sources
Molecular Biology Databases
Miscellaneous

