Ablation of dynamin-related protein 1 promotes diabetes-induced synaptic injury in the hippocampus - PubMed (original) (raw)
doi: 10.1038/s41419-021-03723-7.
Gyeongah Park 1 2 3, Hye Min Han 4, Hyeong Seok An 1 2, Zhen Jin 1 2 3, Eun Ae Jeong 1 2, Kyung Eun Kim 1 2, Hyun Joo Shin 1 2, Jaewoong Lee 1 2, Dawon Kang 2 5, Hyun Joon Kim 1 2, Yong Chul Bae 4, Gu Seob Roh 6 7
Affiliations
- PMID: 33953167
- PMCID: PMC8099876
- DOI: 10.1038/s41419-021-03723-7
Ablation of dynamin-related protein 1 promotes diabetes-induced synaptic injury in the hippocampus
Gyeongah Park et al. Cell Death Dis. 2021.
Erratum in
- Correction: Ablation of dynamin-related protein 1 promotes diabetes-induced synaptic injury in the hippocampus.
Park G, Lee JY, Han HM, An HS, Jin Z, Jeong EA, Kim KE, Shin HJ, Lee J, Kang D, Kim HJ, Bae YC, Roh GS. Park G, et al. Cell Death Dis. 2021 Jun 1;12(6):565. doi: 10.1038/s41419-021-03841-2. Cell Death Dis. 2021. PMID: 34075023 Free PMC article. No abstract available.
Abstract
Dynamin-related protein 1 (Drp1)-mediated mitochondrial dysfunction is associated with synaptic injury in the diabetic brain. However, the dysfunctional mitochondria by Drp1 deletion in the diabetic brain are poorly understood. Here, we investigated the effects of neuron-specific Drp1 deletion on synaptic damage and mitophagy in the hippocampus of a high-fat diet (HFD)/streptozotocin (STZ)-induced diabetic mice. HFD/STZ-induced diabetic mice exhibited metabolic disturbances and synaptic damages. Floxed Drp1 mice were crossed with Ca2+/calmodulin-dependent protein kinase IIα (CaMKIIα)-Cre mice, to generate neuron-specific Drp1 knockout (Drp1cKO) mice, which showed marked mitochondrial swelling and dendritic spine loss in hippocampal neurons. In particular, diabetic Drp1cKO mice exhibited an increase in dendritic spine loss and higher levels of oxidative stress and neuroinflammation compared with diabetic wild-type (WT) mice. Diabetic WT mice generally displayed increased Drp1-induced small mitochondrial morphology in hippocampal neurons, but large mitochondria were prominently observed in diabetic Drp1cKO mice. The levels of microtubule-associated protein 1 light-chain 3 and lysosomal-associated membrane protein 1 proteins were significantly increased in the hippocampus of diabetic Drp1cKO mice compared with diabetic WT mice. The inhibition of Drp1 adversely promotes synaptic injury and neurodegeneration in the diabetic brain. The findings suggest that the exploratory mechanisms behind Drp1-mediated mitochondrial dysfunction could provide a possible therapeutic target for diabetic brain complications.
Conflict of interest statement
The authors declare no competing interests.
Figures
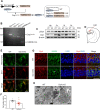
Fig. 1. Drp1cKO mice exhibit alterations in neuronal mitochondrial morphology.
A Breeding and Drp1 knockout (KO) strategy using the Cre/loxP system. B PCR analysis was performed on Drp1 lox/lox and CaMKIIα-Cre mice. C Western blotting of pDrp1 and Drp1 levels in the hippocampus (Hip), crerebral cortex (Cx), striatum (St), and cerebellum (Cb). D Schematic coronal section illustrating the mouse brain in the hippocampal CA1 region. E Representative staining of Drp1 (red) and mitochondria (green) in the hippocampal CA1 region of wild-type (WT) and CaMKIIα-Cre; Drp1 lox/lox (Drp1cKO) mice. Scale bar = 5 µm. F The number of Drp1-positive neurons in the hippocampal CA1 region. G Representative staining of Drp1 (red) and glutamate decarboxylase 65 (GAD65, green) in the hippocampal CA1 region of WT and Drp1cKO mice. Nuclei were counterstained with DAPI (blue). Scale bar = 25 µm. White arrow indicates Drp1-positive GAD65 expression GABAergic neuron. H Representative electron microscopic images showing mitochondrial morphology in WT and Drp1cKO mice. Magnification 30,000×. Scale bar = 0.5 µm. N nucleus. Data are shown as the mean ± SEM. The indicated p values represent unpaired _t_-test in F. *p < 0.05 vs WT mice.
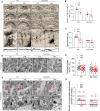
Fig. 2. Effects of Drp1 deletion on synaptic damage in the hippocampus of HFD/STZ-treated mice.
A Representative microphotographs of Golgi-stained hippocampus sections from WT and Drp1cKO mice, fed with either ND (CTL) or HFD/STZ (DM). Golgi-stained neurons were visualized in the hippocampal regions (n = 3 mice per group). High-magnification images (in lowest panels) from red box in upper panels. Scale bar = 200 µm. B Spine numbers and C spine density in hippocampal CA1 neurons. D Representative EM images showing the numbers of synapses in the longitudinal cross-section of an axon. Scale bar = 0.5 µm (n = 3 mice per group). White arrows indicate synapses. E Synapse counts in the hippocampus. F Representative EM images showing the number of mitochondria in the presynaptic region. High-magnification images (in lower panels) from red box in upper panels. Magnification 30,000×. Scale bar = 0.5 µm. G Measurements of mitochondrial numbers in the presynaptic region. Data are shown as the mean ± SEM. The indicated p values represent a two-way ANOVA followed by Tukey’s post hoc test. *p < 0.05 vs WT CTL; †p < 0.05 vs WT DM.
Fig. 3. Effects of Drp1 deletion on oxidative stress and neuroinflammation in the hippocampus of HFD/STZ-induced diabetic mice.
A, B Western blot and protein quantification analysis of nuclear (nu-) Nrf2 (A) and HO-1 (B) expression in the hippocampus (n = 3–4 mice per group). Densitometry values for Nrf2 and HO-1 were normalized against those for nuclear marker p84 and loading control marker β–actin, respectively. C Representative double immunofluorescence for HO-1 (red) and NeuN (green) (n = 3 mice per group). The intensity of HO-1 immunostained neurons in the hippocampal CA1 region were measured and presented as the fold change. Scale bar = 20 µm. D Western blot and protein quantification of nuclear (nu-) NF-κBp65 expression in the hippocampus (n = 3–4 mice per group). Densitometry value for NF-κBp65 was normalized against that for nuclear marker p84. E Representative images of immunofluorescence for Iba-1 (red) and GFAP (green) in the hippocampal CA1 regions. The intensity of Iba-1 F and GFAP G immunofluorescence. Scale bar = 20 µm. Data are shown as the mean ± SEM. The indicated p values represent a two-way ANOVA followed by Tukey’s post hoc test. *p < 0.05 vs WT CTL; †p < 0.05 vs WT DM.
Fig. 4. Effects of Drp1 deletion on mitochondrial dysfunction in CA1 hippocampal neurons in diabetic mice.
A Western blot analysis of pDrp1 and Drp1 expression, using β-actin as a reference protein (n = 3–4 each group). B Western blot showing mitochondrial (mito-) pDrp1 expression from mitochondrial extract of the hippocampus. Densitometry values for pDrp1 were normalized against those for mitochondrial marker VDAC1 (n = 3–4 each group). C Representative images of immunofluorescence staining against pDrp1 (red) and mitochondria (green) in the hippocampal CA1 region. Nuclei were counterstained with DAPI (blue) (n = 3 mice per group). The pDrp1-positive cells in the hippocampus were measured and presented as the fold change. Scale bar = 20 µm. D Western blots and quantification of OXPHOS in the hippocampus (n = 3–4 mice per group). Densitometry values for OXPHOS were normalized against those for mitochondrial marker VDAC1 (n = 3–4 each group). E Representative electron microscopy images showing mitochondrial morphology in CA1 hippocampal neurons (n = 3 mice per group). N nucleus. Magnification, 10,000×. Scale bar = 1 µm. F, G Measurements of mitochondrial size (F) and mitochondrial numbers (G) in the CA1 pyramidal neuron layer or the stratum pyramidale. The indicated p values represent a two-way ANOVA followed by Tukey’s post hoc test. Data are shown as the mean ± SEM. *p < 0.05 vs WT CTL; †p < 0.05 vs WT DM.
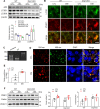
Fig. 5. Effect of Drp1 deletion on mitochondrial autophagy in CA1 hippocampal neurons of diabetic mice.
A Western blot analysis results showing the hippocampal p62 and LC3BI/II expression levels using β-actin as a loading control (n = 3–4 mice per group). B Representative double immunostaining of VDAC1 (red) and LC3B (green). Scale bar = 50 µm. C PCR analysis from the mt-Keima (Tg+/+) and WT (Tg–/–) mice was performed. D Representative confocal images showing mitophagy (Red pixel). Nuclei were counterstained with DAPI (blue). Scale bar = 10 µm. E Relative mt-Keima red signal in the hippocampal CA1 regions of CTL and DM mt-Keima (Tg+/+) mice. Values are normalized to CTL levels of mitophagy (p = 0.0003). F Western blot analysis results showing the hippocampal PINK1 and Parkin expression levels from mitochondrial extracts using mitochondrial marker VDAC1 as a loading control (n = 3–4 mice per group). The indicated p values represent a two-way ANOVA followed by Tukey’s post hoc test. Data are shown as the mean ± SEM. *p < 0.05 vs WT CTL; †p < 0.05 vs WT DM.
Fig. 6. Effects of Drp1 deletion on mitochondrial autophagosome and lysosome in CA1 hippocampal neurons of diabetic mice.
A Representative EM images showing autophagosome and B autolysosome sizes in CA1 hippocampal neurons from WT CTL, WT DM, Drpc1KO CTL, and Drp1cKO DM mice (n = 3 mice per group). Red arrow heads indicate autophagosomes containing small or large mitochondria. N nucleus. Magnification, 30,000×. Scale bar = 0.5 µm. C Western blot showing LAMP1 expression. D Representative staining of LAMP1 (red) in the hippocampal CA1 region. High-magnification images (in lower panels) from white box in upper panels. Nuclei were counterstained with DAPI (blue). The intensity of LAMP1 immunofluorescence in the hippocampus was measured and presented as the fold change. Scale bar = 50 µm. The indicated p values represent a two-way ANOVA followed by Tukey’s post hoc test. Data are shown as the mean ± SEM. *p < 0.05 vs WT CTL; †p < 0.05 vs WT DM.
Similar articles
- Dynamin-related protein 1 is required for normal mitochondrial bioenergetic and synaptic function in CA1 hippocampal neurons.
Shields LY, Kim H, Zhu L, Haddad D, Berthet A, Pathak D, Lam M, Ponnusamy R, Diaz-Ramirez LG, Gill TM, Sesaki H, Mucke L, Nakamura K. Shields LY, et al. Cell Death Dis. 2015 Apr 16;6(4):e1725. doi: 10.1038/cddis.2015.94. Cell Death Dis. 2015. PMID: 25880092 Free PMC article. - Inhibition of dynamin-related protein 1 protects against myocardial ischemia-reperfusion injury in diabetic mice.
Ding M, Dong Q, Liu Z, Liu Z, Qu Y, Li X, Huo C, Jia X, Fu F, Wang X. Ding M, et al. Cardiovasc Diabetol. 2017 Feb 7;16(1):19. doi: 10.1186/s12933-017-0501-2. Cardiovasc Diabetol. 2017. PMID: 28173848 Free PMC article. - Dynamics of Dynamin-Related Protein 1 in Alzheimer's Disease and Other Neurodegenerative Diseases.
Oliver D, Reddy PH. Oliver D, et al. Cells. 2019 Aug 23;8(9):961. doi: 10.3390/cells8090961. Cells. 2019. PMID: 31450774 Free PMC article. Review. - Dynamin-related protein 1: A protein critical for mitochondrial fission, mitophagy, and neuronal death in Parkinson's disease.
Feng ST, Wang ZZ, Yuan YH, Wang XL, Sun HM, Chen NH, Zhang Y. Feng ST, et al. Pharmacol Res. 2020 Jan;151:104553. doi: 10.1016/j.phrs.2019.104553. Epub 2019 Nov 21. Pharmacol Res. 2020. PMID: 31760107 Review.
Cited by
- GSDMD/Drp1 signaling pathway mediates hippocampal synaptic damage and neural oscillation abnormalities in a mouse model of sepsis-associated encephalopathy.
Fu Q, Zhang YB, Shi CX, Jiang M, Lu K, Fu ZH, Ruan JP, Wu J, Gu XP. Fu Q, et al. J Neuroinflammation. 2024 Apr 16;21(1):96. doi: 10.1186/s12974-024-03084-w. J Neuroinflammation. 2024. PMID: 38627764 Free PMC article. - TonEBP Haploinsufficiency Attenuates Microglial Activation and Memory Deficits in Middle-Aged and Amyloid β Oligomer-Treated Mice.
Lee JY, Jeong EA, Lee J, Shin HJ, Lee SJ, An HS, Kim KE, Kim WH, Bae YC, Kang H, Roh GS. Lee JY, et al. Cells. 2023 Nov 12;12(22):2612. doi: 10.3390/cells12222612. Cells. 2023. PMID: 37998347 Free PMC article. - Insulin and Its Key Role for Mitochondrial Function/Dysfunction and Quality Control: A Shared Link between Dysmetabolism and Neurodegeneration.
Galizzi G, Di Carlo M. Galizzi G, et al. Biology (Basel). 2022 Jun 20;11(6):943. doi: 10.3390/biology11060943. Biology (Basel). 2022. PMID: 35741464 Free PMC article. Review. - Peanut Shell Extract Improves Mitochondrial Function in db/db Mice via Suppression of Oxidative Stress and Inflammation.
Deshmukh H, Santos JM, Bender M, Dufour JM, Lovett J, Shen CL. Deshmukh H, et al. Nutrients. 2024 Jun 21;16(13):1977. doi: 10.3390/nu16131977. Nutrients. 2024. PMID: 38999726 Free PMC article. - Metabolic dysfunction induced by HFD + L-NAME preferentially affects hippocampal mitochondria, impacting spatial memory in rats.
Vilela WR, Ramalho LS, Bechara LRG, Cabral-Costa JV, Serna JDC, Kowaltowski AJ, Xavier GF, Ferreira JCB, de Bem AF. Vilela WR, et al. J Bioenerg Biomembr. 2024 Apr;56(2):87-99. doi: 10.1007/s10863-024-10005-2. Epub 2024 Feb 20. J Bioenerg Biomembr. 2024. PMID: 38374292
References
- Klein JP, Waxman SG. The brain in diabetes: molecular changes in neurons and their implications for end-organ damage. Lancet Neurol. 2003;2:548–554. - PubMed
- van der Heide LP, Ramakers GM, Smidt MP. Insulin signaling in the central nervous system: learning to survive. Prog. Neurobiol. 2006;79:205–221. - PubMed
- Toro P, Schonknecht P, Schroder J. Type II diabetes in mild cognitive impairment and Alzheimer’s disease: results from a prospective population-based study in Germany. J. Alzheimers Dis. 2009;16:687–691. - PubMed
- Kroner Z. The relationship between Alzheimer’s disease and diabetes: type 3 diabetes? Alter. Med Rev. 2009;14:373–379. - PubMed
Publication types
MeSH terms
Substances
LinkOut - more resources
Full Text Sources
Other Literature Sources
Molecular Biology Databases
Research Materials
Miscellaneous


