Winter melt trends portend widespread declines in snow water resources - PubMed (original) (raw)
Winter melt trends portend widespread declines in snow water resources
Keith N Musselman et al. Nat Clim Chang. 2021.
Abstract
In many mountainous regions, winter precipitation accumulates as snow that melts in spring and summer, providing water to one billion people globally. Climate warming and earlier snowmelt compromises this natural water storage. While snowpack trend analyses commonly focus on snow water equivalent (SWE), we propose that trends in accumulation season snowmelt serve as a critical indicator of hydrologic change. Here we compare long-term changes in snowmelt and SWE from snow monitoring stations in western North America and find 34% of stations exhibit increasing winter snowmelt trends (p < 0.05), a factor of three larger than the 11% showing SWE declines (p < 0.05). Snowmelt trends are highly sensitive to temperature and an underlying warming signal, while SWE trends are more sensitive to precipitation variability. Thus, continental-scale snow water resources are in steeper decline than inferred from SWE trends alone. More winter snowmelt will complicate future water resource planning and management.
Keywords: CLIMATE CHANGE; MELT; SNOW TRENDS; SNOW WATER EQUIVALENT; WARMING.
Conflict of interest statement
COMPETING INTERESTS STATEMENT The authors to declare there are no competing financial or non-financial interests in relation to the work described.
Figures
Extended Data Fig. 1. Examples of the snowpack and melt metrics used in this study.
Examples of seasonal SWE time series measured at mountain snowpack telemetry stations in (a) continental and (b) maritime climates showing daily SWE (solid black line) and two metrics derived from the daily decrease in SWE: daily melt (blue bars) and cumulative annual melt (red hashed lines) computed for Oct. 1 – Aug. 1 of each year. The date of maximum SWE is indicated by the vertical dashed line. Calculations of the fraction of cumulative annual melt that has occurred by the date of maximum SWE (FMmax) are shown. In these examples, FMApr1 is similar to FMmax and is not shown.
Extended Data Fig. 2. On average across western North American stations, snowpack reaches an annual maximum when 88% of annual snow has yet to melt.
As in Figures 2c and 2d, but showing the average fraction of cumulative annual melt on the date of maximum SWE.
Extended Data Fig. 3. Trends toward more winter melt are three-times more widespread than trends toward lower annual maximum SWE.
As in Figure 2, but showing stations with significant long-term changes in (a) the fraction of cumulative annual melt that has occurred by the date of annual maximum SWE and (b) the magnitude of annual maximum SWE.
Extended Data Fig. 4. Melt is increasing in all snow-dominated months before April 1st with the greatest rate of change in March.
(a) Increases (% per decade) in monthly melt as a fraction of total annual melt (median shown by red circles, lower and upper quartiles indicated by whiskers) from (b) snowpack telemetry stations with data records ≥ 30 years that have statistically significant (p≤0.05) positive trends (in percent of n=634 stations). Stations with negative trends not shown: <1% in Oct. and Nov., ~2% in Dec., Jan., Feb. and Mar.
Extended Data Fig. 5. Snowmelt increases during winter months are widespread.
Geographic distribution of the monthly melt trends shown in Extended Data Figure 4 for stations with data records ≥ 30 years (small black markers; n=634) that have statistically significant (p≤0.05) long-term increases (red markers) and decreases (blue markers) in monthly melt as a fraction of total annual melt for the months of (a) October, (b) November, (c) December, (d) January, (e) February, and (f) March.
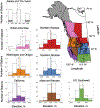
Extended Data Fig. 6. Winter melt increases did not predominately occur at lower elevations but were generally more frequent at middle to upper elevations.
The regional distribution (see colors in inset map) of long-term station (black markers in inset map) elevation (see white histogram bars) and the elevation of stations with long-term increases in the fraction of total annual melt before 1 April (see color histogram bars). The vertical lines in the histogram plots indicate the regional median station elevation (dashed black lines) and the median elevation of station with statistically significant (p<0.05) melt increases (solid color lines). When the color line is to the right of the dashed line, it indicates that the melt trend is more prevalent among middle to upper elevation sites.
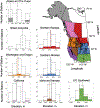
Extended Data Fig. 7. There is limited evidence that April 1st SWE declines have predominately occurred at lower elevations.
As in Extended Data Figure 6, but for trends in the magnitude of SWE on 1 April.
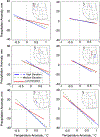
Extended Data Fig. 8. Winter melt at lower elevations may be more sensitive to seasonal temperature variations than higher elevations.
As in Figure 3 but evaluated over six regions with data binned into low, medium and high elevation categories according to the 33rd and 66th percentiles of the regional elevations of stations with long (40+ yr.) records. For visual clarity, shown are linear regressions fit to the centroids of the FMApr1 anomaly (see legend of Figure 3) for each elevation bin. All regression fits are statistically significant.
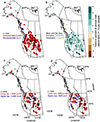
Extended Data Fig. 9. Snowmelt trends are highly sensitive to temperature and an underlying warming signal, while SWE trends are more sensitive to precipitation variability.
As in Fig. 2 but showing trends (see legends) in a) temperature, b) precipitation, c) FMApr1 (melt), d) April 1 SWE, and e) date of maximum SWE at the 173 U.S. stations with long records (small black markers) coincident with the PRISM climate data (1979–2019).
Figure 1 |. On average across western North American stations, snowpack reaches an annual maximum on April 1st when 78% of annual snow has yet to melt.
A (a) histogram and (b) map of the average (Oct. 1960 – Sep. 2019) date of maximum SWE relative to April 1st as measured at 1,065 snowpack telemetry stations (circle symbols) in western North America. The symbol colors in (b) correspond to the values shown in the x-axis of the histogram in (a). (c) and (d) show the average fraction of cumulative annual melt on April 1st as in (a) and (b), respectively. The average values of all sites and station-years are indicated in (a) and (c) by the vertical line. In (d), highlighted diamond-shaped markers indicate stations with FM on April 1st ≤ 0.05.
Figure 2 |. Trends toward more melt before April 1st are three-times more widespread than trends toward lower April 1st SWE or maximum annual SWE.
Snowpack telemetry stations with data records ≥ 30 years (small points; n=634) that have statistically significant (p ≤ 0.05; colored circles) historical trends (see text color in legends) in (a) the fraction of cumulative annual melt that has occurred by April 1st (the corresponding rate of melt change is mapped in (b)), (c) the magnitude of April 1st SWE and (d) the magnitude of annual maximum SWE.
Figure 3 |. Snowmelt is more sensitive to temperature whereas SWE is more influenced by precipitation.
The axes of each panel indicate anomalies in NDJFM precipitation (y-axis) and temperature (x-axis) from PRISM at U.S. snowpack telemetry sites relative to the long-term (1979 to 2019) mean values. The anomalies in (a) FM on April 1st, (b) April 1st SWE, and (c) date of maximum SWE are shown as percentiles using colors. Larger circles indicate the centroid for the percentile classes for each of six color categories (see color bars). (d) Centroids for each snow metric (from a-c; see legend).
Figure 4 |. The increasing number of stations with melt is explained by widespread, long-term warming while SWE declines are more sensitive to precipitation variability.
Historical trend analyses conducted each year based on information to date showing the number of long-term (40+ yr.) stations with significant (p≤0.05) a) warming and b) drying trends from PRISM (NDJFM averages) and, of those subset stations, the corresponding number of stations with trends in melt and April 1st SWE (see legends). Note the scale difference between y-axes. The number of stations with decreases in melt or increases in April 1st SWE is negligible; stations with no trends can be inferred from the difference between the black and red lines. The fraction of stations with warming and drying trends that also have trends in c) melt and d) April 1st SWE trends. Also plotted are the fractions of stations with snow trends relative to all subset stations (green lines) and all North American stations as of 2019 shown in Fig. 2 (black circles)
Similar articles
- Recent decreases in snow water storage in western North America.
Hale KE, Jennings KS, Musselman KN, Livneh B, Molotch NP. Hale KE, et al. Commun Earth Environ. 2023;4(1):170. doi: 10.1038/s43247-023-00751-3. Epub 2023 May 22. Commun Earth Environ. 2023. PMID: 38665199 Free PMC article. - Humidity determines snowpack ablation under a warming climate.
Harpold AA, Brooks PD. Harpold AA, et al. Proc Natl Acad Sci U S A. 2018 Feb 6;115(6):1215-1220. doi: 10.1073/pnas.1716789115. Epub 2018 Jan 22. Proc Natl Acad Sci U S A. 2018. PMID: 29358384 Free PMC article. - Relative snowpack response to elevation, temperature and precipitation in the Crown of the Continent region of North America 1980-2013.
Broberg L. Broberg L. PLoS One. 2021 Apr 13;16(4):e0248736. doi: 10.1371/journal.pone.0248736. eCollection 2021. PLoS One. 2021. PMID: 33848296 Free PMC article. - Review of operation of urban drainage systems in cold weather: water quality considerations.
Marsalek J, Oberts G, Exall K, Viklander M. Marsalek J, et al. Water Sci Technol. 2003;48(9):11-20. Water Sci Technol. 2003. PMID: 14703135 Review. - Organic contaminant amplification during snowmelt.
Meyer T, Wania F. Meyer T, et al. Water Res. 2008 Apr;42(8-9):1847-65. doi: 10.1016/j.watres.2007.12.016. Epub 2008 Jan 1. Water Res. 2008. PMID: 18222526 Review.
Cited by
- Anticipating responses to climate change and planning for resilience in California's freshwater ecosystems.
Power ME, Chandra S, Gleick P, Dietrich WE. Power ME, et al. Proc Natl Acad Sci U S A. 2024 Aug 6;121(32):e2310075121. doi: 10.1073/pnas.2310075121. Epub 2024 Jul 29. Proc Natl Acad Sci U S A. 2024. PMID: 39074267 Free PMC article. - California's 2023 snow deluge: Contextualizing an extreme snow year against future climate change.
Marshall AM, Abatzoglou JT, Rahimi S, Lettenmaier DP, Hall A. Marshall AM, et al. Proc Natl Acad Sci U S A. 2024 May 14;121(20):e2320600121. doi: 10.1073/pnas.2320600121. Epub 2024 Apr 29. Proc Natl Acad Sci U S A. 2024. PMID: 38684006 Free PMC article. - Beyond the barrels: The impact of resource wealth on the energy-economy-climate targets in oil-rich economies.
Nwani C, Effiong EL, Ikechukwu Okere K, Terhemba Iorember P. Nwani C, et al. Heliyon. 2024 Feb 1;10(3):e25666. doi: 10.1016/j.heliyon.2024.e25666. eCollection 2024 Feb 15. Heliyon. 2024. PMID: 38333819 Free PMC article. - Pervasive alterations to snow-dominated ecosystem functions under climate change.
Wieder WR, Kennedy D, Lehner F, Musselman KN, Rodgers KB, Rosenbloom N, Simpson IR, Yamaguchi R. Wieder WR, et al. Proc Natl Acad Sci U S A. 2022 Jul 26;119(30):e2202393119. doi: 10.1073/pnas.2202393119. Epub 2022 Jul 18. Proc Natl Acad Sci U S A. 2022. PMID: 35858427 Free PMC article. - Interactive effects of changes in UV radiation and climate on terrestrial ecosystems, biogeochemical cycles, and feedbacks to the climate system.
Barnes PW, Robson TM, Zepp RG, Bornman JF, Jansen MAK, Ossola R, Wang QW, Robinson SA, Foereid B, Klekociuk AR, Martinez-Abaigar J, Hou WC, Mackenzie R, Paul ND. Barnes PW, et al. Photochem Photobiol Sci. 2023 May;22(5):1049-1091. doi: 10.1007/s43630-023-00376-7. Epub 2023 Feb 1. Photochem Photobiol Sci. 2023. PMID: 36723799 Free PMC article.
References
- Li D, Wrzesien ML, Durand M, Adam J & Lettenmaier DP How much runoff originates as snow in the western United States, and how will that change in the future? Geophysical Research Letters (2017).
- Barnett TP, Adam JC & Lettenmaier DP Potential impacts of a warming climate on water availability in snow-dominated regions. Nature 438, 303–309 (2005). - PubMed
- Church JE Snow surveying: its principles and possibilities. Geographical Review 23, 529–563 (1933).
- Garen DC Improved techniques in regression-based streamflow volume forecasting. Journal of Water Resources Planning and Management 118, 654–670 (1992).
- Pagano T Soils, snow and streamflow. Nature Geoscience 3, 591–592 (2010).
Methods References
- Serreze MC, Clark MP, Armstrong RL, McGinnis DA & Pulwarty RS Characteristics of the western United States snowpack from snowpack telemetry (SNOTEL) data. Water Resources Research 35, 2145–2160 (1999).
- Trujillo E & Molotch NP Snowpack regimes of the Western United States. Water Resources Research 50, 5611–5623, doi:10.1002/2013WR014753 (2014). - DOI
- Gilbert RO Statistical methods for environmental pollution monitoring. (John Wiley & Sons, 1987).
- Mann HB Nonparametric tests against trend. Econometrica: Journal of the Econometric Society, 245–259 (1945).
- Kendall MG Rank correlation methods. (Charles Griffin & Co. Ltd., London, 1948).
LinkOut - more resources
Full Text Sources
Other Literature Sources


