Calreticulin Shortage Results in Disturbance of Calcium Storage, Mitochondrial Disease, and Kidney Injury - PubMed (original) (raw)
. 2022 Apr 13;11(8):1329.
doi: 10.3390/cells11081329.
Gry H Dihazi 2, Björn Tampe 3, Michael Zeisberg 3, Desiree Tampe 3, Samy Hakroush 4, Charlotte Bührig 3, Jenny Frese 5, Nazli Serin 3 6, Marwa Eltoweissy 7, Gerhard A Müller 3, Hassan Dihazi 3 8
Affiliations
- PMID: 35456008
- PMCID: PMC9025518
- DOI: 10.3390/cells11081329
Calreticulin Shortage Results in Disturbance of Calcium Storage, Mitochondrial Disease, and Kidney Injury
Asima Tayyeb et al. Cells. 2022.
Abstract
Renal Ca2+ reabsorption plays a central role in the fine-tuning of whole-body Ca2+ homeostasis. Here, we identified calreticulin (Calr) as a missing link in Ca2+ handling in the kidney and showed that a shortage of Calr results in mitochondrial disease and kidney pathogenesis. We demonstrated that Calr+/- mice displayed a chronic physiological low level of Calr and that this was associated with progressive renal injury manifested in glomerulosclerosis and tubulointerstitial damage. We found that Calr+/- kidney cells suffer from a disturbance in functionally active calcium stores and decrease in Ca2+ storage capacity. Consequently, the kidney cells displayed an abnormal activation of Ca2+ signaling and NF-κB pathways, resulting in inflammation and wide progressive kidney injury. Interestingly, the disturbance in the Ca2+ homeostasis and signaling in Calr+/- kidney mice cells triggered severe mitochondrial disease and aberrant mitophagy, resulting in a high level of oxidative stress and energy shortage. These findings provide novel mechanistic insight into the role of Calr in kidney calcium handling, function, and pathogenesis.
Keywords: autophagy; calcium signaling; calcium storage; calreticulin; kidney fibrosis; mitochondrial disease; oxidative stress.
Conflict of interest statement
The authors declare no conflict of interest.
Figures
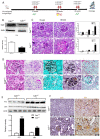
Figure 1
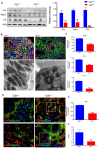
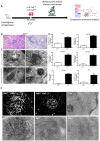
Progressive structural alterations in Calr+/− mice. (A): Illustration of the experimental design for structural investigation of the kidney. (B): Western blot analysis of Calr abundance in Calr+/+ and Calr+/− mouse kidney showing a > 50% reduction in Calr expression in Calr+/− mouse kidney. Paraffin-embedded kidney sections (3 µm) were stained with PAS to compare the kidney structures of Calr+/+ and Calr+/− at 15 wk, 30 wk, and 40 wk of age (**: p < 0.01). (**C**): Representative glomeruli of PAS-stained sections from Calr+/+ and Calr+/− mice (magnification ×40); upper bar diagram shows an increase in mGA in the kidneys of 30 and 40 wk old Calr+/− mice in comparison to those of young Calr+/− and Calr+/+ mice of the same age (_p_ < 0.05). Lower bar diagram shows a significant increase in mMA in 40 wk old Calr+/− mice compared to young Calr+/− mice of 15 and 30 wk old and Calr+/+ mice of same age. The data shown are mean ± SE (_n_ = 30 glomeruli per group, _p_ < 0.05). PAS: periodic acid–Schiff; mGA: mean glomerular area; mMA: mean mesangial area. (**D**): Kidney section from 40 wk old mouse kidney stained with different methods confirming advanced kidney injury in Calr+/− mice. (**E**): Western blot analysis of Fin and Lam showed a high expression in Calr+/− mouse kidney compared to Calr+/+. Bar diagram represents the quantification of the Western blot results shown in (**E**), (_n_ = 4. ***: _p_ < 0.001, ns: non-significant, _p_ > 0.05). _β_-actin (Actb) was used as loading control. (F): Representative images of kidney section from Calr+/+ and Calr+/− mice, staining of the kidney sections with antibodies against fibronectin (Fin1), and laminin. (G): Immunofluorescence staining with antibody against collagen I, MTC staining of kidney sections from Calr+/+ and Calr+/− mice. The staining showed a significant marked increase in fibronectin, laminin, and collagen expression in the Calr+/− kidney. (H): Kidney sections from 40 wk old Calr+/+ and Calr+/− mice were assessed by electron microscopy. GBM: glomerular basement membrane; BB: brush borders; TJ: tight junction.
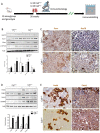
Figure 2
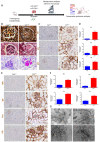
Impact of low level of Calr in the Calr+/− mouse kidney on the expression of ER stress markers and EF-hand Ca2+-binding proteins. (A): Illustration of the experimental design for immunohistology and Western blot. (B,C): Western blot analyses and immunohistostaining of the ER stress markers Grp78, Erp57, Canx, Chop, and p-eIF-2A showed no significant difference between the Calr+/+ and Calr+/− mouse kidneys; Actb was used as loading control. Below: Bar diagram represents the quantification of the Western blot results shown in (B) (n = 4. *: p < 0.05). (D,E): Western blot analyses and immunohistostaining of some ER-hand Ca2+-binding proteins Pvalb, Calb1, Calm1, and S100A4 showed significant up-regulation in Calr+/− kidney compared to Calr+/+. Below: Bar diagram represents the quantification of the Western blot results shown in (D) (n = 4. *: p < 0.05, **: p < 0.01, ***: p < 0.001). The immunohistochemical staining of Grp78, Pvalb, Calm1, and Canx is shown in 40 wk old Calr+/− and Calr+/+ mouse kidney sections.
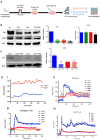
Figure 3
Calr expression underlays the control of calcium handling hormones and is important for Ca2+ homeostasis. (A): Illustration of the experimental design for calcium measurement and immunoblotting. (B): MDCK cells were treated with PTH or VD3, or both, and Calr expression was monitored using Western blot analysis. Compared to other ER stress markers, the expression of Calr was significantly down-regulated upon PTH or VD3 treatment. (C): Primary cell isolated from mouse kidneys (Calr+/+ and Calr+/−) were treated with PTH and the Calr expression was monitored using Western blot. Calr was significantly down-regulated upon PTH treatment. (D): The ratio of Fura-2 fluorescence emission intensity in response to 340 nm and 380 nm excitation (340/380) is proportional to intracellular (Ca2+). Fura-2 340/380 emission ratios are plotted against measurement time. (I): Average of Fura-2 340/380 emission ratios of Calr+/+ kidney primary cells (n = 20) and Calr+/− kidney primary cells are plotted against time. Fura-2 340/380 emission ratios of three representative tubular kidney primary cells from Calr+/+ or Calr+/− mice treated with ATP (5 µM) (II), Thapsigargin (1 µM) (III), or the ionophore A23187 (1 µM) (IV). (E): Categorization of differentially regulated proteins (2D gel analysis) was achieved by correlating GO identification numbers corresponding to cellular component and biological process with the regulated proteins. Values in figures presented the ratio distribution of proteins found in that respective category, (left) identified proteins categorized based upon their cellular component, (right) identified mitochondrial proteins categorized based upon their functional category. (F): Quantification of the proteomics data showed an up-regulation of protein sensing and transporting the calcium into the kidney cells. (G): Immunofluorescence staining of kidney tissue from Calr+/+ and Calr+/− with antibodies against Trpv5, Calb1, Ncx1, and Casr. (H): Expression alteration of proteins involved in the regulation of calcium, Western blot analyses confirming the up-regulation of Ncx1 and the down-regulation of Trpv5. *: p < 0.05, **: p < 0.01, ***: p < 0.001.
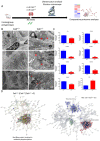
Figure 4
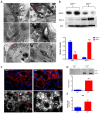
Mitochondrial alteration in Calr+/− mouse kidney. (A): Illustration of the experimental design for ultrastructure analysis and comparative proteome investigation. (B): Kidney section from Calr+/+ and Calr+/− mice were assessed by electron microscopy. Representative electron microscopic images show profound damage in the mitochondria of kidney cells from Calr+/− mice. The micrographs display swelling structures with loss of cristae. (C): Proteomics data showing significant down-regulation of proteins involved in oxidative phosphorylation and mitochondrial integrity in Calr+/− mouse kidneys. (D): Right: String analysis of the down-regulated proteins in Calr+/− mouse kidneys. String graph shows a strong interaction between the down-regulated proteins. Induction of oxidative stress in Calr+/− mouse kidneys. Left: The up-regulated protein in Calr+/− mouse kidneys are mainly ribosomal proteins, proteins from proteasome, and proteins involved in oxidative phosphorylation. (E): 2-DE close-up regions showing regulated protein involved in oxidative stress. (F): Immunohistochemical and immunofluorescence staining of Sod1 in Calr+/− and Calr+/+ mice. The immunofluorescence staining of Sod1 was coupled with ubiquitin. (G): Western blot analysis of oxidative stress-related proteins (Sod1, Prdx6, and Park7) was performed in kidney lysates from Calr+/− and Calr+/+ mice. Actb was used as loading control. Bar diagram representing the quantification of the Western blot results shown in G. (n = 4, *: p < 0.05, **: p < 0.01, ***: p < 0.001).
Figure 5
Down-regulation of mitochondrial proteins in Calr+/− mouse kidneys. (A): Western blot analysis of mitochondrial proteins: Vdac1, Cyc, and Cat from lysate of enriched mitochondria from Calr+/+ and Calr+/− kidney tissues. Quantification of protein expression is shown in bar diagram. (B): Immunofluorescence staining of Vdac1 and Cyc shows a clear decrease in the protein expression; micrograph shows the staining of Vdac1 using immunogold. (C): Quantification of proteomics data confirming the down-regulation of the investigated mitochondrial proteins. (D): Immunofluorescence staining of Cat coupled with ubiquitin shows enhanced expression in the glomerulus and nuclear translocation in the tubule cells of Calr+/− kidneys. (E): Quantification of the Cat expression using normalized spectral accounts, the expression of Cat is significantly down-regulated in Calr+/− mouse kidney. (F):Quantification of cytochrome c oxidase activity. Intact mitochondria were isolated for the quantification of cytochrome c oxidase activity. Comparison of the respiratory activity between Calr+/− and Calr+/+ kidneys revealed about a 50% decrease in mitochondrial activity in Calr+/− kidney cells. ** p<0.01, *** p<0.001).
Figure 6
Severe mitochondrial damage and autophagy in Calr+/− mouse kidneys. (A): Representative electron micrographs for ultrastructural morphology of mitochondria from Calr+/− mouse kidney—(a,b): distal convoluted tubule cells swelling mitochondria enclosed in membrane structures, some of the mitochondria are in advanced stages of autophagy; (c–e): damaged mitochondrial enclosed in multi-membrane structure undergoing autophagy, also shown are advanced stages where the mitochondria are almost completely eliminated; (f): a podocyte with damaged vacuolated mitochondria highlighted with red asterisks in Calr+/− mouse kidneys. (B): Western blot analysis of protein extract from Calr+/+ and Calr+/− kidney tissue showed down-regulation of Bcl-2 and up-regulation of Becn-1, indicating an activation of the autophagy. (C): Immunofluorescence staining of LC3 confirmed the initiation and formation of autophagosomes. (D): Western blot analysis with antibody against LC3 confirmed the shift toward LC3-II in Calr+/− kidney, as evidenced by the ratio LC3-II/LC3-I calculation. (E): Proteomic analysis revealed an up-regulation of the Atg3, an important player in autophagy in Calr+/− kidneys. Results are given as means ± SD of the relative intensity in the case of Western blot analysis, or of the normalized spectral accounts in the case of proteomic data **: p<0.01, ***: p<0.001).
Figure 7
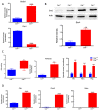
Activation of PKA and glycolysis in Calr+/− kidney. The intensive mitochondrial damage results in an energy shortage. To overcome the energy crisis, the kidney cells in Calr+/− mice activate glycolysis. (A): Up-regulation of Slc5a1 a sodium/glucose cotransporter 1, which actively transports glucose into the cell, and PcK1 is also up-regulated to actively augment the glucose synthesis from lactate. (B): Enolase 1 is also up-regulated to favor the energy production from glucose. (C): PKA is significantly up-regulated and activated to accelerate glycolysis and to promote energy production, and the important glycolysis kinase PFK is significantly up-regulated in Calr+/− mouse kidneys. (D): Parallel to the activation of glycolysis, the enzymes involved in production of the alternative energy from phosphocreatine are also up-regulated in Calr+/− mouse kidney. data (*: p < 0.05) **: p < 0.01, ***: p < 0.001).
Figure 8
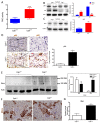
Chronic increased cytosolic calcium level results in activation of PKC and NF-κB pathway in Calr+/− kidney. (A): Activity assay demonstrated significant activation of PKC in Calr+/− mouse kidney because of alteration in cytosolic calcium concentration. (B): Western blot analysis of protein extracts from Calr+/+ and Calr+/− kidneys showed an activation of NF-κB pathway as evidenced by up-regulation of p65 in heterozygous kidney and down-regulation of the pathway inhibitor IkB. (C,D): The nuclear translocation of p65 confirmed the activation of NF-κB pathway, the nuclear protein Lamin A/C was used as control. (E): Western blot analysis of iNos was performed for kidney lysates of Calr+/− and Calr+/+ mice. Actb was used as loading control. Bar diagram representing the quantification of the MM and DM of iNos. Western blot results are shown in (B) (n = 4 *, p < 0.05, **: p < 0.01, ***: p < 0.001). MM: monomer, DM: dimer. (F): Immunohistochemical staining of iNos shows no significant change in expression pattern of protein in Calr+/− compared to Calr+/+. (G): Proteomic data showed an up-regulation of IL6st the interleukin-6 receptor, revealing an increased inflammation upon NF-κB pathway activation in Calr+/− mouse kidney.
Figure 9
Blood cell infiltration and inflammation of kidney tissue in Calr+/− mice. (A): Illustration of the experimental design showing samples processing for structural analysis and comparative proteome investigation. (B): Histochemical staining showing strong inflammation in the Calr+/− kidney tissue. C: Ultrastructural analysis with electron microscope showed strong infiltration of blood cells in Calr+/− kidney tissue. (D,E): proteomic data showed significant up-regulation of ECM proteins and the immunofluorescence staining and electron microscopy analysis demonstrated a strong deposition of EMC in the interstitial area of the kidney tissue in Calr+/− mice. ***: p < 0.001.
Figure 10
Calr+/− kidney showed an anti-GBM disease. (A): Illustration of the experimental design showing samples processing for structural analysis and comparative proteome investigation. (B): Histochemical staining shows the typical strong linear ribbon-like appearance, revealing an anti-GBM disease. (C): Immunohistochemical staining showing positive staining of IgA, IgG, IgM, in Calr+/− kidney tissue. (D): Proteomic analysis confirmed the up-regulation of the three investigated proteins. (E): The staining pattern was similar for Igkc, Iglc, C1q, and C3c, with positive staining in Calr+/− kidneys and almost no stain detected in Calr+/+ kidneys. (F): Proteomics data confirmed the staining results and showed an up-regulation of the complement factor proteins and the light chains. (G): Electron microscopic photograph of the Calr+/− renal tissue, showing the electron-dense deposits in mesangial areas. **: p < 0.01, ***: p < 0.001.
Similar articles
- Calreticulin is crucial for calcium homeostasis mediated adaptation and survival of thick ascending limb of Henle's loop cells under osmotic stress.
Bibi A, Agarwal NK, Dihazi GH, Eltoweissy M, Van Nguyen P, Mueller GA, Dihazi H. Bibi A, et al. Int J Biochem Cell Biol. 2011 Aug;43(8):1187-97. doi: 10.1016/j.biocel.2011.04.012. Epub 2011 Apr 28. Int J Biochem Cell Biol. 2011. PMID: 21554974 - Calreticulin Deficiency Disturbs Ribosome Biogenesis and Results in Retardation in Embryonic Kidney Development.
Serin N, Dihazi GH, Tayyeb A, Lenz C, Müller GA, Zeisberg M, Dihazi H. Serin N, et al. Int J Mol Sci. 2021 May 30;22(11):5858. doi: 10.3390/ijms22115858. Int J Mol Sci. 2021. PMID: 34070742 Free PMC article. - The Calreticulin control of human stress erythropoiesis is impaired by JAK2V617F in polycythemia vera.
Falchi M, Varricchio L, Martelli F, Marra M, Picconi O, Tafuri A, Girelli G, Uversky VN, Migliaccio AR. Falchi M, et al. Exp Hematol. 2017 Jun;50:53-76. doi: 10.1016/j.exphem.2017.02.001. Epub 2017 Feb 21. Exp Hematol. 2017. PMID: 28232234 Free PMC article. - Calreticulin and cancer.
Fucikova J, Spisek R, Kroemer G, Galluzzi L. Fucikova J, et al. Cell Res. 2021 Jan;31(1):5-16. doi: 10.1038/s41422-020-0383-9. Epub 2020 Jul 30. Cell Res. 2021. PMID: 32733014 Free PMC article. Review. - Calreticulin is an upstream regulator of calcineurin.
Lynch J, Michalak M. Lynch J, et al. Biochem Biophys Res Commun. 2003 Nov 28;311(4):1173-9. doi: 10.1016/j.bbrc.2003.08.040. Biochem Biophys Res Commun. 2003. PMID: 14623303 Review.
Cited by
- Membrane Bound CRT Fragment Accelerates Tumor Growth of Melanoma B16 Cell In Vivo through Promoting M2 Polarization via TLR4.
Wang HM, Zhou Z, Miao J, Zhu B, Dai XQ, Zhong Q, Gong FY, Gao XM. Wang HM, et al. J Immunol Res. 2022 Oct 6;2022:4626813. doi: 10.1155/2022/4626813. eCollection 2022. J Immunol Res. 2022. PMID: 36249426 Free PMC article.
References
- Bibi A., Agarwal N.K., Dihazi G.H., Eltoweissy M., Van Nguyen P., Mueller G.A., Dihazi H. Calreticulin Is Crucial for Calcium Homeostasis Mediated Adaptation and Survival of Thick Ascending Limb of Henle’s Loop Cells under Osmotic Stress. Int. J. Biochem. Cell Biol. 2011;43:1187–1197. doi: 10.1016/j.biocel.2011.04.012. - DOI - PubMed
- Dihazi H., Dihazi G.H., Mueller C., Lahrichi L., Asif A.R., Bibi A., Eltoweissy M., Vasko R., Mueller G.A. Proteomics Characterization of Cell Model with Renal Fibrosis Phenotype: Osmotic Stress as Fibrosis Triggering Factor. J. Proteom. 2011;74:304–318. doi: 10.1016/j.jprot.2010.11.007. - DOI - PubMed
Publication types
MeSH terms
Substances
LinkOut - more resources
Full Text Sources
Medical
Molecular Biology Databases
Research Materials
Miscellaneous
