Homologous recombination promotes non-immunogenic mitotic cell death upon DNA damage - PubMed (original) (raw)
doi: 10.1038/s41556-024-01557-x. Epub 2025 Jan 13.
Sienna Casolin 1 2, Lucy French 1 2, Anna G Manjón 1 2, Melanie Walter 1 2, Léa Cavalli 1, Christopher B Nelson 3, Scott G Page 1, Andrew Dhawan 4, Eric Hau 2 5 6, Hilda A Pickett 3, Harriet E Gee 7 8 9 10, Anthony J Cesare 11
Affiliations
- PMID: 39805921
- PMCID: PMC11735404
- DOI: 10.1038/s41556-024-01557-x
Homologous recombination promotes non-immunogenic mitotic cell death upon DNA damage
Radoslaw Szmyd et al. Nat Cell Biol. 2025 Jan.
Abstract
Double-strand breaks (DSBs) can initiate mitotic catastrophe, a complex oncosuppressive phenomenon characterized by cell death during or after cell division. Here we unveil how cell cycle-regulated DSB repair guides disparate cell death outcomes through single-cell analysis of extended live imaging. Following DSB induction in S or G2, passage of unresolved homologous recombination intermediates into mitosis promotes non-immunogenic intrinsic apoptosis in the immediate attempt at cell division. Conversely, non-homologous end joining, microhomology-mediated end joining and single-strand annealing cooperate to enable damaged G1 cells to complete the first cell cycle with an aberrant cell division at the cost of delayed extrinsic lethality and interferon production. Targeting non-homologous end joining, microhomology-mediated end joining or single-strand annealing promotes mitotic death, while suppressing mitotic death enhances interferon production. Together the data indicate that a temporal repair hierarchy, coupled with cumulative DSB load, serves as a reliable predictor of mitotic catastrophe outcomes following genome damage. In this pathway, homologous recombination suppresses interferon production by promoting mitotic lethality.
© 2025. The Author(s).
Conflict of interest statement
Competing interests: H.A.P. is the co-founder and shareholder of Tessellate Bio. H.E.G. received an AstraZeneca honorarium unrelated to this research. The other authors declare no competing interests.
Figures
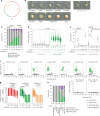
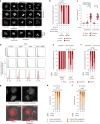
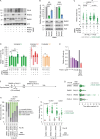
Fig. 1. Irradiation induces distinct cell death outcomes.
a, The 3F schematic. b, Stills from 3F HeLa live imaging (representative of n = 3; h:min is relative to the nuclear envelope breakdown (NEBD)). Scale bar, 50 µm. c–e, All cell cycle outcomes (c), mitotic duration (d) and first completed mitosis outcome (e) of 3F HeLa in the 120 h post IR (n = 4, 3, 4, 4, 3, 4, 3, 3 and 3 from left to right). Analysis for c and e includes the replicate mean ± s.e.m. and a two-sided Fisher’s exact test of N for mitotic death, and analysis for d includes the median and a Kruskal–Wallis uncorrected Dunn’s multiple comparisons test of N. f, Multi-dimensional representation of c. The symbols represent individual outcomes. g, First mitosis outcome in 3F HeLa as a function of cell cycle phase at IR (mean ± s.e.m., n = 4, 3, 4, 4, 3, 4 and 3 from left to right, two-sided Fisher’s exact test of N). h, The outcome as in c (mean ± s.e.m., n = 2). For a–g, N = individual cells across all replicates and n = biological replicates. n.s., not significant. Source data
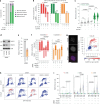
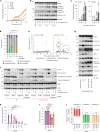
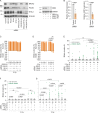
Fig. 2. DSB repair pathways guide cell death mode following IR.
a–c, All cell cycle outcomes over 120 h (a), first mitosis outcomes (b) and all mitotic durations (c) for 3F HeLa ± 0.5 µM NU7441. The 20 Gy IR are from Fig. 1, and the irradiated samples in c are stratified by outcome (for a and b, the mean ± s.e.m. n = 2, except 20 Gy (n = 3), two-sided Fisher’s exact test of N; for c, mean ± s.e.m. and Kruskal–Wallis uncorrected Dunn’s multiple comparisons test of N). d, Western blots of whole-cell extracts from 3F HeLa (representative of n = 3). e, Quantitative PCR with reverse transcription of 3F HeLa (mean ± s.e.m., n = 3, two-tailed paired _t_-test, t = 9.7, d.f. of 2, 95% confidence interval (CI) −0.79 to −0.30; fold change relative to control siRNA, normalized to 1). f, The first mitosis outcome in 3F HeLa (mean ± s.e.m., n = 3, except control siRNA (n = 5); two-sided Fisher’s exact test of N). g, Example images and RAD51 foci quantitation from HeLa. Each dot represents a single cell (representative of n = 3). Scale bar, 20 µm. h,i, RAD51 foci in siRNA transfected HeLa ± 14 Gy IR (h) and quantitation (i) (for i, mean ± s.e.m. n = 3, 2, 2, 2, 3, 3, 3 and 2 from left to right; violin plots of N; the dotted lines are quartiles and the solid lines medians; ordinary one-way ANOVA with Fisher’s Least Significant Difference (LSD) multiple comparisons test). For a–i, N = individual cells across all replicates and n = biological replicates. n.s., not significant. Source data
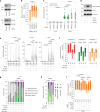
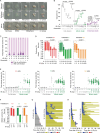
Fig. 3. Recombination intermediates potentiate mitotic death.
a, Western blots of whole-cell extracts from 3F HeLa (representative of n = 2). b,c, First mitosis outcome (b) and mitotic duration (c) in G2-enriched 3F HeLa treated with 14 Gy IR (for b, the mean n = 2, two-sided Fisher’s exact test of N; for c, mean ± s.e.m. and two-tailed Kolmogorov–Smirnov test of N). d, Western blots of whole-cell extracts collected 1 h post IR from HeLa ± 0.2 µM VE-822 (n = 1). e, RAD51 foci in HeLa ± siRNA (si) and/or 0.2 µM VE-822 (mean ± s.e.m. of n = 5, 4, 4, 3, 5, 5, 5 and 3 from left to right; violin plots of N, the dotted lines are quartiles and the solid lines medians; ordinary one-way ANOVA with Fisher’s LSD multiple comparisons test). All VE-822 negative conditions include replicates from Fig. 2i. f,g, First mitosis (f) and all cell cycle outcomes over 120 h (g) in 3F HeLa ± siRNA, 0.2 µM VE-822, 0.5 µM reversine and/or 14 Gy IR (for f, mean n = 2, two-sided Fisher’s exact test of N; for g, the mean ± s.e.m. n = 2, two-sided Fisher’s exact test of N for mitotic death). h, Cell death from g (mean ± s.e.m. n = 2, two-sided Fisher’s exact test of N). i, First mitosis in G2-enriched 3F HeLa following 2 Gy IR (mean n = 2, except RTEL1 siRNA ± BRCA2/PALB2 siRNA mean ± s.e.m. (n = 3); two-sided Fisher’s exact test of N). For a–i, N = individual cells across all replicates and n = biological replicates. n.s., not significant. Source data
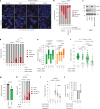
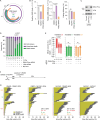
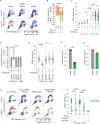
Fig. 4. Chromosomal structural aberrations correlate with first mitosis survival.
a, Cytogenetic preparations from HeLa ± 14 Gy. Scale bar, 10 µm (representative of n = 3). b–e, Radial chromosomes (b), chromatid-type fusions (c), multi-centric chromosomes (d) and ring chromosomes (e) from asynchronous mock irradiated or the first mitosis post 14 Gy IR in G1, S or G2-enriched HeLa (mean ± s.e.m. n = 3, N = 50 metaphases per replicate, ordinary one-way ANOVA with Fisher’s LSD multiple comparisons test). f,g, Radial chromosomes (f) and chromatid-type fusions (g) in asynchronous HeLa following 14 Gy IR (mean ± s.e.m. n = 4, 4, 2, 2 and 4 from left to right, N = 50 metaphases per replicate; two-sided Fisher’s exact test of N). h,i, HeLa radial chromosomes (h) and chromatid-type fusions (i) in the first mitosis post 14 Gy IR (mean n = 2, except 0 Gy control siRNA (n = 4), N = 50 metaphases per replicate, two-sided Fisher’s exact test of N). The control siRNA are the 0 and 36 h timepoints from f and g. Source data
Fig. 5. Cohesion fatigue promotes mitotic death following lethal genomic damage.
a, Cohesion fatigue in HeLa chromosome spreads. Scale bars, 5 µm (representative of n = 5). b, Cohesion fatigue in HeLa ± 14 Gy IR, 100 ng ml−1 colcemid or 5 µg ml−1 taxol (mean ± s.e.m. n = 3, two-sided Fisher’s exact test of N). c, Western blots of HeLa whole-cell extracts (representative of n = 3). d, HeLa cohesion fatigue in the first mitosis after 14 Gy IR (mean ± s.e.m. n = 2, except 0 Gy control siRNA (n = 4), two-sided Fisher’s exact test of N). e,f, First mitosis outcome (e) and mitotic duration (f) in 14-Gy-irradiated asynchronous 3F HeLa (for e, mean ± s.e.m. n = 2, 3, 2 and 3 from left to right, two-sided Fisher’s exact test of N; for f, mean ± s.e.m. and Kruskal–Wallis uncorrected Dunn’s multiple comparisons test of N). g, HR of an I-SceI DSB repair reporter in HeLa (mean ± s.e.m. n = 3, two-tailed paired _t_-test, t = 4.8, d.f. of 2, 95% confidence interval 0.03 to 0.56). h, Cohesion fatigue in HeLa ± 14 Gy IR and/or 0.2 µM VE-822 (mean ± s.e.m. n = 2, except 0 Gy (n = 4), two-sided Fisher’s exact test of N). The samples without VE-822 are from Fig. 5d. i,j, Mitotic duration (i) and outcome (j) of HeLa ± siRNA, 0.5 µM hesperadin and/or 3.3 µM nocodazole (for i, points means ± s.e.m. of n = 1, 1, 3, 3 and 2 from left to right, violin plot of N, the dotted lines are quartiles and the solid lines medians, Kruskal–Wallis uncorrected Dunn’s multiple comparisons test; for j, mean ± s.e.m. as in i). The control siRNA + nocodazole and/or hesperadin are from Extended Data Fig. 4d. For a–j, N = individual cells/metaphases across all replicates and n = biological replicates. n.s., not significant. Source data
Fig. 6. Targeting RAD51 promotes genomic instability upon mitotic death escape.
a, Stills from live imaging of HeLa H2B–eGFP ± 20 Gy IR. Scale bar, 20 µm (representative of n = 2; hours:minutes is relative to prophase). b,c, Mitotic outcome (b) and duration (c) as a function of chromosome alignment in asynchronous HeLa H2B–eGFP ± 20 Gy IR (for b, mean ± s.e.m. n = 2, two-sided Fisher’s exact test of N; for c, mean ± s.e.m. and Kruskal–Wallis uncorrected Dunn’s multiple comparisons test of N). d, The cell cycle profiles of HeLa mCherry–H2B (representative of n = 2). C represents DNA content, where 1C is a haploid genome prior to DNA replication, while 2C stands for a diploid genome after DNA has been duplicated in S phase. e,f, Chromosome alignment in the first (e) and all (f) mitoses of G2-enriched HeLa mCherry–H2B treated with 14 Gy IR (mean ± s.e.m. n = 3, two-sided Fisher’s exact test of N). g, Representative images of cytokinesis defects. Scale bars, 20 µm (representative of n = 3). Arrows identify daughter cells with uneven DNA content. h,i, The cytokinesis outcomes from e and f in first (h) or subsequent (i) mitoses (mean ± s.e.m. n = 3, two-sided Fisher’s exact test of N). For a–i, N = individual cells across all replicates and n = biological replicates. n.s., not significant. Source data
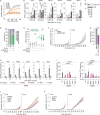
Fig. 7. Distinct waves of intrinsic and extrinsic apoptosis following IR.
a, IncuCyte live imaging of a caspase-3 and caspase-7 fluorescence reporter in HeLa (representative of n = 2, mean ± standard deviation of three technical replicates). a.u., arbitrary units. b, Western blots of HeLa whole-cell extracts (representative of n = 2). c, A quantitative PCR with reverse transcription (RT–qPCR) of HeLa post 14 Gy IR (mean ± s.e.m. n = 3, repeated measures (RM) one-way ANOVA with Fisher’s LSD multiple comparisons test). The fold change is relative to the cells collected immediately before IR and normalized to 1 (red dashed line). d, All cell cycle outcomes in HeLa ± IR and/or BAX BAK DKO (mean ± s.e.m. of n = 3, except 20 Gy (n = 2); two-sided Fisher’s exact test of N). e, Multi-dimensional representation of d. The symbols represent the individual outcomes. f, Western blots of whole-cell extracts from HeLa ± siRNA, BAX BAK DKO and/or 14 Gy IR (representative of n = 2). g, Western blots of whole-cell extracts from HeLa (representative of n = 2). The mitotic cells were collected by shakeoff. h, RT–qPCR of HeLa ± siRNA and/or 14 Gy IR, with a fold change to non-irradiated control siRNA normalized to 1 (mean ± s.e.m. n = 3, RM one-way ANOVA with Fisher’s LSD multiple comparisons test; the P values are relative to the control siRNA + 14 Gy). i, Relative apoptosis, as measured in a, in 14-Gy-irradiated HeLa (mean ± s.e.m. n = 4, 3, 3, 4, 4 and 3 from left to right, mixed-effect one-way ANOVA with a Fisher’s LSD multiple comparisons test). j, The first mitosis outcome in asynchronous and 14-Gy-irradiated 3F HeLa (mean ± s.e.m. n = 3, except control siRNA (n = 4), two-sided Fisher’s exact test of N). For a–i, N = individual cells across all replicates and n = biological replicates. n.s., not significant. Source data
Fig. 8. Mitotic death is tunable and influenced by disease genetics.
a,b, Quantitative PCR with reverse transcription (a) and western blots of whole-cell extracts (b) from HeLa ± 14 Gy IR, siRNA and/or VE-822 (for a, mean ± s.e.m. n = 3, except the control—VE-822 (n = 6) and WAPL (n = 4); a mixed-effect one-way ANOVA with Fisher’s LSD multiple comparisons test was performed for the irradiated samples and fold change relative to non-irradiated control siRNA, normalized to 1; b is representative of n = 3). c, A Spearman correlation from mSigDB gene lists in TCGA patient samples. The tumour designations are in Methods. d,e, All cell cycle outcomes (d) and mitotic duration (e) in PEO1 and PEO4 ± 14 Gy IR (for d, mean ± s.e.m. n = 2, two-sided Fisher’s exact test of N; for e, mean ± s.e.m. and two-tailed Mann–Whitney test of N). f, A proposed decision tree with the corresponding outcome during mitotic catastrophe. For a–f, N = individual cells across all replicates and n = biological replicates. n.s., not significant. Source data
Extended Data Fig. 1. Distinct modes of cell death following lethal genomic damage in p53 compromised cells.
A) Examples of aberrant mitoses from irradiated 3F HeLa (representative of n = 3). Time is hrs:min relative to nuclear envelope breakdown (NEBD). Scale bar = 50 µm. B) Replicate means from Fig. 1c (mean ± SEM left to right n = 4, 3, 4, 4, 3, 4, 3, 3, 3; two-sided Fisher’s exact test of N shown in Fig. 1c). C) Interphase lethality from Fig. 1c (mean ± SEM left to right n = 3, 3, 4, 4, 3, 4, 3, 3, 3. D) Outcomes over the entire 120-hour live imaging experiment in Fig. 1g as a function of cell cycle phase at irradiation (mean ± SEM left to right of n = 4, 3, 4, 4, 3, 4, 2; two-sided Fisher’s exact test of N). E) Mitotic duration from Fig. 1g delineated by outcome and cell cycle phase at IR (mean ± SEM left to right n = 4, 3, 4, 4, 3, 4, 3). F) First mitosis outcome in 3F HT1080 6TG as a function of cell cycle phase at irradiation (mean of n = 2; two-sided Fisher’s exact test of N). G, H) Cell fate map from 3F A549 (G, n = 1) and 2 F IMR90 (H, n = 2) cultures following mock or IR treatment. Each line represents a single cell relative to IR at T0. For mock-treated cultures, only the first cycle was recorded. For irradiated cultures, cells were tracked for 120 h or until migration from the imaging frame. The asterisk depicts the only cell death event observed. All panels, N = individual cells across all replicates, n = biological replicates, ns = not significant. Source numerical data are available in source data. Source data
Extended Data Fig. 2. Immediate mitotic death is suppressed by NHEJ.
A) Active DSB repair pathways relative to cell cycle phase. B) TIDE measurement of relative NHEJ ( + 1) and MMEJ (-7) of a Cas9-induced DSB in HeLa,, normalized to 1 for DMSO-treated samples. Cas9 cutting efficiency on right (mean ± SEM, n = 4, except POLθ siRNA n = 1, unpaired two-tailed t-test; t, df, and 95% CI in Source Data). C) Western blots of whole cell extracts derived from 3F HeLa (representative of n = 3). D) All cell cycle outcomes in 3F HeLa ± siRNA, 0.5 µM NU7441, and/or 14 Gy IR (mean ± SEM n = 2 except NU7441 positive control n = 1, two-sided Fisher’s exact test of N). E) First cell cycle outcome from (D) (mean ± SEM n = 2, two-sided Fisher’s exact test of N). F, G) Experimental timing (F) and cell fate maps (G) of asynchronous and 14 Gy irradiated 3F HeLa ± DMSO or 0.5 µM NU7441. Each line is a single cell, sorted by cell cycle phase at irradiation (n = 2, all cells compiled, two-sided Fisher’s exact test of N = 60). All panels, N = individual cells across all replicates, n = biological replicates, ns = not significant. Source numerical data and unprocessed blots are available in source data. Source data
Extended Data Fig. 3. RAD51 promotes mitotic arrest and mitotic death in irradiated cells.
A) Western blots of 3F HeLa whole cell extracts (*non-specific band, n = 1). B) HR and SSA reporters, in siRNA and I-SceI transfected HeLa normalized to 1. (mean ± SEM n = 3, two-tailed paired t-test; t, df, and 95% CI in Source Data). Western blots of whole cell extracts from experimental cultures shown below (representative of n = 3). C) First mitosis duration of G1, S, and G2 irradiated 3F HeLa cultures from (D) and Fig. 2f combined (n = 3, except for control siRNA n = 5; mean ± SEM and Kruskal-Wallis uncorrected Dunn’s multiple comparisons test of N). D) Fist mitosis outcome in 14 Gy irradiated 3F HeLa (mean ± SEM, n = 3 except for control siRNA n = 5, and RAD51/POLθ siRNA n = 4; two-sided Fisher’s exact test of N). 14 Gy control siRNA samples for G1 and G2 irradiated cells are from Fig. 2f. E) HR activity as in (B) in siRNA transfected or RI(dl)-2 treated HeLa (mean ± SEM n = 2, 2, 1, 1, 1, 1, 3, 3 left to right). F) Experimental timing in (G-I). Mitotic outcomes were scored following media change. G-I) Time of mitotic entry (G), first mitotic outcome (H), and mitotic duration (G) for 3F HeLa treated with DMSO, 50 µM Rl(dl)-2, and 14 Gy IR (n = 1, 1, 2, 2, 3, 3 left to right in H; G, median ± interquartile range of N; H, mean ± SEM of n; two-sided Fisher’s exact test of N; I, mean ± SEM and Kruskal-Wallis uncorrected Dunn’s multiple comparisons test of N). All panels, N = individual cells across all replicates, n = biological replicates, ns = not significant. Source numerical data and unprocessed blots are available in source data. Source data
Extended Data Fig. 4. BRCA2, PALB2, and ATR promote immediate mitotic death following IR.
A) RAD51 foci in HeLa ± 14 Gy IR and/or siRNA as shown in Fig. 2g (n = 1). B, C) First mitosis outcome (B) and duration (C) in G2 enriched 3F HT1080 6TG ± 20 Gy IR and/or siRNA (B, mean ± SEM n = 3, 3, 4, 4 left to right, two-sided Fisher’s exact test of N; C, mean ± SEM and Kruskal-Wallis uncorrected Dunn’s multiple comparisons test of N). D, E) Mitotic outcome (D) and duration (E) for HeLa ± siRNA, 3.3 µM Nocodazole, and/or 0.5 µM Hesperadin (D, mean ± SEM n = 3, except Hesperadin n = 2, two-sided Fisher’s exact test of N; E, mean ± SEM of n, violin plots depict N, dotted lines mark quartiles and solid lines represent medians; Kruskal-Wallis Dunn’s multiple comparisons test of N). F, G) HR (F) or SSA (G) I-SceI repair reporters in HeLa cells ± 0.2 µM VE-822 and normalized to 1 (F, mean ± SEM n = 3, two-tailed paired t-test, t = 31.6, df = 2, 95% CI = 0.59 to 0.77; G, mean n = 2). Samples were collected 48 h after I-SceI transfection and 40 h after VE-822 addition. H) RAD51 foci in HeLa ± siRNA, 0.2 µM VE-822, and/or 14 Gy IR as quantified in Fig. 3e (representative, see Fig. 3e legend for n). I) Mitotic duration of irradiated 3F HeLa cultures from Fig. 3g (mean ± SEM and Kruskal-Wallis uncorrected Dunn’s multiple comparisons test of N from n = 2). All panels, N = individual cells across all replicates, n = biological replicates, ns = not significant. Source numerical data are available in source data. Source data
Extended Data Fig. 5. BTR and SLX4 promote mitotic survival following low dose IR.
A) Western blots of whole cell extracts from 3F HeLa. The asterisk denotes a non-specific band (representative of n = 2). B) RT-qPCR of siRNA transfected 3F HeLa (n = 3, two-tailed paired t-test t, df, and 95% CI are shown in Source Data). C, D) First mitosis outcome in siRNA transfected and G2 enriched 3F HeLa ± 2 Gy IR (mean ± SEM n = 2 for (C) and 3 for (D), two-sided Fisher’s exact test of N). E-G) Mitotic duration for the cells in Extended Data Fig. 5D (E), Extended Data Fig. 5C (F), and Fig. 3i (G) (mean ± SEM and Kruskal-Wallis uncorrected Dunn’s multiple comparisons test of N). All panels, N = individual cells across all replicates, n = biological replicates, ns = not significant. Source numerical data and unprocessed blots are available in source data. Source data
Extended Data Fig. 6. Targeting RAD51 or WAPL differently rescues immediate mitotic death.
A) Cohesion fatigue in cytogenetic chromosome spreads from 14 Gy irradiated HT1080 6TG, scale bar = 5 µm (representative of n = 3). B) First mitosis outcome in 14 Gy irradiated G1 cells from asynchronous and siRNA transfected 3F HeLa (mean ± SEM, n = 2, 3, 2, 3 left to right, two-sided Fisher’s exact test of N). C) Western blots of whole cell extracts from parental and WAPL knockout (KO) 3F HT1080 6TG (representative n = 2). D) Cohesion fatigue in parental or WAPL KO HT1080 6TG cultures ± 14 Gy IR and/or siRNA (mean ± SEM of n = 3, two-sided Fisher’s exact test of N). E) First mitosis outcome in G2 enriched and 14 Gy irradiated parental or WAPL KO 3F HT1080 6TG ± siRNA (mean ± SEM, n = 3, two-sided Fisher’s exact test of N). All panels, N = individual cells across all replicates, n = biological replicates, ns = not significant. Source numerical data and unprocessed blots are available in source data. Source data
Extended Data Fig. 7. Distinct apoptotic pathways underpin immediate and delayed lethality following IR.
A) HeLa proliferation measured through IncuCyte live imaging (mean ± SEM, n = 3). B) RT-qPCR from HeLa. Fold change presented relative to cells collected prior to IR (T0), normalized to 1 and depicted as a red dotted line (mean ± SEM, n = 3, RM one-way ANOVA with Fisher’s LSD multiple comparisons test, F and 95% CI in Source Data). C) Western blots of HeLa whole cell extracts. #1 are transduced with diluted 1:2 lentivectors and #2 with crude viral supernatant (n = 1). D, E) All cell cycle outcomes (D) and mitotic duration (E) in HeLa ± shRNA and/or 20 Gy IR (D, mean ± SEM n = 2, two-sided Fisher’s exact test of N; E, mean ± SEM and Kruskal-Wallis uncorrected Dunn’s multiple comparisons test of N). F, G) IncuCyte live imaging of a Caspase 3/7 fluorescence reporter (F) and relative apoptosis (G, area under the curve from F) in HeLa ± 14 Gy and/or 40 µM Z-IETD-FMK (mean ± SEM, n = 4; G, two-tailed paired t-test, t = 8.5, df = 3, 95% CI = -0.55 to -0.25). H, I) RT-qPCR of siRNA transfected HeLa. Fold change in gene expression relative to control siRNA immediately prior to IR (T0) and normalized to 1 (mean ± SEM n = 3; I, RM one-way ANOVA with Fisher’s LSD multiple comparisons test relative to control siRNA + 14 Gy IR, F and 95% CI in Source Data). J, K) IncuCyte live imaging of a Caspase 3/7 fluorescence reporter quantified in Fig. 7i (mean ± SEM; n in Fig. 7i legend). All panels, N = individual cells across all replicates, n = biological replicates, ns = not significant. Source numerical data and unprocessed blots are available in source data. Source data
Extended Data Fig. 8. Pharmacological or genetic alteration of DSB repair impacts interferon expression following IR.
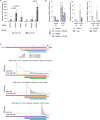
A) RT-qPCR from HeLa ± 14 Gy IR, siRNA, and/or 0.2 µM VE-822 (mean ± SEM n = 3 except control n = 6, and WAPL siRNA n = 4, Mixed-effect one-way ANOVA with Fisher’s LSD multiple comparisons test, F and 95% CI in Source Data). B) RT-qPCR of siRNA in Fig. 8a and Extended Data Fig. 8A (mean ± SEM of n = 3). C) Model. Activity of DSB repair pathways across cell cycle (top). Interpretation of repair kinetics following DSB induction in G1, S, or G2 phase cells (below) as a function of DSB load and cell cycle progression. A red dotted line indicates a theoretical DSB threshold that separates functional (green shading) and toxic (magenta shading) HR. Source numerical data are available in source data. Source data
Similar articles
- The efficiency of homologous recombination and non-homologous end joining systems in repairing double-strand breaks during cell cycle progression.
Bee L, Fabris S, Cherubini R, Mognato M, Celotti L. Bee L, et al. PLoS One. 2013 Jul 11;8(7):e69061. doi: 10.1371/journal.pone.0069061. Print 2013. PLoS One. 2013. PMID: 23874869 Free PMC article. - Analysis of chromatid-break-repair detects a homologous recombination to non-homologous end-joining switch with increasing load of DNA double-strand breaks.
Murmann-Konda T, Soni A, Stuschke M, Iliakis G. Murmann-Konda T, et al. Mutat Res Genet Toxicol Environ Mutagen. 2021 Jul;867:503372. doi: 10.1016/j.mrgentox.2021.503372. Epub 2021 Jun 12. Mutat Res Genet Toxicol Environ Mutagen. 2021. PMID: 34266628 - Polθ is phosphorylated by PLK1 to repair double-strand breaks in mitosis.
Gelot C, Kovacs MT, Miron S, Mylne E, Haan A, Boeffard-Dosierre L, Ghouil R, Popova T, Dingli F, Loew D, Guirouilh-Barbat J, Del Nery E, Zinn-Justin S, Ceccaldi R. Gelot C, et al. Nature. 2023 Sep;621(7978):415-422. doi: 10.1038/s41586-023-06506-6. Epub 2023 Sep 6. Nature. 2023. PMID: 37674080 Free PMC article. - Roles for 53BP1 in the repair of radiation-induced DNA double strand breaks.
Shibata A, Jeggo PA. Shibata A, et al. DNA Repair (Amst). 2020 Sep;93:102915. doi: 10.1016/j.dnarep.2020.102915. DNA Repair (Amst). 2020. PMID: 33087281 Review. - Genomic rearrangements induced by unscheduled DNA double strand breaks in somatic mammalian cells.
So A, Le Guen T, Lopez BS, Guirouilh-Barbat J. So A, et al. FEBS J. 2017 Aug;284(15):2324-2344. doi: 10.1111/febs.14053. Epub 2017 Mar 22. FEBS J. 2017. PMID: 28244221 Review.
Cited by
- Roles for the 3D genome in the cell cycle, DNA replication, and double strand break repair.
Giles KA, Taberlay PC, Cesare AJ, Jones MJK. Giles KA, et al. Front Cell Dev Biol. 2025 Feb 27;13:1548946. doi: 10.3389/fcell.2025.1548946. eCollection 2025. Front Cell Dev Biol. 2025. PMID: 40083661 Free PMC article. Review. - A CPC-shelterin-BTR axis regulates mitotic telomere deprotection.
Romero-Zamora D, Rogers S, Low RRJ, Page SG, Lane BJE, Kosaka S, Robinson AB, French L, Lamm N, Ishikawa F, Hayashi MT, Cesare AJ. Romero-Zamora D, et al. Nat Commun. 2025 Mar 17;16(1):2277. doi: 10.1038/s41467-025-57456-8. Nat Commun. 2025. PMID: 40097392 Free PMC article. - Mitotic lethality prevents inflammation.
Zierhut C, Villunger A. Zierhut C, et al. Nat Cell Biol. 2025 Jan;27(1):7-8. doi: 10.1038/s41556-024-01529-1. Nat Cell Biol. 2025. PMID: 39809996 No abstract available.
References
- Vitale, I., Galluzzi, L., Castedo, M. & Kroemer, G. Mitotic catastrophe: a mechanism for avoiding genomic instability. Nat. Rev. Mol. Cell Biol.12, 385–392 (2011). - PubMed
MeSH terms
LinkOut - more resources
Full Text Sources
Research Materials
