Iron ore facts (original) (raw)

Iron ore is a combination of minerals from which metallic iron can be extracted on an economic basis.
Key facts
- Canada is the ninth-largest producer of iron ore in the world.
- Canada’s iron ore is mined in Quebec, Newfoundland and Labrador, and Nunavut.
- Canada has some of the highest-grade iron ore in the world that is suitable for making green steel using electric arc furnaces.
Learn more about iron ore
 Uses
Uses
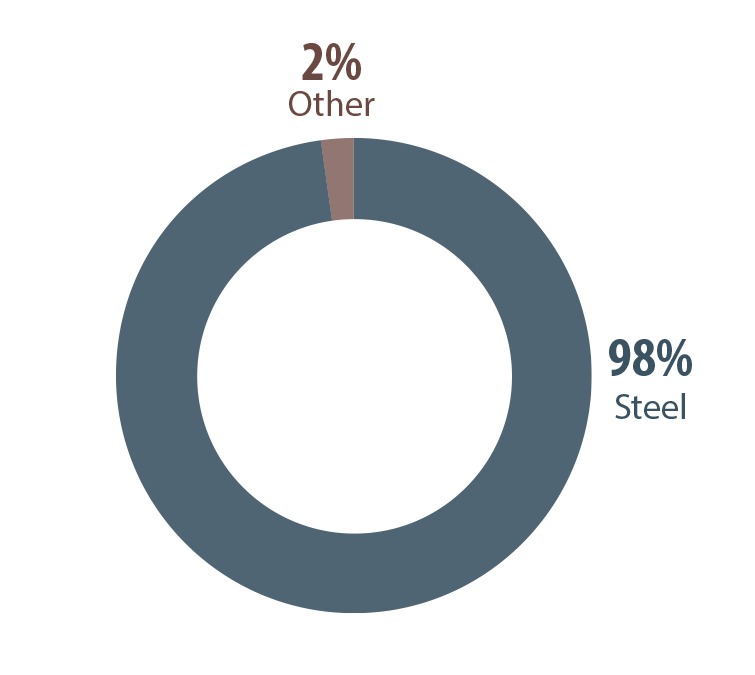
The primary use of iron ore (98%) is to make steel. The remaining 2% is used in various other applications, such as powdered iron for certain types of steel, auto parts and catalysts; radioactive iron for medicine; and iron blue in paints, inks, cosmetics, and plastics.
Iron ore, global uses, 2022
Other: powdered iron, iron 59, iron blue, black iron oxide
Text version
This pie chart shows the major global uses of iron ore. Steel represents 98%, while other mixed uses (i.e. powdered iron, radioactive iron [iron 59], iron blue, and black iron oxide) represent the remaining 2%.
 Production
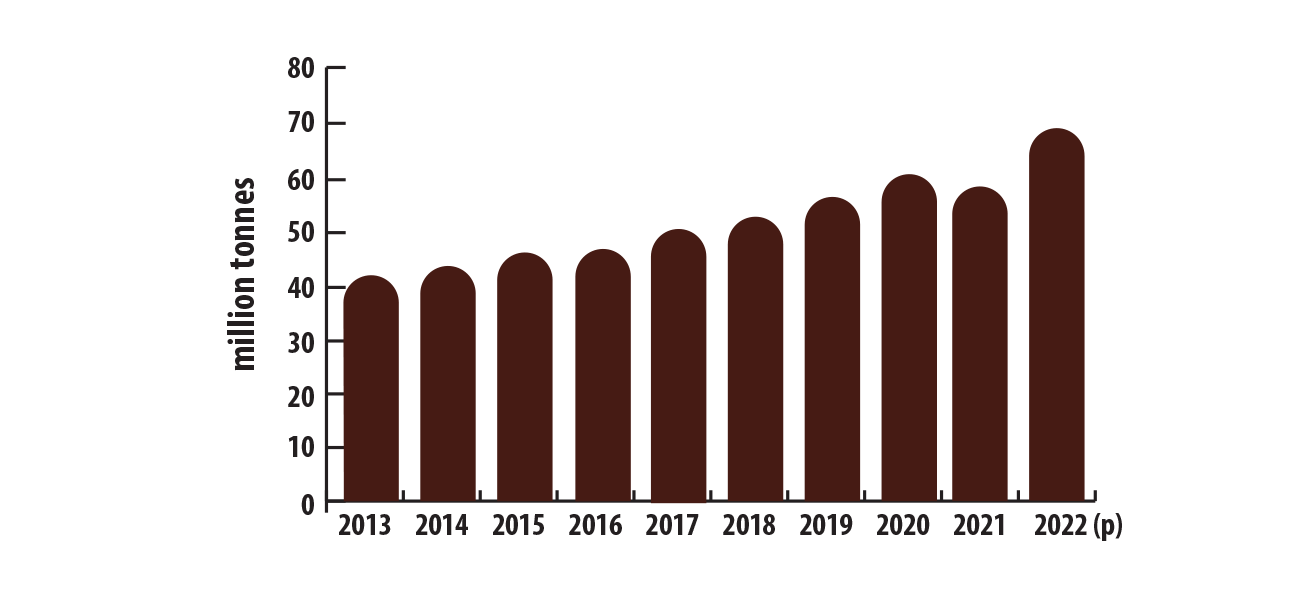
Canadian mine production of iron ore in concentrate and pellets was 56.0 million tonnes in 2022, an 18% increase compared to 2021.
Canada's estimated crude steel production for 2022 was 12 million tonnes, a decrease of 7% compared to 2021.
Canadian mine production of iron ore, 2013–2022 (p)
Text version
This bar graph shows Canada's annual mine production of iron ore from 2013 to 2022. Production in 2013 was 42.1 million tonnes, the lowest in the 10-year period. Annual production increased steadily up to 60.6 million tonnes in 2020. Production declined slightly to 58.3 million tonnes in 2021, increasing again to 69.0 million tonnes in 2022.
Most of Canada's iron ore comes from the Labrador Trough region bordering Quebec and Newfoundland and Labrador. A substantial amount is also produced by the Mary River Mine in Nunavut.
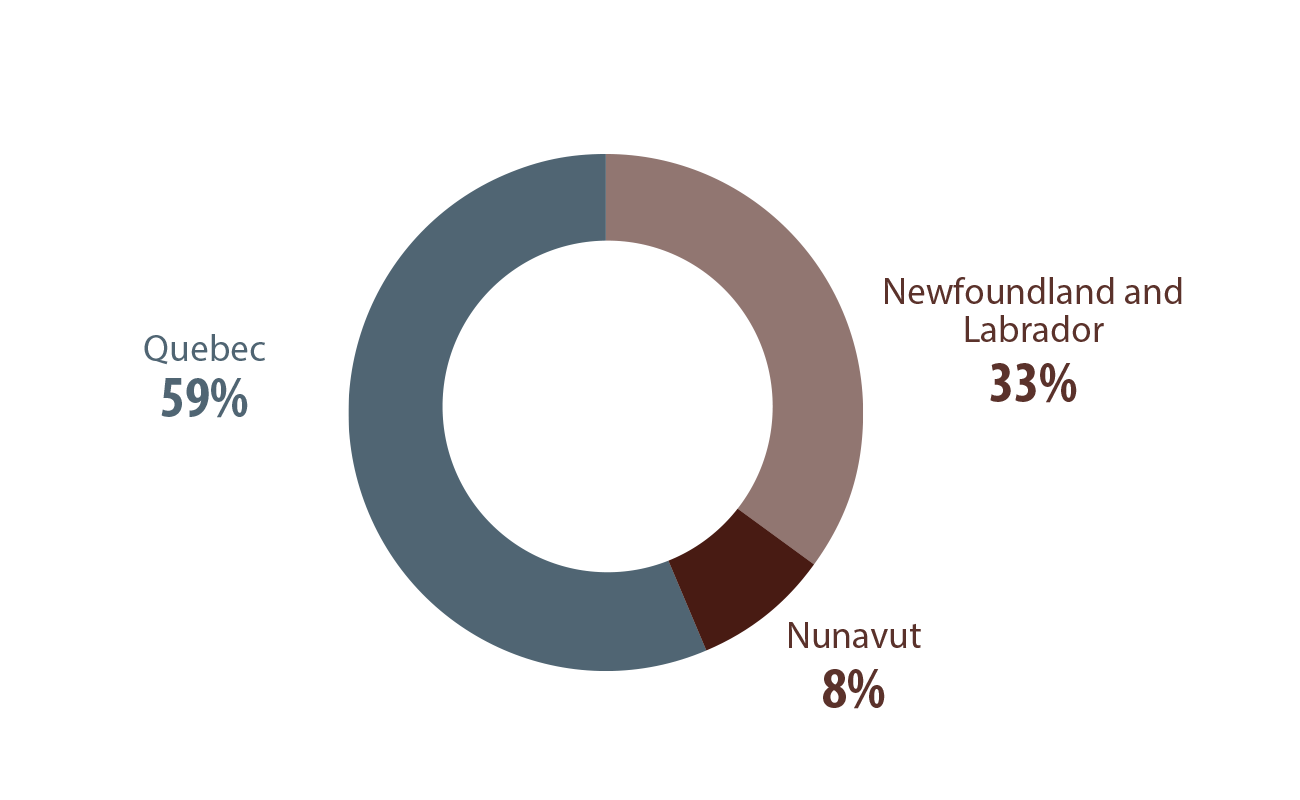
Canadian mine production (shipments) of iron ore, by province and territory, 2022 (p)
Text version
This graph shows Canadian production of iron ore by province and territory for 2022. Quebec accounted for 59% of the total production with 40.3 million tonnes, Newfoundland and Labrador accounted for 33% with 23.0 million tonnes, and Nunavut accounted for 8% with 5.7 million tonnes.
Consult a map of producing Canadian mines
 International context
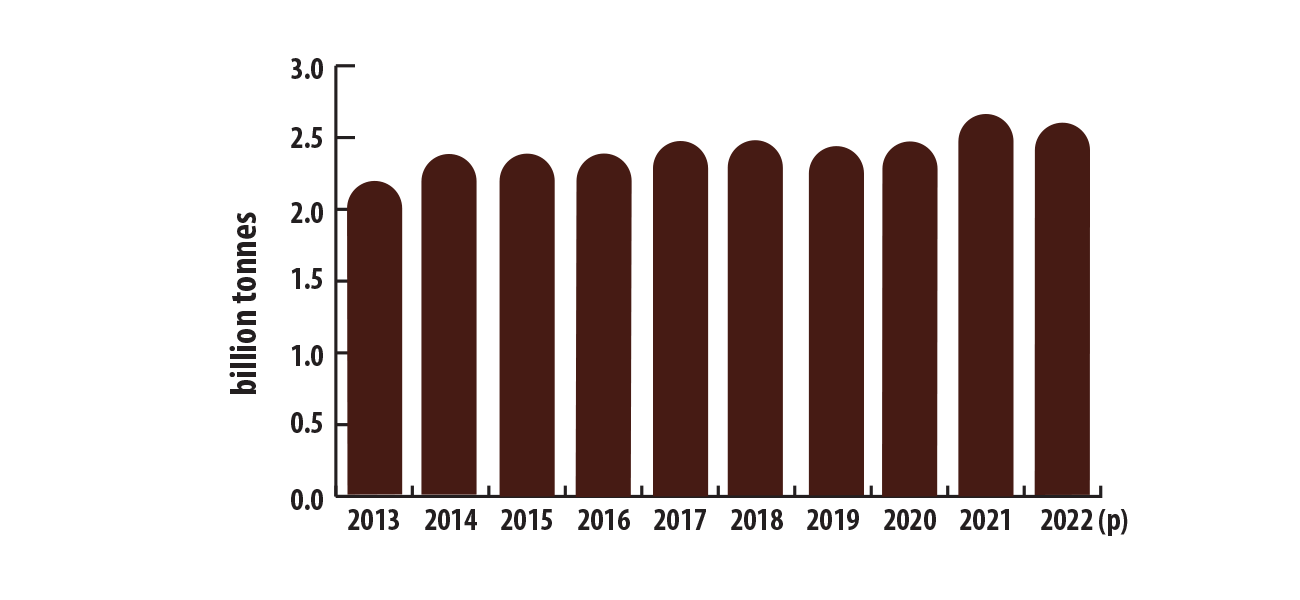
Global production of iron ore was estimated to have been 2,611 million tonnes in 2022, slightly lower than the 2,681 million tonnes produced in 2021. Global iron ore production is concentrated in the top four global producers, which together accounted for 75% of global production. Australia was the leading global producer of iron ore, accounting for 34% of the total production.
In 2022, Canada ranked as the ninth-leading producer of iron ore and sixth for reserves.
World mine production of iron ore, by country, 2022 (p)
| Ranking | Country | Million tonnes | Percentage of total |
|---|---|---|---|
| 1 | Australia | 880 | 33.7% |
| 2 | Brazil | 410 | 15.7% |
| 3 | China | 380 | 14.6% |
| 4 | India | 290 | 11.1% |
| 5 | Russia | 90 | 3.4% |
| 6 | South Africa | 76 | 2.9% |
| 7 | Ukraine | 76 | 2.9% |
| 8 | Iran | 75 | 2.9% |
| 9 | Canada | 69 | 2.6% |
| 10 | Kazakhstan | 66 | 2.5% |
| - | Other countries | 199 | 7.6% |
| Total | 2,611 | 100.0% |
World mine production of iron ore, 2013–2022 (p)
Text version
This bar graph displays the annual global mine production of iron ore from 2013 to 2022. Production in 2013 was 2,195 million tonnes and increased to 2,369 million tonnes by 2014. Production subsequently decreased to 2,365 million tonnes in 2015, before gradually increasing annually to 2,470 million tonnes in 2018. Iron ore production declined in 2019 to 2,450 million tonnes but rebounded to reach 2,474 million tonnes in 2020 and a decade high of 2,681 tonnes in 2021 before falling slightly to 2,611 million tonnes in 2022.
World reserves
World reserves of crude iron ore, by country, 2022 (p)
| Ranking | Country | Million tonnes | Percentage of total |
|---|---|---|---|
| 1 | Australia | 51,000 | 28.3% |
| 2 | Brazil | 34,000 | 18.9% |
| 3 | Russia | 29,000 | 16.1% |
| 4 | China | 20,000 | 11.1% |
| 5 | Ukraine | 6,500 | 3.6% |
| 6 | Canada | 6,000 | 3.3% |
| 7 | India | 5,500 | 3.1% |
| 8 | United States | 3,000 | 1.7% |
| 9 | Iran | 2,700 | 1.5% |
| - | Other countries | 22,300 | 12.4% |
| Total | 180,000 | 100.0% |
 Trade
Trade
Exports
Canada exported 55.1 million tonnes of iron ore valued at 8.8billionin2022comparedto53.9milliontonnesvaluedat8.8 billion in 2022 compared to 53.9 million tonnes valued at 8.8billionin2022comparedto53.9milliontonnesvaluedat10.1 billion in 2021. Higher export volume but lower export value reflects lower prices in 2022. Iron ore pellets accounted for 27% of the volume, whereas other concentrates (non-agglomerated) accounted for the remaining 73%.
Imports
Canada imported 7.8 million tonnes of iron ore valued at 944millionin2022,anincreasefrom2021,whichwas8.1milliontonnesvaluedat944 million in 2022, an increase from 2021, which was 8.1 million tonnes valued at 944millionin2022,anincreasefrom2021,whichwas8.1milliontonnesvaluedat963 million. Pellets represented 98% of the imported volume, whereas other concentrates represented 2%. The import of pellets came almost exclusively from the United States. Imports of concentrates came primarily from Australia (56%) and the United States (37%). Concentrates, non-agglomerated, are unfinished products used in the production of blast furnace pellets and pellets used for metallization.
In 2022, Canada was a net importer of semi-finished steel products, with imports of 9.1 million tonnes and exports of 6.7 million tonnes.
 Prices
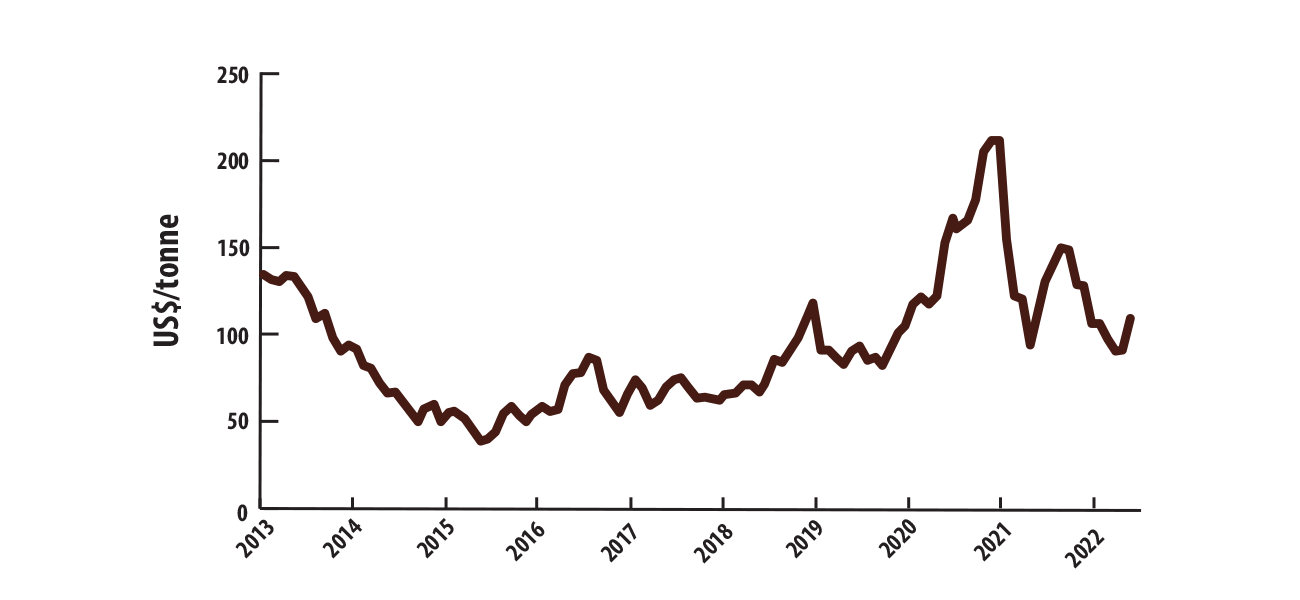
Iron ore prices have fluctuated significantly over the past decade, reaching a high of US$214 per tonne in June 2021 and a low of US$41 per tonne in December 2015.
In 2022, prices reached a peak of US$152 per tonne in March before declining to US$93 in October, increasing back up to US$112 by December. The variation in prices coincides with demand trends for iron ore from steel manufacturers, which are mostly in China.
Iron ore prices, monthly average, 2013–2022
Text version
This line graph shows average monthly iron ore prices in US dollars per tonne from 2013 to 2022. Based on China's import of iron ore fines of 62% iron content (average spot price in US dollars per metric tonne in a given year of unloading port/freight on board at the Tianjin port), the average price was US$135 in 2013.
The price in January 2013 was at a peak of US151andrapidlydecreaseduntilendof2015,whenitreachedadecadelowofUSUS151 and rapidly decreased until end of 2015, when it reached a decade low of USUS151andrapidlydecreaseduntilendof2015,whenitreachedadecadelowofUS41 in December 2015. The price of iron ore moderately recovered in 2016 and 2017, reaching US$89 in February 2017 before falling to US$72 by the end of the year. In 2019, the price started at US$76 and rose to US$120 by July. Prices subsided and hovered around US$90 until May 2020. Prices then rose to a decade high of US$214 in June 2021 before rapidly declining to US$96 per tonne in November 2021. Prices rebounded to US152inMarch2022,decreasedtoUS152 in March 2022, decreased to US152inMarch2022,decreasedtoUS93 in October 2022, but closed in December 2022 at $US112.
 Recycling
Steel is 100% recyclable, which means it can be reprocessed repeatedly into material of the same quality. Recycling produces significant savings in energy and raw materials. Each recycled tonne of scrap steel saves more than 1,400 kilograms of iron ore, 740 kilograms of coking coal and 120 kilograms of limestone.
With electric arc furnaces, steel can be made from 100% scrap metal feedstock. This production method greatly reduces the energy required to make steel, compared with primary steelmaking from ore. Since 1960, the energy required to produce 1 tonne of steel has decreased by 40%.
In 2022, Canada exported 4.6 million tonnes of steel scrap worth 3.1billion,comparedto4.9milliontonnesworth3.1 billion, compared to 4.9 million tonnes worth 3.1billion,comparedto4.9milliontonnesworth2.9 billion in 2021. Canada also imported 1.1 million of tonnes of steel scrap worth 377millionin2022,upfrom0.8milliontonnesin2021worth377 million in 2022, up from 0.8 million tonnes in 2021 worth 377millionin2022,upfrom0.8milliontonnesin2021worth311 million.
Notes and sources
(p) preliminary
Totals may be different because of rounding.
All dollars are Canadian unless otherwise indicated.
Uses
- Iron ore, global uses, 2022
- Iron – Minerals Education Coalition
Production
- Canadian estimated crude steel production
- World Steel Association
- Canadian mine production of iron ore, 2013–2022 (p)
- Natural Resources Canada; Statistics Canada
- Canadian mine production (shipments) of iron ore, by province and territory, 2022 (p)
- Natural Resources Canada; Statistics Canada
- company reports
International context
- World mine production of iron ore, by country, 2022 (p)
- Natural Resources Canada; U.S. Geological Survey; Statistics Canada
- An adjustment in the U.S. Geological Survey's methodology to estimate usable ore production instead of crude ore production resulted in adjusted totals from China beginning in 2015 and in lower overall world mine production.
- World mine production of iron ore, 2013–2022 (p)
- U.S. Geological Survey
- World reserves of crude iron ore, by country, 2022 (p)
- U.S. Geological Survey
Trade
- Natural Resources Canada; Statistics Canada
- Mineral trade includes ores, concentrates, and semi- and final-fabricated mineral products.
- Steel includes stage 3 semi-fabricated products.
Prices
- Iron ore prices, monthly average, 2013–2022
- World Bank
Recycling
- World Steel Organization, Circular Economy
- Natural Resources Canada; Statistics Canada
- Waste and scrap of steel, steel alloys and cast iron
Page details
Date modified:
2024-03-12
