Household Costs Indices, UK - Office for National Statistics (original) (raw)
.Annex A: Differences between HCIs and CPIH-consistent rates for UK household groups
This Annex explores the differences in divergence that are observed between household groups when using HCIs methodology (as published within this article) and CPIH-consistent methodology (as published in CPIH-consistent inflation rate estimates for UK household groups).
Differences between the divergence in the HCIs and CPIH-consistent rates for household groups are driven primarily by differences in expenditure shares. There are also a couple of differences in the price indices used (for example, in the way that owner occupiers’ housing costs (OOH) are calculated) that lead to different results. The HCIs methodology document provides details of the differences in CPIH and HCIs methodology, and the difference between these indices for all-households.
How do the HCIs differ to CPIH-consistent rates for retired and non-retired households?
The 12-month growth rate for retired and non-retired households in the HCIs are compared with the CPIH-consistent inflation rates for retired and non-retired households in Figure 25a. The indices calculated based on HCIs methodology show a greater divergence than the CPIH-consistent indices. To show this difference in divergence more clearly, Figure 25b provides a bar chart of the percentage point difference between retired and non-retired households using HCIs methodology and the percentage point difference between retired and non-retired households using CPIH-consistent methodology.
Figure 25a: 12-month growth rate for retired and non-retired households using both HCIs and CPIH-consistent methodology
UK, January 2006 to June 2017
Source: Office for National Statistics
Download this chart Figure 25a: 12-month growth rate for retired and non-retired households using both HCIs and CPIH-consistent methodology
Figure 25b: Difference in 12-month growth rate for retired and non-retired households using both HCIs and CPIH-consistent methodology
UK, January 2006 to June 2017
Source: Office for National Statistics
Download this chart Figure 25b: Difference in 12-month growth rate for retired and non-retired households using both HCIs and CPIH-consistent methodology
The HCIs typically show larger divergences between retired and non-retired households than are observed in CPIH-consistent rates for the same groups. Prior to 2011, both sets of indices displayed similar trends, with retired households typically experiencing stronger growth than non-retired households. Since 2011, the stories have diverged and the CPIH-consistent rates often show the reverse of the HCIs, for example in 2013, the HCIs show retired households to experience stronger growth than non-retired households, while the CPIH-consistent rates show non-retired households to be experiencing stronger growth.
To explore this further, Figure 26 displays the contributions that led to differences between the 12-month growth rates for retired and non-retired households in the HCIs. Figure 27 displays the contributions that led to the differences between the 12-month growth rates for retired and non-retired households using CPIH-consistent data.
Figure 26: Contributions to the difference in the 12-month growth rate: HCIs retired households less non-retired households
UK, January 2006 to June 2017
Source: Office for National Statistics
Notes:
- Stacked bars reflect the percentage point contributions of each of the 87 class-level items to the difference in 12-month growth rates. The contribution of each of the 87 class-level items is estimated separately, before being aggregated to 7 distinct categories.
- “Food & Drink” is composed of food, non-alcoholic and alcoholic beverages and tobacco. “Housing (exc. OOH)” is composed of actual rents and products and services for the repair of dwellings. Owner occupiers’ housing costs is a separate category, measured using the payments approach. “Elect., gas and fuel” is composed of electricity, gas and other household fuels as well as fuels and lubricants for motor vehicles. “Transport and package holidays” includes passenger transport by road, rail, air and sea, as well as package holidays. “Education” reflects the division-level contribution. The “other” category reflects the combined contributions of the remaining class-level items, bringing the sum of contributions to the inflation rate.
- A reduction in the contribution of series to the annual rate of change need not imply falling prices, but could also reflect a lower rate of increase than the previous year.
- Contributions may not sum due to rounding.
Download this chart Figure 26: Contributions to the difference in the 12-month growth rate: HCIs retired households less non-retired households
Figure 27: Contributions to the difference in 12-month growth: CPIH-consistent non-retired households less CPIH-consistent retired households
UK, January 2006 to June 2017
Source: Office for National Statistics
Notes:
- Stacked bars reflect the percentage point contributions of each of the 87 class-level items to the difference in 12-month growth rates. The contribution of each of the 87 class-level items is estimated separately, before being aggregated to 7 distinct categories.
- “Food & Drink” is composed of food, non-alcoholic and alcoholic beverages and tobacco. “Housing (exc. OOH)” is composed of actual rents and products and services for the repair of dwellings. Owner occupiers’ housing costs is a separate category, measured using the rental equivalence approach. “Elect., gas and fuel” is composed of electricity, gas and other household fuels as well as fuels and lubricants for motor vehicles. “Transport and package holidays” includes passenger transport by road, rail, air and sea, as well as package holidays. “Education” reflects the division-level contribution. The “other” category reflects the combined contributions of the remaining class-level items, bringing the sum of contributions to the inflation rate.
- A reduction in the contribution of series to the annual rate of change need not imply falling prices, but could also reflect a lower rate of increase than the previous year.
- Contributions may not sum due to rounding.
Download this chart Figure 27: Contributions to the difference in 12-month growth: CPIH-consistent non-retired households less CPIH-consistent retired households
Using the data presented in Figure 26 and Figure 27, Figure 28 shows the main categories that cause larger differences between retired and non-retired households in the HCIs compared with the differences observed between retired and non-retired households using CPIH-consistent data.
In essence, it shows the difference between the contributions to the 12-month growth rate for retired households less non-retired households in the HCIs (Figure 26), less the difference between the contributions to the 12-month growth rate for retired households less non-retired households based on CPIH-consistent data (Figure 27). Therefore where the line lies above zero this reflects a greater difference between retired and non-retired households in the HCIs and where the line lies below zero this reflects a greater difference between retired and non-retired households when using CPIH-consistent measures.
Figure 28: Contributions to the difference between retired and non-retired households’ 12-month growth rates between HCIs and CPIH estimates
UK, January 2006 to June 2017
Source: Office for National Statistics
Notes:
- Stacked bars reflect the difference between the percentage point contributions of each of the 87 class-level items to the difference in the 12-month growth rates. The contribution of each of the 87 class-level items is estimated separately, before being aggregated to 7 distinct categories.
- “Food & Drink” is composed of food, non-alcoholic and alcoholic beverages and tobacco. “Housing (exc. OOH)” is composed of actual rents and products and services for the repair of dwellings. OOH is owner occupiers’ housing costs and is a separate category, measured using the payments approach in the HCIs and the rental equivalence approach in the CPIH. “Elect., gas and fuel” is composed of electricity, gas and other household fuels as well as fuels and lubricants for motor vehicles. “Transport and package holidays” includes passenger transport by road, rail, air and sea, as well as package holidays. “Education” reflects the division-level contribution. The “other” category reflects the combined contributions of the remaining class-level items, bringing the sum of contributions to the inflation rate.
- A reduction in the contribution of series to the annual rate of change need not imply falling prices, but could also reflect a lower rate of increase than the previous year.
- Contributions may not sum due to rounding.
Download this chart Figure 28: Contributions to the difference between retired and non-retired households’ 12-month growth rates between HCIs and CPIH estimates
The categories that typically lead to greater divergences between retired and non-retired households in the HCIs than in the CPIH-consistent data are food and drink, and electricity, gas and fuel. The categories that cause higher divergence in the HCIs are partially offset by owner-occupiers’ housing costs (OOH), where there is a greater divergence between retired and non-retired households in the CPIH-consistent rates. To explore this further, the average expenditure shares for the period 2005 to 2017 for retired and non-retired households are provided in Figure 29, comparing HCIs and CPIH-consistent weights.
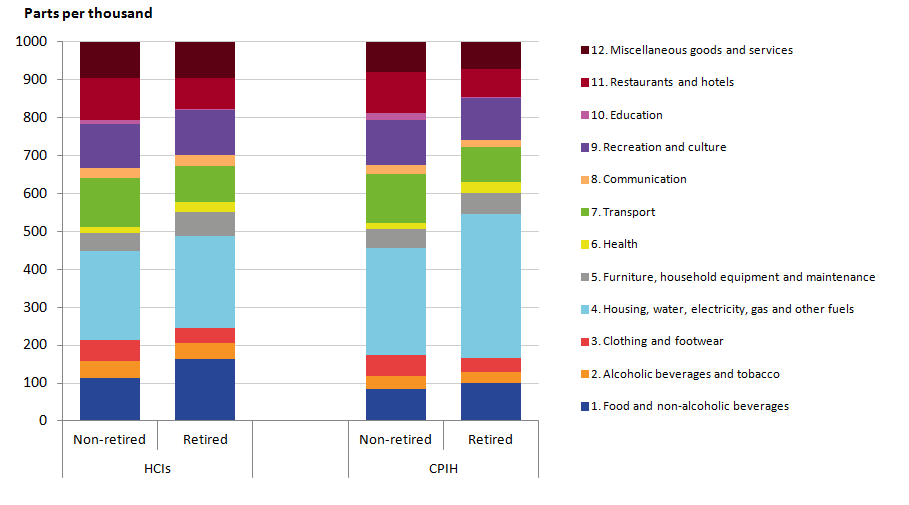
The greatest difference between the retired and non-retired households weights calculated using the HCIs and CPIH-consistent methodology is with regards to housing costs. Retired and non-retired households spend a greater proportion of their expenditure on housing costs when measured using CPIH-consistent methodology and there is also a greater divergence seen between these groups. However, greater divergence for food and drink is observed between retired and non-retired households using HCIs methodology than when using the CPIH-consistent approach.
Figure 29: Average expenditure shares for each category of spending, retired and non-retired households, HCIs and CPIH-consistent rates
UK, 2005 to 2017
Source: Office for National Statistics
Notes:
- Expenditure shares may not sum to 1,000 due to rounding.
- Weights for each category of spending are averaged across the period of 2005 to 2017 (only the weights for January 2017 are included in the average).
Download this image Figure 29: Average expenditure shares for each category of spending, retired and non-retired households, HCIs and CPIH-consistent rates
Figure 30 explores the differences in expenditure shares for the categories of spending provided in the contributions charts in Figures 26 to 28. These are: food and drink; housing (excluding OOH); OOH; electricity, gas and fuels; transport and package holidays; education; and other.
Figure 30: Percentage difference in average expenditure shares for each category of spending, retired and non-retired households, HCIs and CPIH-consistent rates
UK, 2005 to 2017
Source: Office for National Statistics
Download this chart Figure 30: Percentage difference in average expenditure shares for each category of spending, retired and non-retired households, HCIs and CPIH-consistent rates
Retired and non-retired households show a notably greater divergence in expenditure patterns for the categories food and drink, and electricity, gas and fuels using HCIs methodology than when using CPIH-consistent methodology. Conversely, the divergence in expenditure patterns for OOH is considerably greater when using CPIH-consistent methodology as opposed to HCIs methodology.
When coupled with categories of spending that typically experience regular changes in price (for example, food and drink, and electricity, gas and fuels), divergences in expenditure shares result in greater divergences in the household group indices.
How do the HCIs differ to CPIH-consistent rates for low-income and high-income households?
The 12-month growth rate for low- and high-income households in the HCIs (represented by the second and ninth decile respectively) are compared with the CPIH-consistent inflation rates for low- and high-income households (represented by the same deciles) in Figure 31a. To show this difference in divergence more clearly, Figure 31b provides a bar chart of the percentage point difference between low- and high-income households using HCIs methodology and the percentage point difference between low- and high-income households using CPIH-consistent methodology.
Figure 31a: 12-month growth rate for low- and high-income households (using the second and ninth deciles respectively), using both HCIs and CPIH-consistent methodology
UK, January 2006 to June 2017
Source: Office for National Statistics
Download this chart Figure 31a: 12-month growth rate for low- and high-income households (using the second and ninth deciles respectively), using both HCIs and CPIH-consistent methodology
Figure 31b: Difference in 12-month growth rate for low- and high-income households using both HCIs and CPIH-consistent methodology
UK, January 2006 to June 2017
Source: Office for National Statistics
Download this chart Figure 31b: Difference in 12-month growth rate for low- and high-income households using both HCIs and CPIH-consistent methodology
The HCIs typically show larger divergences between low- and high-income households than are observed in the CPIH-consistent rates for the same groups. Although the observed difference between low- and high-income groups is greater in the HCIs typically the same patterns emerge irrespective of which methodology is used.
To explore this further, Figure 32 displays the contributions that led to differences between the 12-month growth rates for low- and high-income households in the HCIs. Figure 33 displays the contributions that led to the differences between the 12-month growth rates for low- and high-income households using CPIH-consistent data.
Figure 32: Contributions to the difference in the 12-month growth rate, low-income households (second decile) less high-income households (ninth decile), HCIs methodology
UK, January 2006 to June 2017
Source: Office for National Statistics
Notes:
- Stacked bars reflect the percentage point contributions of each of the 87 class-level items to the difference in 12-month growth rates. The contribution of each of the 87 class-level items is estimated separately, before being aggregated to 7 distinct categories.
- “Food & Drink” is composed of food, non-alcoholic and alcoholic beverages and tobacco. “Housing (exc. OOH)” is composed of actual rents and products and services for the repair of dwellings. Owner occupiers’ housing costs is a separate category, measured using the payments approach. “Elect., gas and fuel” is composed of electricity, gas and other household fuels as well as fuels and lubricants for motor vehicles. “Transport and package holidays” includes passenger transport by road, rail, air and sea, as well as package holidays. “Education” reflects the division-level contribution. The “other” category reflects the combined contributions of the remaining class-level items, bringing the sum of contributions to the inflation rate.
- A reduction in the contribution of series to the annual rate of change need not imply falling prices, but could also reflect a lower rate of increase than the previous year.
- Contributions may not sum due to rounding.
Download this chart Figure 32: Contributions to the difference in the 12-month growth rate, low-income households (second decile) less high-income households (ninth decile), HCIs methodology
Figure 33: Contributions to the difference in the 12-month growth rate: low-income households (second decile) less high-income households (ninth decile), CPIH-consistent methodology
UK, January 2006 to June 2017
Source: Office for National Statistics
Notes:
- Stacked bars reflect the percentage point contributions of each of the 87 class-level items to the difference in 12-month growth rates. The contribution of each of the 87 class-level items is estimated separately, before being aggregated to 7 distinct categories.
- “Food & Drink” is composed of food, non-alcoholic and alcoholic beverages and tobacco. “Housing (exc. OOH)” is composed of actual rents and products and services for the repair of dwellings. Owner occupiers’ housing costs is a separate category, measured using the rental equivalence approach. “Elect., gas and fuel” is composed of electricity, gas and other household fuels as well as fuels and lubricants for motor vehicles. “Transport and package holidays” includes passenger transport by road, rail, air and sea, as well as package holidays. “Education” reflects the division-level contribution. The “other” category reflects the combined contributions of the remaining class-level items, bringing the sum of contributions to the inflation rate.
- A reduction in the contribution of series to the annual rate of change need not imply falling prices, but could also reflect a lower rate of increase than the previous year.
- Contributions may not sum due to rounding.
Download this chart Figure 33: Contributions to the difference in the 12-month growth rate: low-income households (second decile) less high-income households (ninth decile), CPIH-consistent methodology
Using the data presented in Figure 32 and Figure 33, Figure 34 shows the main categories that cause larger differences between low- and high-income households in the HCIs compared with the differences observed between low- and high-income households using CPIH-consistent data.
In essence, it shows the difference between the contributions to the 12-month growth rate for low-income households less high-income households in the HCIs (Figure 32), less the difference between the contributions to the 12-month growth rate for low-income households less high-income households based on CPIH-consistent data (Figure 33). Therefore where the line and contributions lie above zero this reflects a greater difference between low- and high-income households in the HCIs and where the line and contributions lie below zero this reflects a greater difference between low- and high-income households when using CPIH-consistent measures.
Figure 34: Contributions to the difference between low- and high-income households’ 12-month growth rates between HCIs and CPIH estimates
UK, January 2006 to June 2017
Source: Office for National Statistics
Notes:
- Stacked bars reflect the difference between the percentage point contributions of each of the 87 class-level items to the difference in the 12-month growth rates. The contribution of each of the 87 class-level items is estimated separately, before being aggregated to 7 distinct categories.
- “Food & Drink” is composed of food, non-alcoholic and alcoholic beverages and tobacco. “Housing (exc. OOH)” is composed of actual rents and products and services for the repair of dwellings. OOH is owner occupiers’ housing costs and is a separate category, measured using the payments approach in the HCIs and the rental equivalence approach in the CPIH. “Elect., gas and fuel” is composed of electricity, gas and other household fuels as well as fuels and lubricants for motor vehicles. “Transport and package holidays” includes passenger transport by road, rail, air and sea, as well as package holidays. “Education” reflects the division-level contribution. The “other” category reflects the combined contributions of the remaining class-level items, bringing the sum of contributions to the inflation rate.
- A reduction in the contribution of series to the annual rate of change need not imply falling prices, but could also reflect a lower rate of increase than the previous year.
- Contributions may not sum due to rounding.
Download this chart Figure 34: Contributions to the difference between low- and high-income households’ 12-month growth rates between HCIs and CPIH estimates
The categories that typically lead to greater divergences between low- and high-income households in the HCIs than in the CPIH-consistent data are food and drink, and electricity, gas and fuel. OOH is an interesting category as it shows opposing movements throughout much of the period of analysis covered, depending on which method is used. While changes in OOH typically contribute to high-income households experiencing stronger growth in the HCIs, these changes contribute to low-income households experiencing stronger growth in the CPIH-consistent groups. These opposing differences in contributions within this category of spending lead to the offsetting trend displayed in Figure 34.
Another interesting category is transport and package holidays, which are showing some volatility in contributions between the two sets of measures. To explore these trends further, the average expenditure shares for all categories of spending for low- and high-income households are provided in Figure 35, comparing HCIs and CPIH-consistent weights between 2005 and 2017.
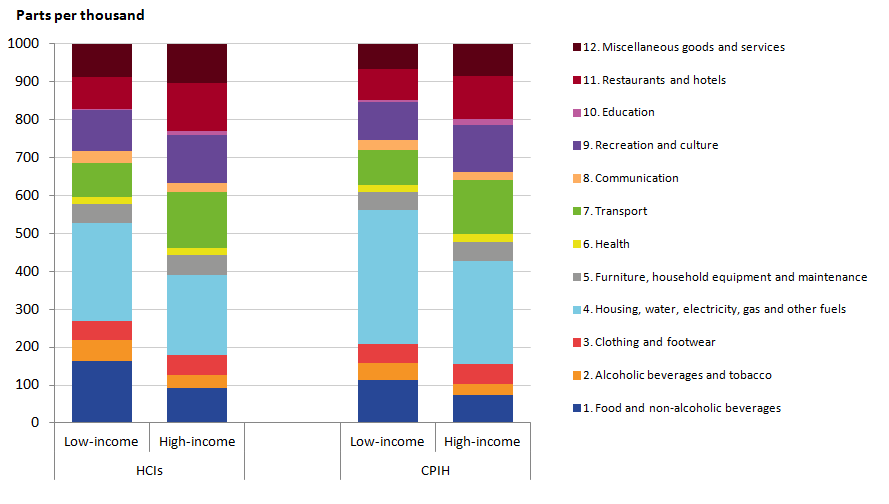
Figure 35: Average expenditure shares for each category of spending, low- and high-income households, HCIs and CPIH-consistent rates
UK, 2005 to 2017
Source: Office for National Statistics
Notes:
- Expenditure shares may not sum to 1,000 due to rounding.
- Weights for each category of spending are averaged across the period of 2005 to 2017 (only the weights for January 2017 are included in the average).
Download this image Figure 35: Average expenditure shares for each category of spending, low- and high-income households, HCIs and CPIH-consistent rates
The greatest difference between the low- and high-income households’ weights calculated using the HCIs and CPIH-consistent methodology is with regards to housing costs. Low- and high-income households spend a greater proportion of their expenditure on housing costs when measured using CPIH-consistent methodology. Greater divergence for food and drink are observed between low- and high-income households using HCIs methodology than when using the CPIH-consistent approach.
Figure 36 explores the differences in expenditure shares for the categories of spending provided in Figures 32 to 34. These are: food and drink; housing (excluding OOH); OOH; electricity, gas and fuels; transport and package holidays; education; and other.
Figure 36: Percentage difference in average expenditure shares for each category of spending, low- and high-income households, HCIs and CPIH-consistent rates
UK, 2005 to 2017
Source: Office for National Statistics
Download this chart Figure 36: Percentage difference in average expenditure shares for each category of spending, low- and high-income households, HCIs and CPIH-consistent rates
The HCI subgroups show a greater divergence in food and drink, and electricity, gas and fuels. Coupled with large price movements in these categories of spending, these are the categories of spending that contribute the most to the difference in HCIs being greater than the difference in CPIH-consistent rates between low- and high-income households.
While the divergence in expenditure shares in transport and package holidays seems similar using the previous aggregated categories, there are still large contributions coming from within this sector. The averaging of the expenditure across all years of analysis obscures some of the changes in weights. The volatility in weights for “passenger transport by air” leads to the discrepancies in divergence between the HCIs and CPIH-consistent rates.
How do the HCIs differ to CPIH-consistent rates for households with and without children?
The 12-month growth rates for households with and without children in the HCIs are compared with the CPIH-consistent inflation rates for households with and without children in Figure 37a. To show the difference in divergence more clearly, Figure 37b provides a bar chart of the percentage point difference between households with and without children using HCIs methodology and the percentage point difference between households with and without children using CPIH-consistent methodology.
Figure 37a: 12-month growth rate for households with and without children using both HCIs and CPIH-consistent methodology
UK, January 2006 to June 2017
Source: Office for National Statistics
Download this chart Figure 37a: 12-month growth rate for households with and without children using both HCIs and CPIH-consistent methodology
Figure 37b: Difference in 12-month growth rate for households with and without children using both HCIs and CPIH-consistent methodology
UK, January 2006 to June 2017
Source: Office for National Statistics
Download this chart Figure 37b: Difference in 12-month growth rate for households with and without children using both HCIs and CPIH-consistent methodology
Prior to 2013, households with and without children showed a greater divergence in their 12-month growth rate when measured using HCIs methodology as opposed to when they are measured using CPIH-consistent methodology. Less divergence between the two groups has been seen since 2013 and this is true irrespective of the methodology used. While in earlier years of the analysis (2006 to 2010) households without children experienced stronger growth than households with children using both methods, since 2010 the data provides a less consistent pattern.
To explore this further, Figure 38 displays the contributions that led to differences between the 12-month growth rates for households with and without children in the HCIs. Figure 39 displays the contributions that led to the differences between the 12-month growth rates for households with and without children using CPIH-consistent data.
Figure 38: Contributions to the difference in the 12-month growth rate, households without and with children, HCIs methodology
UK, January 2006 to June 2017
Source: Office for National Statistics
Notes:
- Stacked bars reflect the percentage point contributions of each of the 87 class-level items to the difference in 12-month growth rates. The contribution of each of the 87 class-level items is estimated separately, before being aggregated to 7 distinct categories.
- “Food & Drink” is composed of food, non-alcoholic and alcoholic beverages and tobacco. “Housing (exc. OOH)” is composed of actual rents and products and services for the repair of dwellings. Owner occupiers’ housing costs is a separate category, measured using the payments approach. “Elect., gas and fuel” is composed of electricity, gas and other household fuels as well as fuels and lubricants for motor vehicles. “Transport and package holidays” includes passenger transport by road, rail, air and sea, as well as package holidays. “Education” reflects the division-level contribution. The “other” category reflects the combined contributions of the remaining class-level items, bringing the sum of contributions to the inflation rate.
- A reduction in the contribution of series to the annual rate of change need not imply falling prices, but could also reflect a lower rate of increase than the previous year.
- Contributions may not sum due to rounding.
Download this chart Figure 38: Contributions to the difference in the 12-month growth rate, households without and with children, HCIs methodology
Figure 39: Contributions to the difference in the 12-month growth rate: households without and with children, CPIH-consistent methodology
UK, January 2006 to June 2017
Source: Office for National Statistics
Notes:
- Stacked bars reflect the percentage point contributions of each of the 87 class-level items to the difference in 12-month growth rates. The contribution of each of the 87 class-level items is estimated separately, before being aggregated to 7 distinct categories.
- “Food & Drink” is composed of food, non-alcoholic and alcoholic beverages and tobacco. “Housing (exc. OOH)” is composed of actual rents and products and services for the repair of dwellings. Owner occupiers’ housing costs is a separate category, measured using the rental equivalence approach. “Elect., gas and fuel” is composed of electricity, gas and other household fuels as well as fuels and lubricants for motor vehicles. “Transport and package holidays” includes passenger transport by road, rail, air and sea, as well as package holidays. “Education” reflects the division-level contribution. The “other” category reflects the combined contributions of the remaining class-level items, bringing the sum of contributions to the inflation rate.
- A reduction in the contribution of series to the annual rate of change need not imply falling prices, but could also reflect a lower rate of increase than the previous year.
- Contributions may not sum due to rounding.
Download this chart Figure 39: Contributions to the difference in the 12-month growth rate: households without and with children, CPIH-consistent methodology
Using the data presented in Figure 38 and Figure 39, Figure 40 shows the main categories that cause larger differences between households with and without children in the HCIs compared with the differences observed between households with and without children using CPIH-consistent data.
In essence, it shows the difference between the contributions to the 12-month growth rate for households without children less households with children in the HCIs (Figure 38), less the difference between the contributions to the 12-month growth rate for households without children less households with children based on CPIH-consistent data (Figure 39). Therefore where the line and contributions lie above zero this reflects a greater difference between household groups in the HCIs and where the line and contributions lie below zero this reflects a greater difference between household groups when using CPIH-consistent measures.
Figure 40: Contributions to the difference between households’ with and without children 12-month growth rates between HCIs and CPIH estimates
UK, January 2006 to June 2017
Source: Office for National Statistics
Notes:
- Stacked bars reflect the difference between the percentage point contributions of each of the 87 class-level items to the difference in the 12-month growth rates. The contribution of each of the 87 class-level items is estimated separately, before being aggregated to 7 distinct categories.
- “Food & Drink” is composed of food, non-alcoholic and alcoholic beverages and tobacco. “Housing (exc. OOH)” is composed of actual rents and products and services for the repair of dwellings. OOH is owner occupiers’ housing costs and is a separate category, measured using the payments approach in the HCIs and the rental equivalence approach in the CPIH. “Elect., gas and fuel” is composed of electricity, gas and other household fuels as well as fuels and lubricants for motor vehicles. “Transport and package holidays” includes passenger transport by road, rail, air and sea, as well as package holidays. “Education” reflects the division-level contribution. The “other” category reflects the combined contributions of the remaining class-level items, bringing the sum of contributions to the inflation rate.
- A reduction in the contribution of series to the annual rate of change need not imply falling prices, but could also reflect a lower rate of increase than the previous year.
- Contributions may not sum due to rounding.
Download this chart Figure 40: Contributions to the difference between households’ with and without children 12-month growth rates between HCIs and CPIH estimates
The categories that typically lead to greater divergences between households with and without children in the HCIs than in the CPIH-consistent data are food and drink, and electricity, gas and fuel. The categories that cause higher divergence in the HCIs are partially offset by OOH, where there is typically a greater divergence in the CPIH-consistent rates, except between 2009 and 2010, where the payments approach to OOH leads to a greater divergence in the HCIs between households with and without children.
Education also consistently leads to a greater difference in 12-month growth rates between households with and without children in the HCIs, reflecting the larger divergence in weight in this category when using HCIs methodology as opposed to CPIH-consistent methodology.
Figure 41 visualises the differences in weights using the HCIs and CPIH-consistent methodology between households with and without children. As the differences at the division level are minimal, to explore the trends further Figure 42 explores the differences in expenditure shares for the categories of spending provided in Figures 38 to 40. These are: food and drink; housing (excluding OOH); OOH; electricity, gas and fuels; transport and package holidays; education; and other.
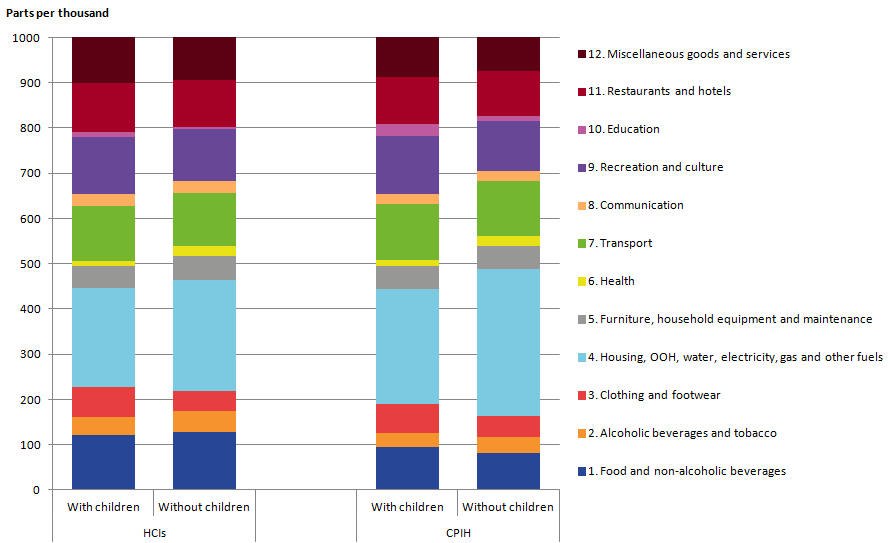
Figure 41: Average expenditure shares for each category of spending, households with and without children, HCIs and CPIH-consistent rates
UK 2005 to 2017
Source: Office for National Statistics
Notes:
- Expenditure shares may not sum to 1,000 due to rounding.
- Weights for each category of spending are averaged across the period of 2005 to 2017 (only the weights for January 2017 are included in the average).
- Correction - 27 February 2018: A small error occurred in Figure 41 due to mislabelling of data. We have corrected this error. We apologise for any inconvenience.
Download this image Figure 41: Average expenditure shares for each category of spending, households with and without children, HCIs and CPIH-consistent rates
Figure 42: Percentage difference in average expenditure shares for each category of spending, households with and without children, HCIs and CPIH-consistent rates
UK 2005 to 2017
Source: Office for National Statistics
Download this chart Figure 42: Percentage difference in average expenditure shares for each category of spending, households with and without children, HCIs and CPIH-consistent rates
As with the other subgroups considered within this article, the greater divergence in the HCIs is driven by the categories food and drink, and electricity, gas and fuels. This is driven by a greater divergence in the weights using HCIs methodology as opposed to using CPIH-consistent methodology. The HCIs also show a slightly greater divergence in the weights for education and, coupled with the large price movements within this category of spending, this also contributes to a greater divergence between the HCIs than the CPIH-consistent rates.
The differences that lead to greater divergence in the HCIs are somewhat offset by OOH, where there is a greater divergence in the weights for the CPIH-consistent households with and without children than there is for the HCIs households with and without children.