1. How people around the world view diversity in their countries (original) (raw)
Global migration has increased in the past few decades, and the 27 nations surveyed, collectively, are home to more than half of the world’s international migrants.
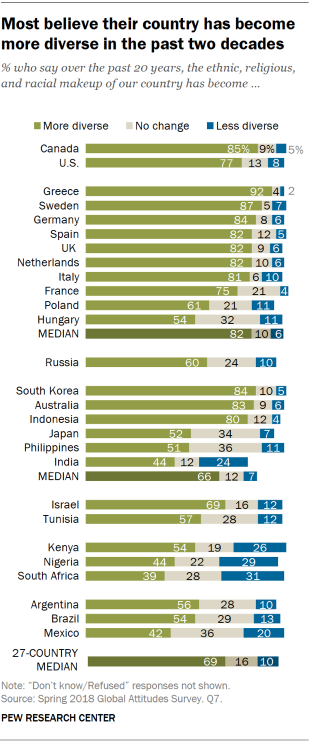
Most of those surveyed in these nations say their country has become more diverse in the past 20 years (median of 69%). While this perception is very common in Canada, Europe, the United States and several Asia-Pacific nations, fewer people in other regions see this change happening in their society.
Among the countries surveyed, Greeks are the most likely to say their country has become more diverse (92%). Across Europe, at least three-in-four agree in Sweden, Germany, Spain, the United Kingdom, the Netherlands, Italy and France. Smaller shares of Poles (61%) and Hungarians (54%) have seen an increase in their country’s ethnic, religious and racial diversity. Meanwhile, six-in-ten Russians say their country has become more diverse over the past 20 years.
In the Asia-Pacific nations surveyed, there is a pronounced split between the countries where most people have seen an increase in diversity and the countries where this change is less commonly perceived. At least eight-in-ten in South Korea, Australia and Indonesia say the composition of their country is becoming more varied. Roughly half in Japan (52%) and the Philippines (51%) and only 44% in India share this view.
Roughly four-in-ten or more in each of the sub-Saharan African and Latin American countries surveyed say the ethnic, religious and racial composition of their country has become more diverse. These countries have some of the smallest shares who hold this view among the nations polled.
In Israel and the U.S., perceptions of diversity differ by respondent ethnicity or race. Israeli Jews (73%) are more likely to see their country as becoming more diverse than Israeli Arabs (55%). And in the U.S., white Americans (80%) are more likely than black Americans (69%) to think their country is becoming more diverse.
Globally, perceived increases in diversity welcomed more than resisted
A median of 23% oppose increasing diversity in their country – they view more diversity as a bad thing or less diversity as a good thing for their country – but overall, more people favor a more heterogenous society (median of 45%).
Majorities in eight countries – Indonesia, South Korea, Canada, UK, the U.S., Australia, Spain and Sweden – favor more diversity in their country. Indonesians have the most positive attitudes toward diversity overall: 76% are supportive of increasing diversity and only 5% are opposed (12% say there has been no change, so their attitudes on whether this is good or bad cannot be categorized).
Europeans tend to be more ambivalent about increasing diversity. For example, most Swedes see their country as becoming more diverse, but only 56% of people are in favor of this change while 30% are opposed. Attitudes in Greece about diversity are the most negative among the countries surveyed; while most agree that their country has become less homogenous in recent years, only 17% are in favor of this change and 62% are against it. A similar though less stark pattern can be seen in Italy. Many Italians believe their society has become more diverse and just under half (45%) are opposed.
There is moderate support for a more diverse citizenry across the countries surveyed in the Middle East and North Africa, sub-Saharan Africa and Latin America. Overall, more people tend to say their country’s level of diversity has not changed in these countries compared with countries in other regions.
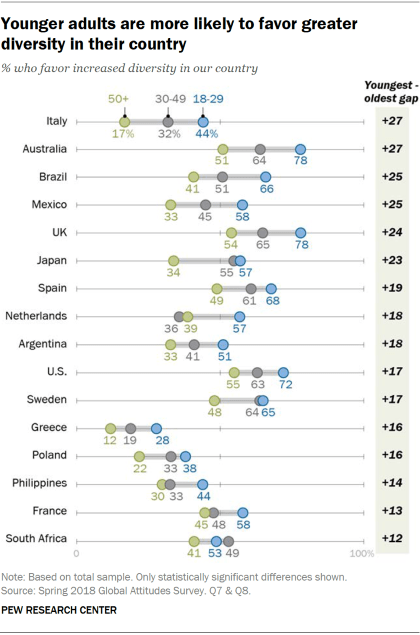
In more than half of the countries surveyed, younger adults are more in favor of increasing diversity than older adults. This generation gap is more than 20 percentage points in Japan, the UK, Mexico, Brazil, Australia and Italy. For example, only 17% of Italians ages 50 and older are supportive of increasing diversity, compared with 44% of 18- to 29-year-olds.
There are also differences between people on the left and the right of the political spectrum in 11 of the 18 countries where ideology was measured. In each country, people on the left are more likely than those on the right to favor a more ethnically, religiously and racially diverse society.
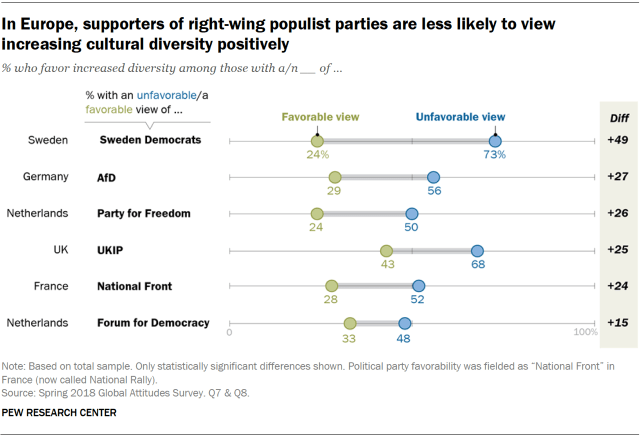
Consistent with this finding, people who hold favorable views of many of the right-wing populist parties in Europe are also less likely to approve of increasing diversity in their country. The difference is especially pronounced in Sweden: Only 24% of people who favor the Sweden Democrats are in favor of a more diverse citizenry, compared with 73% of people with an unfavorable view of the party.
There are also large differences between those with favorable and unfavorable views of AfD in Germany, Party for Freedom and the Forum for Democracy in the Netherlands, UKIP in the UK and National Rally (formerly National Front) in France.
In the U.S., Democrats and independents who lean to the Democratic Party (70%) are more likely to favor increasing diversity than Republicans and Republican leaners (54%).
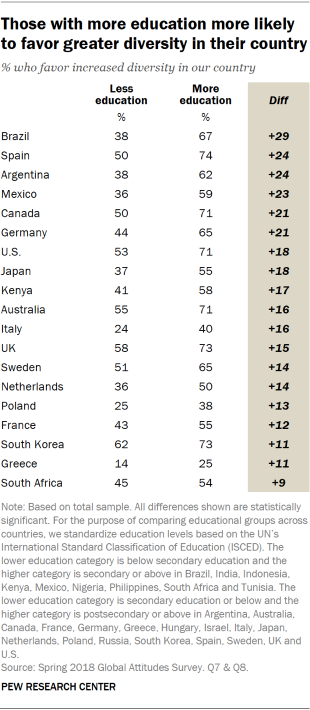
In 19 of the 27 countries surveyed, people with more education are more likely to be in favor of increasing diversity in their country. This educational gap can be seen in countries in nearly every region surveyed, including all but one of the European countries (no difference in Hungary) and particularly large gaps in the Latin American nations polled.
Two-thirds of Brazilians with more education are more favorable toward an increasingly heterogenous society, compared with only 38% of Brazilians with less education. Attitudes in Argentina and Mexico are comparable to those in Brazil.
Canada and the U.S. also exhibit a similar pattern. Roughly seven-in-ten of those with more education approve of greater cultural diversity, compared with about half in each country among those who have less education.
Large education differences are found even in countries with low overall support for diversity, such as Italy, Poland and Greece. For example, a quarter of Greeks with more education are in favor of this change in their culture, but only 14% of Greeks with less education agree.


