1 in 10 eligible voters in the U.S. are naturalized citizens (original) (raw)
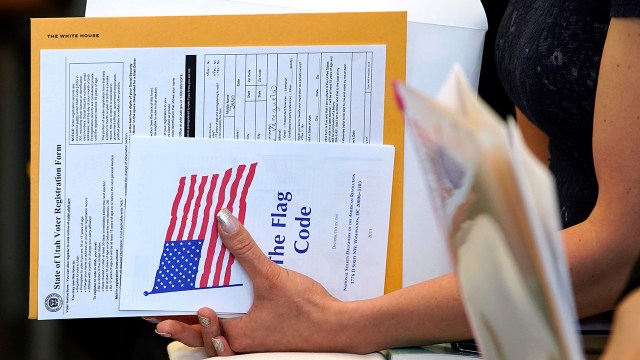
An applicant holds a voter registration form and other documents during a naturalization ceremony in Salt Lake City on April 10, 2019. (George Frey/Getty Images)
More immigrants than ever before call the United States home. Many of them have become U.S. citizens through naturalization, making them eligible to vote in November’s presidential election. In fact, naturalized citizens’ numbers are growing as the federal government processes citizenship applications at its fastest rate in years.
Here’s a closer look at the nearly 24 million immigrant adults who are naturalized citizens, according to a Center analysis of U.S. Census Bureau data.
Pew Research Center conducted this analysis ahead of the 2024 presidential election to determine how many naturalized citizens are eligible to vote and highlight other key facts about the immigrant eligible voter population, using the most current federal data.
“Eligible voters” refers to people ages 18 and older who are U.S. citizens. In this analysis, immigrant eligible voters are people ages 18 and older who were born outside the U.S. and have gained U.S. citizenship through naturalization.
All racial categories are single-race and non-Hispanic. Hispanics are of any race.
The analysis is based on Center tabulations of data from the U.S. Census Bureau’s American Community Survey and the 2000 decennial census provided by IPUMS from the University of Minnesota.
Throughout this analysis, we use the terms “eligible voters” and “electorate” to refer to U.S. citizens ages 18 and older.
Related: What the data says about immigrants in the U.S.
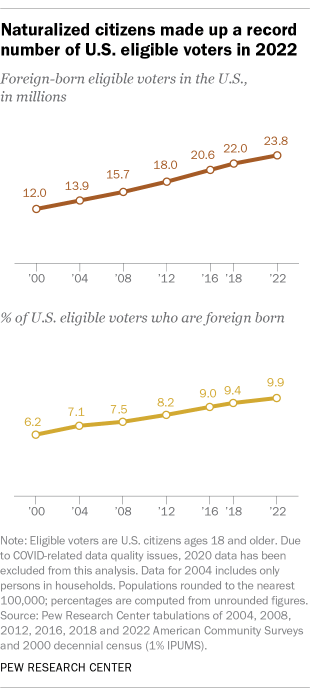
Naturalized citizens make up a record number of eligible voters, according to the 2022 American Community Survey. That year, 23.8 million naturalized citizens were eligible to vote, accounting for about 10% of the U.S. electorate.
The number of adults who are naturalized citizens has grown steadily in recent decades. Between 2012 and 2022 alone, their numbers grew by 32%, from 18.0 million to 23.8 million. During the same period, the number of U.S.-born adults increased by 8%, from 202 million to more than 217 million.
Most naturalized citizen eligible voters have lived in the U.S. for more than 20 years. About three-quarters of immigrant eligible voters (73%) have lived in the U.S. for more than two decades. Another 20% have lived in the country for 11 to 20 years, while relatively few (8%) have been in the U.S. for a decade or less.
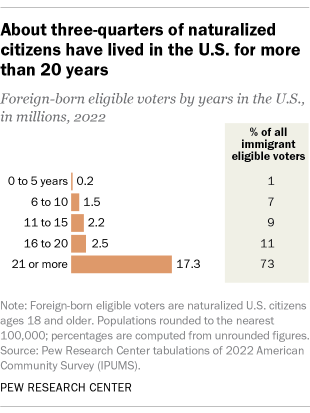
This pattern reflects the United States’ lengthy citizenship process. Generally, immigrants are required to be lawful permanent U.S. residents for at least five years before they are eligible to apply for citizenship. However, the median number of years before immigrants are eligible for naturalization varies by their country of birth.
Among naturalized citizen eligible voters, more than half (55%) live in just four states: California, Florida, New York and Texas. These four states are also the country’s most populous when looking at eligible voters overall. Combined, they’re home to roughly a third of the U.S. electorate (32%).
California has by far the most adult naturalized citizens of any state at 5.6 million, or 23% of the nation’s total.
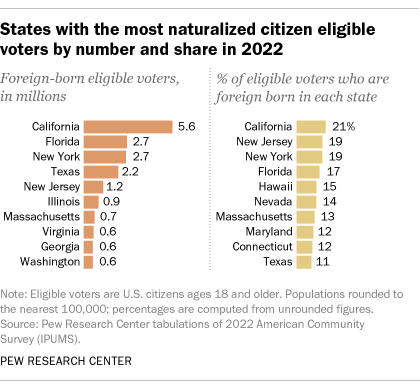
In 13 states and the District of Columbia, naturalized citizens make up an estimated 10% of all eligible voters or more. The states where naturalized citizens account for the largest percentage of the electorate are California (21%), New Jersey (19%), New York (19%) and Florida (17%).
In West Virginia and Mississippi, naturalized citizens make up some of the smallest shares of eligible voters overall – about 1% of the electorate in each state.
The naturalized citizen share of the electorate differs widely in some potential battleground states in the 2024 election. Arizona, Georgia, Michigan, Nevada, Pennsylvania and Wisconsin are widely considered to be among the swing states this fall. The share of eligible voters who are naturalized citizens differs considerably across these states.
In Nevada and Arizona, naturalized citizens make up 14% and 9% of all eligible voters, respectively. They account for 7% of eligible voters in Georgia, and about 5% in both Pennsylvania and Michigan. In Wisconsin, they are just 3% of the electorate.
In overall numbers, Georgia’s naturalized citizen electorate is the largest among these swing states at 574,000, while Pennsylvania is not far behind at 546,000. Both of these states were among the closest in the 2020 presidential election.
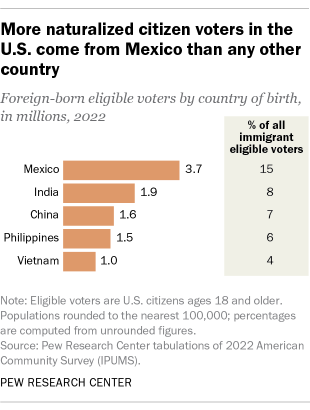
The top countries of origin for adult naturalized citizens in the U.S. are Mexico, India, China, the Philippines and Vietnam. About 3.7 million immigrants who are eligible to vote in the U.S. (15%) hail from Mexico – the largest group from any one country. India (8%), China (7%), the Philippines (6%) and Vietnam (4%) round out the top five countries of origin.
The origin countries of immigrant eligible voters is somewhat in line with U.S. immigration patterns observed over the last six decades or so. Of all immigrants who’ve come to the U.S. since 1965, about a quarter arrived from Mexico. About another quarter came to the U.S. from Asia, with the largest numbers arriving from China, India and the Philippines.
Most immigrants who are eligible to vote are Hispanic or Asian American. These two racial and ethnic groups have grown in number in recent years.
- Hispanic adults make up the largest share (34%) of immigrant eligible voters as of 2022. About 8.1 million adult naturalized citizens are Hispanic, an increase from 7.5 million in 2018.
- About three-in-ten immigrant eligible voters (31%) are Asian as of 2022. Nationwide, they account for about 7.5 million adult naturalized citizens, up about half a million people from four years earlier.
- The number and share of White immigrant eligible voters have held relatively steady between 2018 and 2022 at about 4.9 million, or 21% of the total.
- The nation’s 2.5 million Black adult naturalized citizens account for 11% of the immigrant electorate as of 2022 – a similar share to 2018.
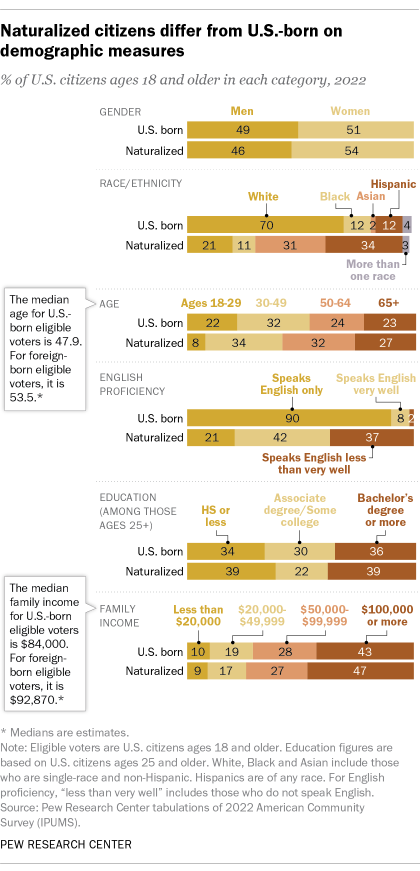
The naturalized citizen electorate differs from the U.S.-born electorate on a variety of demographic measures. Immigrant eligible voters skew older than their U.S.-born counterparts. They’re also somewhat more likely to have a bachelor’s degree, live in households with slightly higher incomes and have lower levels of English proficiency.
- Age: About six-in-ten immigrant eligible voters (58%) are ages 50 and older, compared with 46% of U.S.-born voters. And just 8% of immigrant eligible voters are under 30, compared with 22% of the U.S.-born electorate.
- Education: 39% of naturalized citizen eligible voters have a bachelor’s degree or more education, compared with 36% of the U.S.-born electorate. Naturalized citizens are also less likely than their U.S.-born counterparts to have completed some college or have an associate’s degree. This is the highest level of education for 22% of naturalized citizens, compared with 30% of those who are U.S.-born.
- Family income: The median total family income among naturalized citizen eligible voters is 92,870,comparedwith92,870, compared with 92,870,comparedwith84,000 among U.S.-born eligible voters.
- English proficiency: 37% of immigrant eligible voters say they speak English less than very well, far higher than the 2% of U.S.-born eligible voters who say the same.