What the data says about federal workers (original) (raw)
President-elect Donald Trump has focused much attention on shrinking the size and scope of the federal government for his second administration.
Most notably, Trump has appointed tech mogul Elon Musk and GOP-primary-rival-turned-ally Vivek Ramaswamy to lead an advisory task force dubbed the “Department of Government Efficiency.” Musk and Ramaswamy have said they aim to cut trillions of dollars from the federal budget, abolish or consolidate hundreds of federal agencies, and slash the federal payroll by as much as 75%.
As Trump returns to the White House, here are answers to some common questions about the federal workforce, based on data from the Office of Personnel Management (OPM) – the federal government’s human resources department – and the Bureau of Labor Statistics (BLS). Unless otherwise stated, all figures in this analysis are as of March 2024.
Pew Research Center conducted this analysis to answer common questions about the federal workforce – particularly in light of pledges by the incoming Trump administration to shrink or remake it.
Our primary source was the Office of Personnel Management’s FedScope data portal, which provides access to data on nearly all executive-branch civilian employees. The main exceptions are the U.S. Postal Service, congressional staffers, employees of the CIA and other intelligence agencies, and presidential appointees who require Senate confirmation.
In most cases, FedScope masks datapoints smaller than 12 to protect personal privacy. Also, for security reasons, FedScope masks work-location information for employees of the FBI, Secret Service, Drug Enforcement Administration, the Bureau of Alcohol, Tobacco, Firearms and Explosives, and the U.S. Mint. Employees of those agencies who work in the Washington, D.C., metropolitan area (which includes parts of Maryland and Virginia) are all reported as working in the District of Columbia, meaning the D.C. totals are artificially inflated. Location information for employees of those agencies who work elsewhere is suppressed.
We used civilian-employment data from the Bureau of Labor Statistics to compare the federal workforce with the national workforce as a whole. We also relied on a Congressional Research Service report on the federal civil service for information about personnel rules for different classifications of federal workers.
The public opinion data cited in this analysis comes from recent Pew Research Center surveys. Additional information about the methodology of these surveys, including their sample sizes and field dates, can be found by following the links in the text.
- How many federal workers are there?
- How has the number of federal workers changed over time?
- Which federal departments and agencies employ the most people?
- Are most federal workers in the Washington, D.C., area?
- How do federal workers compare demographically with American workers as a whole?
- What kinds of work do federal employees do?
- How much do federal workers earn?
- What does job tenure look like among federal workers?
- Do all federal workers have civil service protections?
- How do Americans feel about federal workers?
How many federal workers are there?
That depends on who you’re counting.
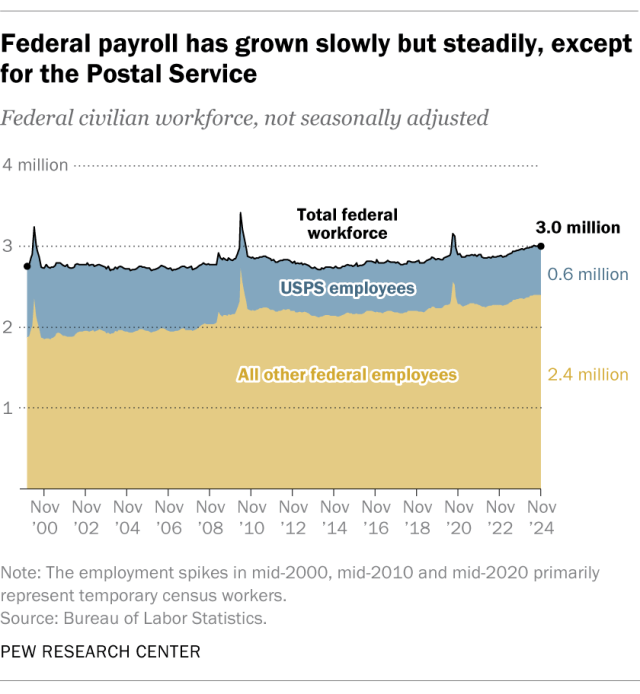
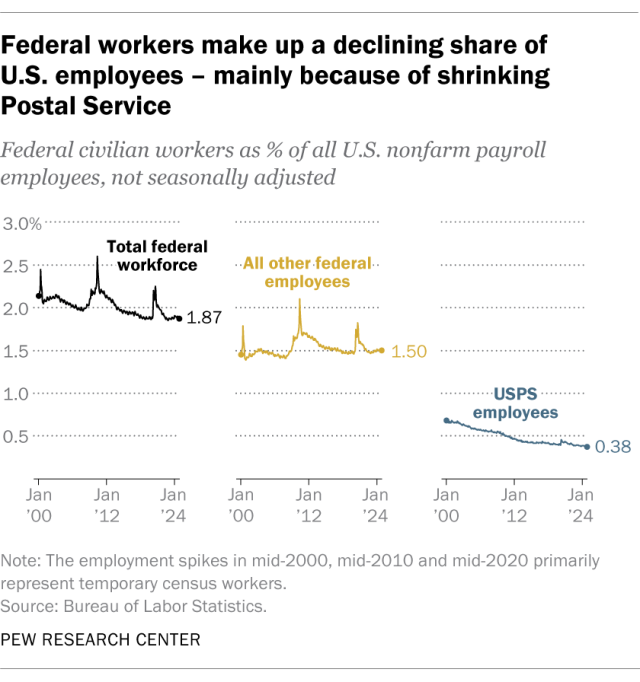
In November 2024, the federal government employed just over 3 million people, or 1.87% of the entire civilian workforce, according to BLS data. That figure doesn’t count the roughly 1.3 million active-duty military personnel, who aren’t typically considered “employees.” It does include the more than 600,000 people who work for the U.S. Postal Service, an independent federal agency with semiautonomous status that operates somewhat like a private business.
Set aside the Postal Service and you have a bit more than 2.4 million federal workers. That makes the federal government the nation’s single largest employer, with even more workers than Walmart, Amazon or McDonald’s. In fact, the Postal Service by itself would, if it were a private business, rank among the 10 largest private-sector employers, ahead of industry rivals UPS and FedEx.
Detailed information on most executive-branch workers – 2,278,730 as of March 2024 – is available through OPM’s FedScope data portal. The rest of this analysis draws mostly from that database. FedScope doesn’t include postal workers, congressional staffers, employees of the government’s various intelligence agencies or presidential appointees who require Senate confirmation.
How has the number of federal workers changed over time?
In absolute terms, it has risen fairly steadily for decades. In November 2000, federal employment – excluding the Postal Service – stood at 1,855,900 people, according to BLS data. That number has grown by a little over 1% each year since then, to 2,405,100 people in March 2024.
While the number of federal workers has grown over time, their share of the civilian workforce has generally held steady in recent years. The federal government (again excluding the Postal Service) accounts for 1.5% of total civilian employment, a share that – except for a temporary bump in mid-2020 for the decennial census – has been largely constant for more than a decade.
The Postal Service’s workforce, on the other hand, has fallen by a third since peaking at a seasonally adjusted 909,000 in April 1999. Despite the agency’s announced intentions to reduce headcount, Postal Service employment has hovered around 600,000 for more than a decade. (We used seasonally adjusted figures for this calculation because Postal Service payroll tends to bump up every December during the busy holiday season.)
Related: The state of the U.S. Postal Service in 8 charts
Which federal departments and agencies employ the most people?
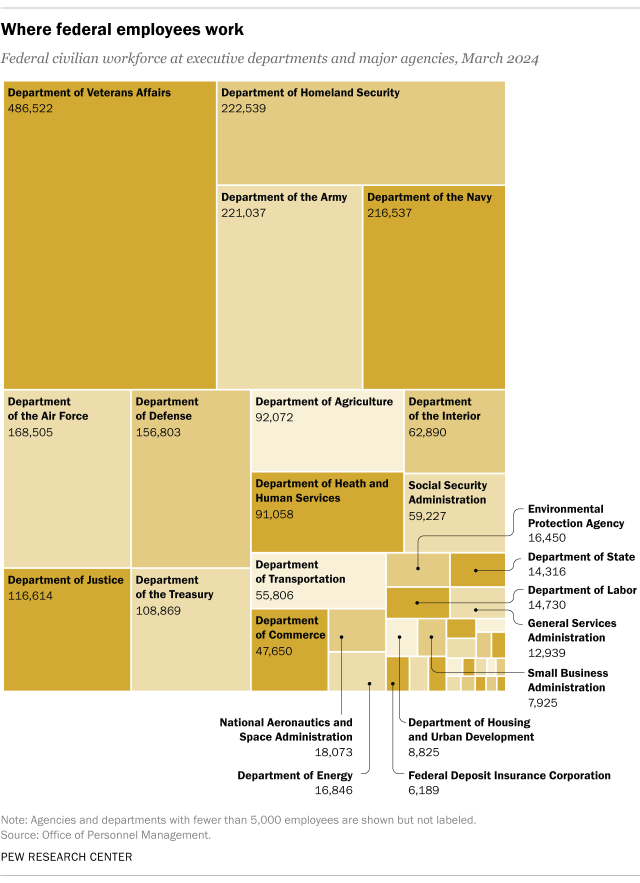
The Department of Veterans Affairs employs more than 486,000 people, giving it by far the largest payroll of the 18 Cabinet-level departments (noting that OPM counts the Army, Navy and Air Force departments separately). Most of these employees work for the Veterans Health Administration, which operates the VA’s extensive network of hospitals, clinics and nursing homes.
The smallest Cabinet-level department, with 4,245 workers, is the Department of Education. Trump, like many previous Republican presidents, has proposed abolishing the department entirely.
Among independent agencies, the largest employer is the Social Security Administration, with more than 59,000 workers. That’s more than the combined total of five Cabinet-level departments: Education, Energy, Labor, State, and Housing and Urban Development.
Are most federal workers in the Washington, D.C., area?
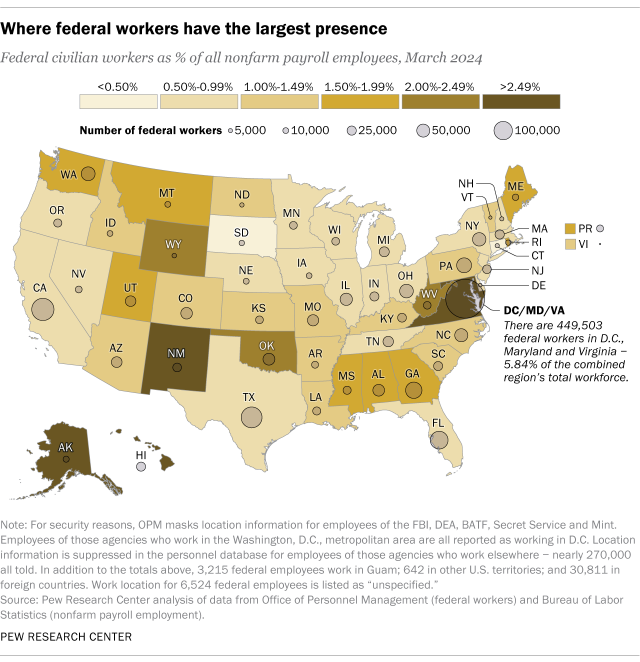
Not by a long shot. Fewer than a fifth of the workers in OPM’s database – about 449,500 – work in the District of Columbia or the adjoining states of Maryland and Virginia. Outside that region, California and Texas have the largest contingents of federal employees, with about 147,500 and 130,000, respectively. About 30,800 federal employees work overseas.
How do federal workers compare demographically with American workers as a whole?
The federal workforce is slightly more male: 53.8%, versus 52.8% for all civilian workers. It also skews somewhat older: 28.1% of federal workers are ages 55 and older, compared with 23.6% of the overall workforce. Fewer than 9% of federal employees are younger than 30, compared with 22.7% of all workers.
Racially and ethnically, the federal workforce largely mirrors the overall civilian workforce, with two notable exceptions: A bigger share of federal workers are Black (18.6% vs. 12.8%), and a smaller share are Hispanic or Latino (10.5% vs. 19.5%).
As a whole, federal workers are more educated than the overall civilian workforce. Nearly a third of federal workers (31.5%) have a bachelor’s degree, compared with 27.7% of all employed Americans. And almost 22% of federal workers have an advanced degree, versus 17.6% of all workers.
The most highly educated federal agency, among those with at least 1,000 employees, isn’t NASA or the National Science Foundation, but the U.S. Agency for International Development. Two-thirds of its 4,675 workers hold a master’s degree, doctorate or other advanced degree.
What kinds of work do federal employees do?
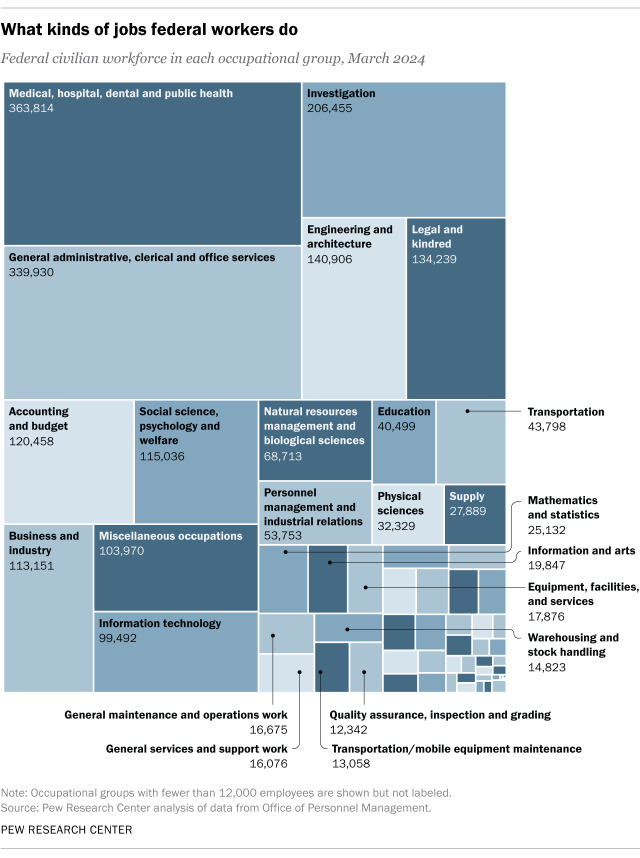
Almost all federal employees (92%) are considered “white collar” workers – that is, in professional, administrative, technical, clerical or similar jobs. But the range of specific federal occupations runs literally from A (740 able seamen) to Z (43 zoologists).
Nearly 364,000 federal employees, or 16% of the federal workforce, are in health-related fields – the single largest occupational category. By contrast, only 134,239 federal workers, or 5.9%, are classified as lawyers or in law-related jobs.
Out of more than 660 specific occupations that OPM lists, the most common are nursing and “miscellaneous administration and program work,” both with more than 111,000 workers; and information technology management, with about 99,000 workers. The federal government also employs some 14,000 custodial workers, about 2,500 welders, 580 cartographers and 21 bakers.
How much do federal workers earn?
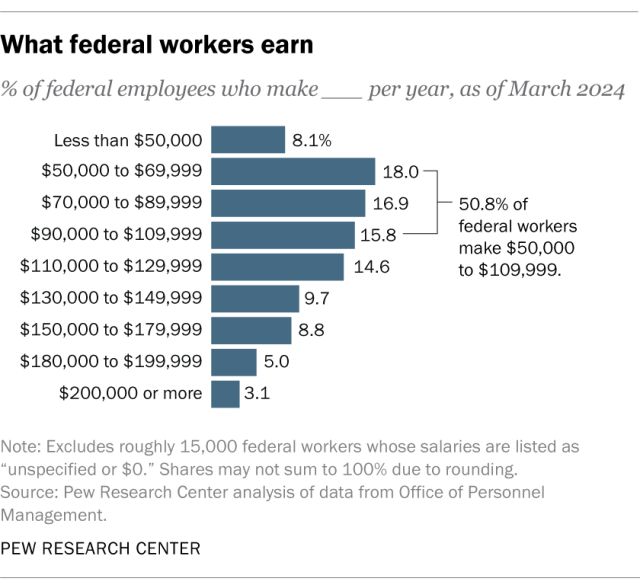
The average annual pay across the entire federal workforce is 106,382,accordingtoOPM,reflectingtheskewtowardwhite−collarjobsheldbyhighlyeducatedpeople.Halfofallfederalworkersmakebetween106,382, according to OPM, reflecting the skew toward white-collar jobs held by highly educated people. Half of all federal workers make between 106,382,accordingtoOPM,reflectingtheskewtowardwhite−collarjobsheldbyhighlyeducatedpeople.Halfofallfederalworkersmakebetween50,000 and 109,999ayear.Relativelyfew(3109,999 a year. Relatively few (3%) make 109,999ayear.Relativelyfew(3200,000 or more, while 8% make less than $50,000.
Pay varies considerably based on what federal workers do and in which office or agency they work. Consider, for example, the agencies with the highest and lowest average salaries:
- The Commodity Futures Trading Commission, which regulates futures contracts, swaps and other derivatives markets, employs 736 people who make an average of $235,910 a year. Nearly all of the CFTC’s workers are in professional or administrative jobs, including 273 attorneys, 122 in “general business and industry,” 68 information technology management workers, 43 auditors and 32 economists.
- The Armed Forces Retirement Home, which despite its singular name operates two retirement centers for veterans, employs 306 people who make an average of $75,151 a year. Most of its workers are in health care, including 153 nurses, practical nurses and nursing assistants.
What does job tenure look like among federal workers?
More than half of federal workers (1.18 million, or 51.8%) have worked for the government (in any civilian capacity) for less than 10 years, according to our analysis of the OPM data. The average tenure across the entire workforce is 11.8 years, but this too varies considerably from agency to agency.
- The highest average length of service, among agencies with at least 100 employees, is at the United States Holocaust Memorial Museum in Washington, D.C. The museum, which opened in 1993, has 117 employees with an average tenure of 21.8 years.
- AmeriCorps, the domestic volunteerism agency formally known as the Corporation for National and Community Service, has the shortest average length of service among major agencies. Its 785 workers have an average tenure of 7.5 years.
For comparison, the median job tenure for all U.S. wage and salary workers is 3.9 years, according to BLS data.
Do all federal workers have civil service protections?
Most, but not all, have these protections, which shield workers against being disciplined or fired except for just cause. Civil service protections also create specific procedures that agency employers must follow before firing or disciplining employees.
About two-thirds of federal workers (1.5 million, or 67.3%) are in what’s called the “competitive service,” meaning that job applicants compete for positions and are evaluated based on objective criteria, such as written exams. Once they pass a probationary period, employees in the competitive service can’t be fired, suspended, demoted or subjected to other “adverse actions” without cause. They also have the right to written notice of such adverse actions and can respond to or appeal them.
Around 8,700 federal workers (0.4%) are in a special classification called the “Senior Executive Service,” or SES. These high-level employees manage major programs and projects, and they often serve as intermediaries between presidential appointees and career civil servants.
- About 90% of SES employees come from the ranks of the career federal workforce. In general, they can only be fired for misconduct, neglect of duty, malfeasance, or refusal to accept a transfer or reassignment. They can, however, be removed from the SES for unsatisfactory job performance.
- About 10% of SES employees (around 850) are non-career federal workers or have been hired for a limited time. They can, in most cases, be fired or removed from the SES at the discretion of the head of their agency.
All other workers – roughly 735,000, or 32.2% – are considered “excepted service” employees, meaning their jobs have been exempted from the regular hiring rules. That’s often because their positions require specific skills and it’s considered impractical to examine applicants. Lawyers, teachers and chaplains, for example, often fall into this category.
Also part of the excepted service are employees in jobs of a “confidential or policy-determining character.” Most political appointees to positions that don’t require Senate confirmation are in this category.
Generally speaking, excepted service employees – except for the political appointees referred to above – have the same notice and appeal rights as workers in the competitive service. However, in most cases, those rights don’t become effective until after the worker has been on the job for at least two years, which in practice makes them easier to discipline or fire.
Late in Trump’s first term, he issued an executive order that would have allowed agencies to move certain career employees – those whose jobs were determined to be of a “confidential, policy-determining, policy-making or policy-advocating character” – into a new category of the excepted service. That would have made them easier to hire, discipline or fire, outside the usual civil-service rules. Estimates were that tens of thousands of career employees could have been reclassified under the plan.
President Joe Biden revoked Trump’s order upon taking office, and earlier this year his administration adopted a new rule aimed at protecting career employees from being moved involuntarily to a classification with fewer job protections. However, Trump has said he will reissue the order in his second term.
How do Americans feel about federal workers?
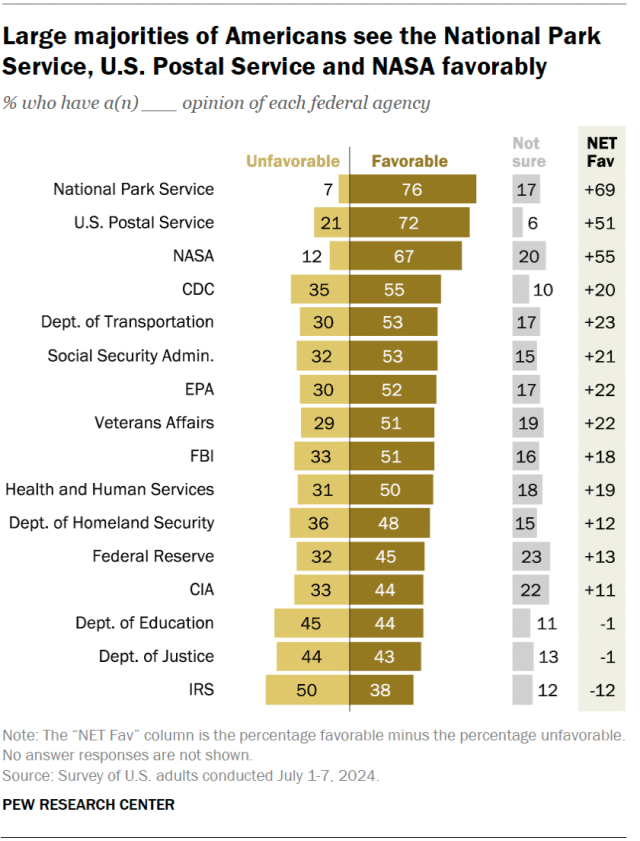
Pew Research Center has regularly asked Americans about their views on the size and scope of government, their opinions of specific federal departments and agencies, and even whether they have more confidence in career employees or political appointees. Their responses indicate that Americans have, at best, mixed feelings about federal employees and the agencies they work for.
- Americans are evenly divided on government’s size and scope: 49% say they’d prefer a smaller government that provides fewer services, while 48% say they’d prefer a larger government that provides more services, according to a survey conducted in April 2024.
- A majority (56%) say government is “almost always wasteful and inefficient,” while 46% say it often does a better job than people give it credit for.
- But 53% also say the government should do more to solve problems, while 46% say the government is doing too many things better left to businesses and individuals.
- Strong majorities express positive views of many federal agencies, including the National Park Service (76% favorable), the Postal Service (72%) and NASA (67%). Sentiment is more mixed toward other agencies, such as the CIA (44% favorable vs. 33% unfavorable) and the Education Department (44% vs. 45%). And sentiment is decidedly negative toward the IRS (38% vs. 50%).
- In a 2022 survey, more people expressed a great deal or a fair amount of confidence in career government employees (52%) than in officials appointed by the president (39%). However, both those figures were down from 2018 (61% and 42%, respectively).
