Warwickshire population stats in maps and graphs. (original) (raw)
Warwickshire population statistics
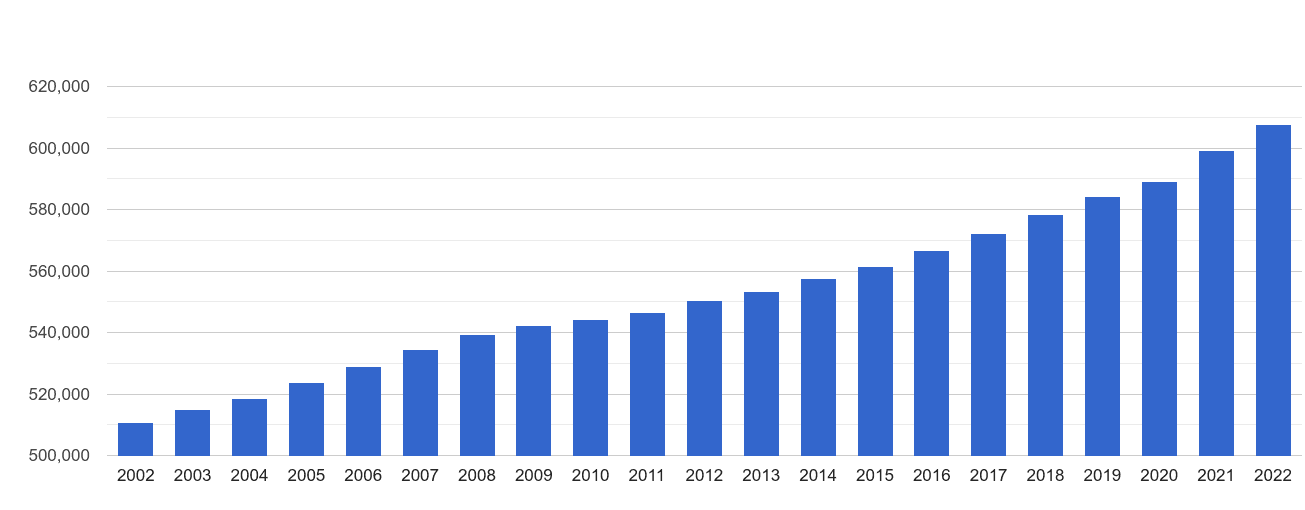
In 2022, there were 608k residents in Warwickshire county with an average age of 42.1 years. Population density was 307 residents per square kilometer. Population grew by 19.0% since 2002 and population average age increased by 2.4 years in the same period.
608k
total residents
estimates 2022
42.1
average age
estimates 2022
307
population density
estimates 2022
2.36
residents per household
Census 2011
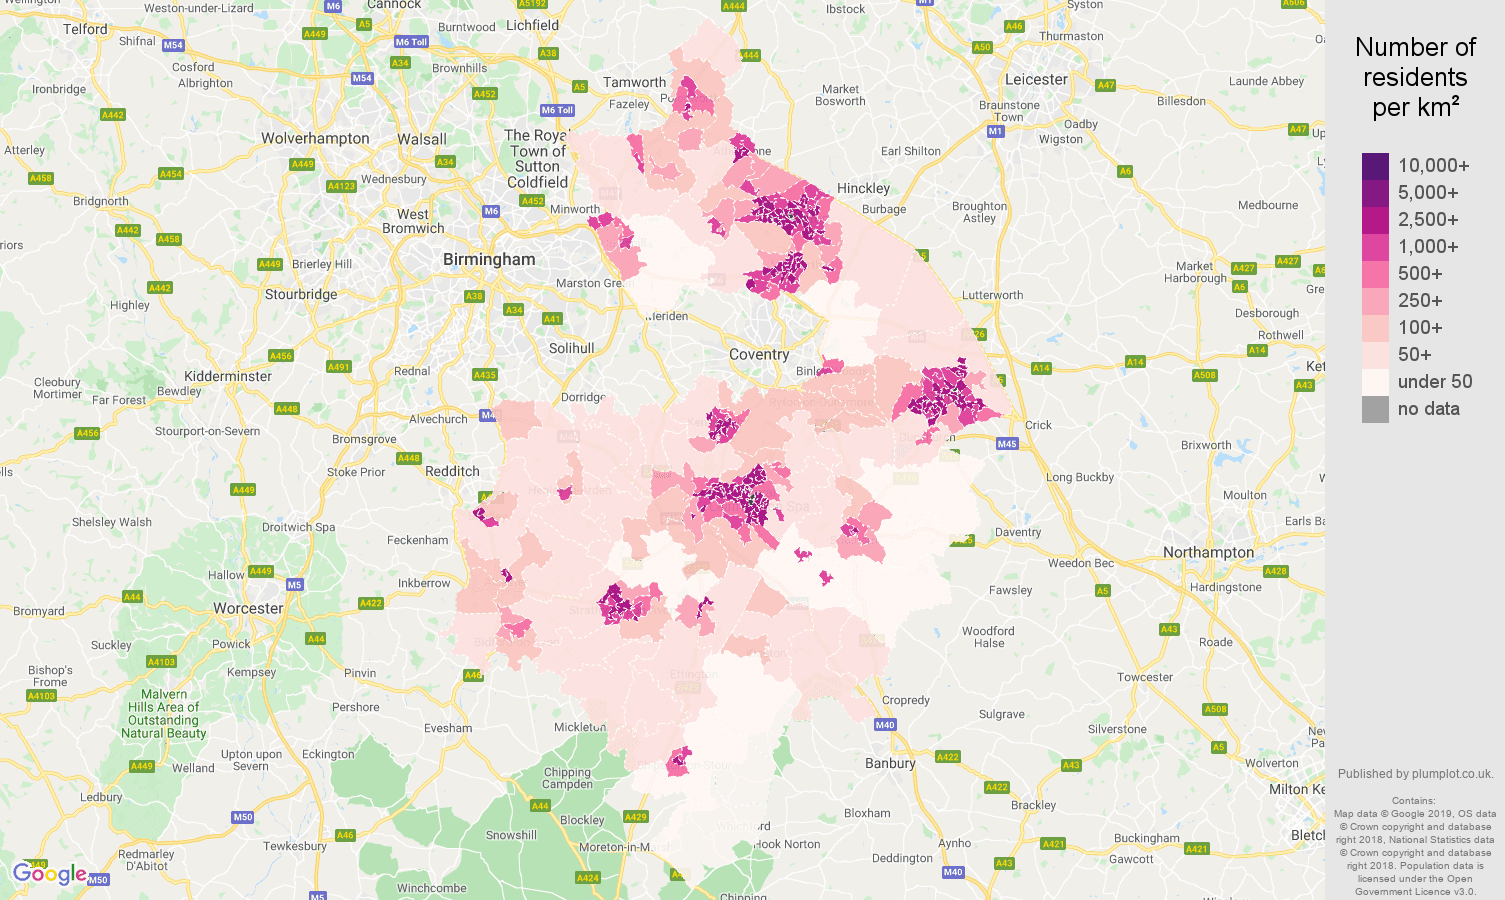
Warwickshire population density map
shows a number of residents per square kilometer(km2), estimates from 2020.
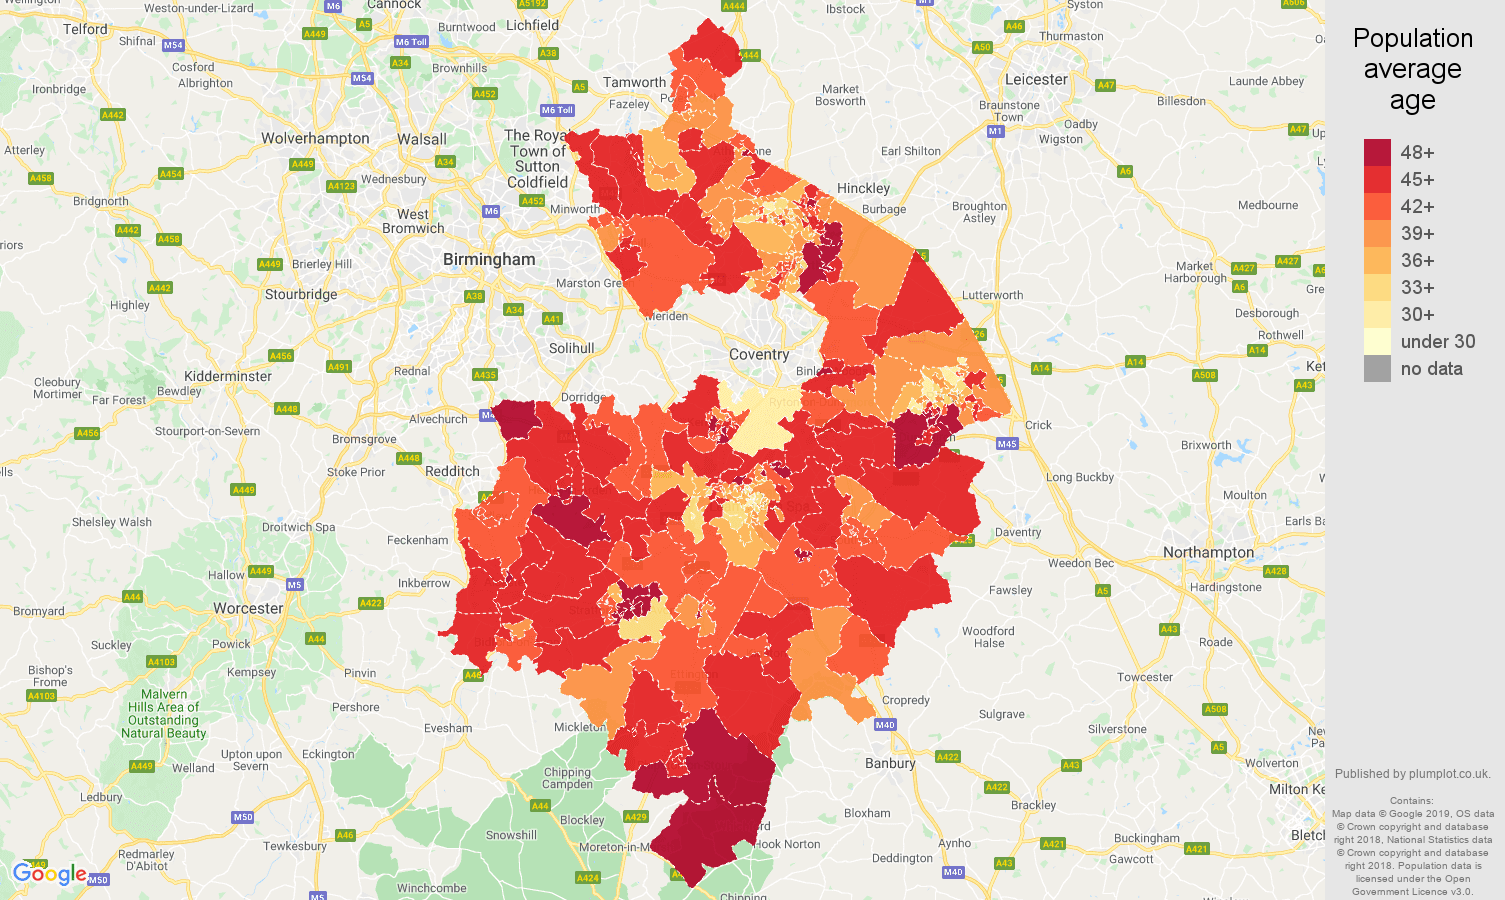
Warwickshire population average age map
Population average age by LSOA (County) in 2018.
Total population per year outlines headcount differences.
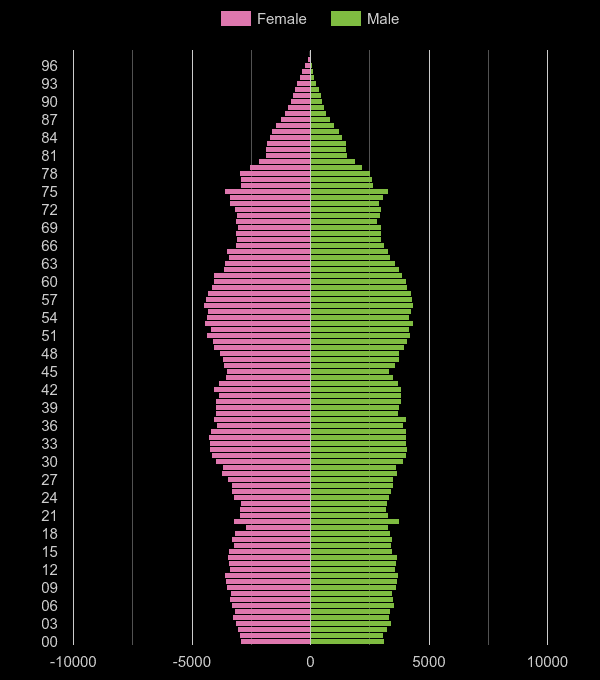
Warwickshire population pyramid
shows the distribution of various age groups in a population in 2022. Females are shown on the left, males are shown on the right.
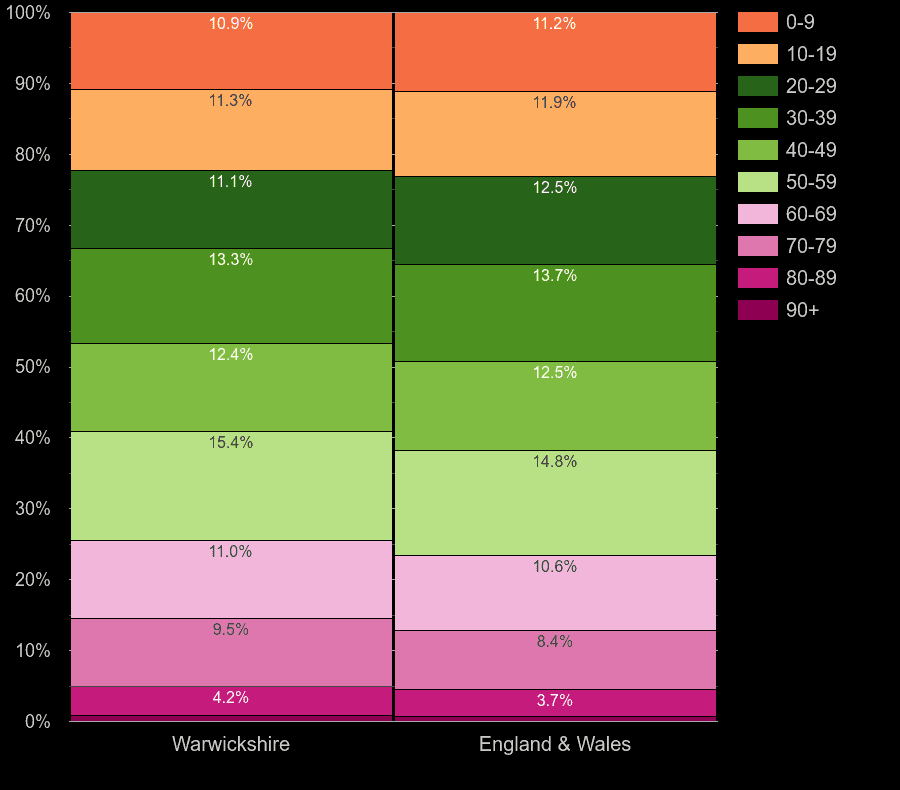
Warwickshire population share by decade of age
Shares of population age groups compared to corresponding shares of population groups in England & Wales, 2022.
Warwickshire working age population share
Working age population share compared to working age population share in England & Wales, 2022.
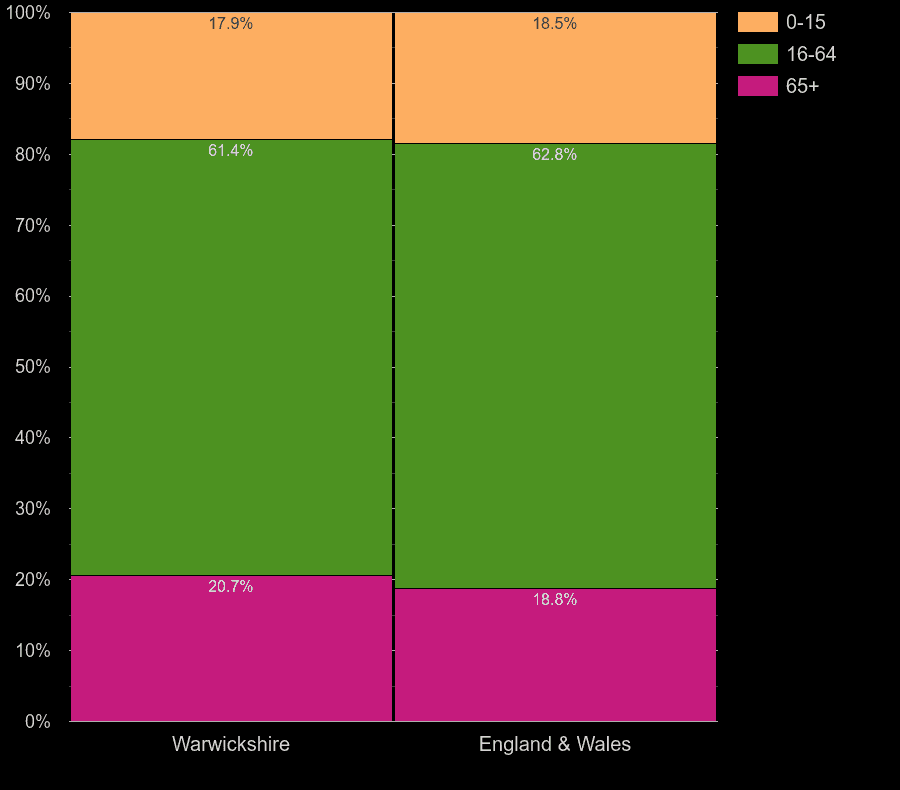
| age group | head-count | % share of population | % for Eng & Wales |
|---|---|---|---|
| 0-15 | 109k | 17.9% | 18.5% |
| 16-64 | 373k | 61.4% | 62.8% |
| 65+ | 126k | 20.7% | 18.8% |
Warwickshire average age rank
Comparison of counties average ages, 2022 population estimates.
42.1
Warwickshire
average age
40.8
England & Wales
average age
![]()
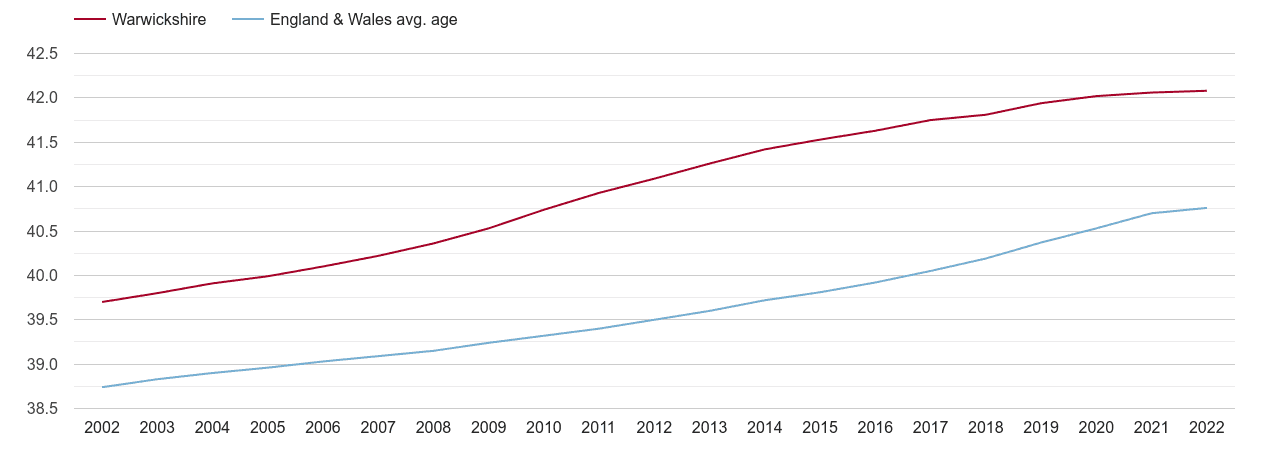
Warwickshire population average age
Annual area statistics of Warwickshire's population average age compared to country statistics.
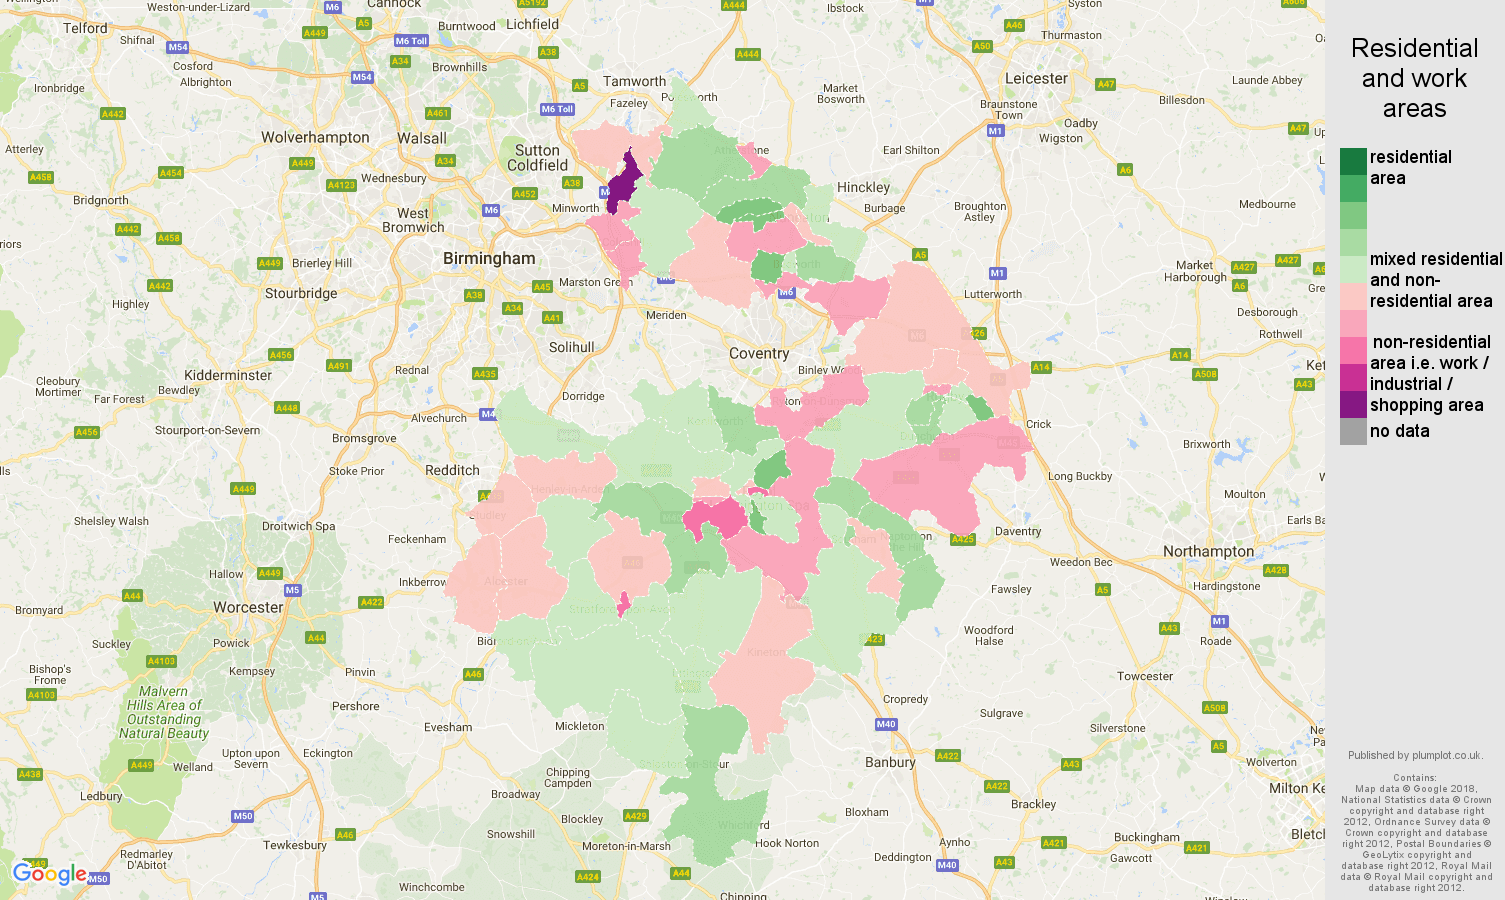
Warwickshire residential areas map
Purple-colored areas are business or industrial areas. Green-colored areas provide quieter surroundings and better living. Map is based on a UK Census 2011 data. Colors calculated from the ratio of number of residents divided by a number of workday people.
Plumplot area insights - interactive charts and maps