Cell Phone Usage Stats 2026: Americans Check Their Phones 186 Times a Day (original) (raw)
- On this page:
- Cell Phone Usage and Habits
- Changes
- Best cell phone plans
Americans check their phones 186 times a day
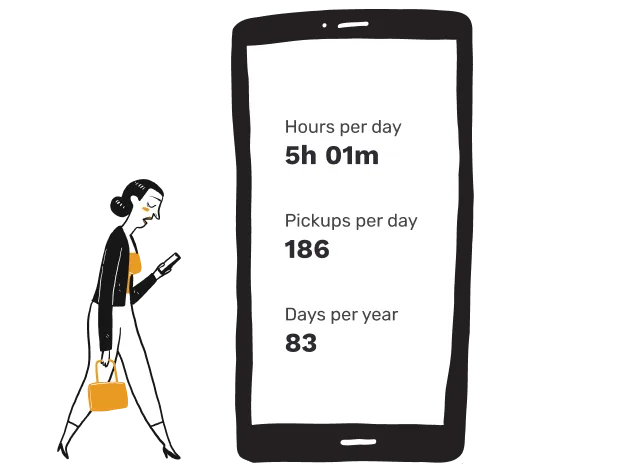
How often do people check their phones every day? Though the average has dropped below last year’s numbers, Americans still check their phones nearly 200 times a day—or about once every five minutes while they’re awake.
But, in an almost 3% rise from last year, nearly 46% of Americans consider themselves “addicted” to their phones in 2026. It’s worth noting that this stat came after a considerable decrease from prior years, possibly due to shaking off pandemic-era habits. Still, it shouldn’t be too surprising to hear that 53% say they have never gone more than 24 hours without their phone.
Our relationship with our phones continues a mix between necessary work and utility, entertainment and distraction, and the tension between social connection and isolation.
Some experts warn that using phones too much can lead to or exacerbate mental and physical health problems, especially in adolescents, while others say the biggest problem with phones is opportunity cost: spending time on our phones means less time spent doing other things.
So how are Americans using their phones, and how does it affect their everyday lives?
American cell phone usage and habits
Americans' Cell Phone Usage and Habits
Americans check their phones 186 times per day (11.6 times per hour)
72.2% use their phone at work
87.4% use their phone while watching TV
56.4% use their phone while eating dinner
67.9% use their phone on the toilet
60.7% have texted someone in the same room
49.6% sleep with their phone at night
41.3% feel panic/anxiety at <20% battery
84.6% check their phone within 10 minutes of waking
76.3% feel uneasy leaving their phone at home
45.8% consider themselves “addicted” to their phone
53.1% have never gone longer than 24 hours without their phone
40.1% use their phone on a date
29.3% use their phone while driving
82.7% are on an unlimited mobile plan
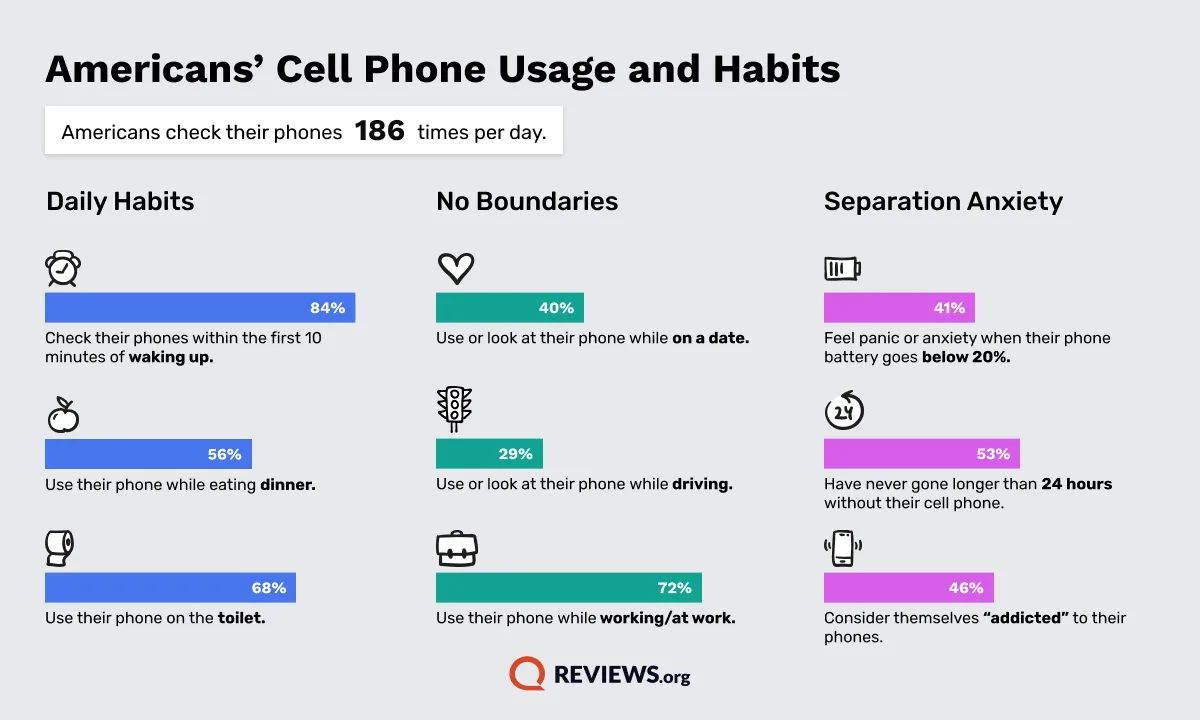
Most of us have a few common (but less-than-ideal) phone habits: using phones while we watch TV (87%), checking our phones within ten minutes of waking up (85%), and using the phone at work (72%). Over two-thirds of Americans use their phone on the toilet, over half (56%) use their phone while eating dinner, and 60% have texted someone in the same room. And nearly half of Americans go to sleep with their phones at night (which negatively affects sleep quality).
![]()
Is it a form of respect to show memes and YouTube videos to your date? Well, around 40% of people use their phone on dates regardless. And dangerously enough, nearly 30% admit to using their phones while driving.
Though 83% of Americans say they are on an unlimited mobile plan, over a quarter of people (27%) said they use up all their high-speed data each month. Note, if you struggle with this, check out our recommendations on how to reduce data usage, or if you feel like you might be overpaying for data, see how much data you actually need.
With so much usage, it makes sense that 76% of us feel uneasy leaving our phone at home, and 53% of respondents said they’ve never gone longer than 24 hours without their phone—and why 46% of Americans consider themselves addicted to their phones.
How cell phone habits changed over 2025
Compared to our last report, Americans check their phones less every day, but they report a higher rate of addiction. This manifests in various ways: they’re more likely to text someone in the same room, check their phones within 10 minutes of waking, and feel panic at seeing their battery is under 20% charged.
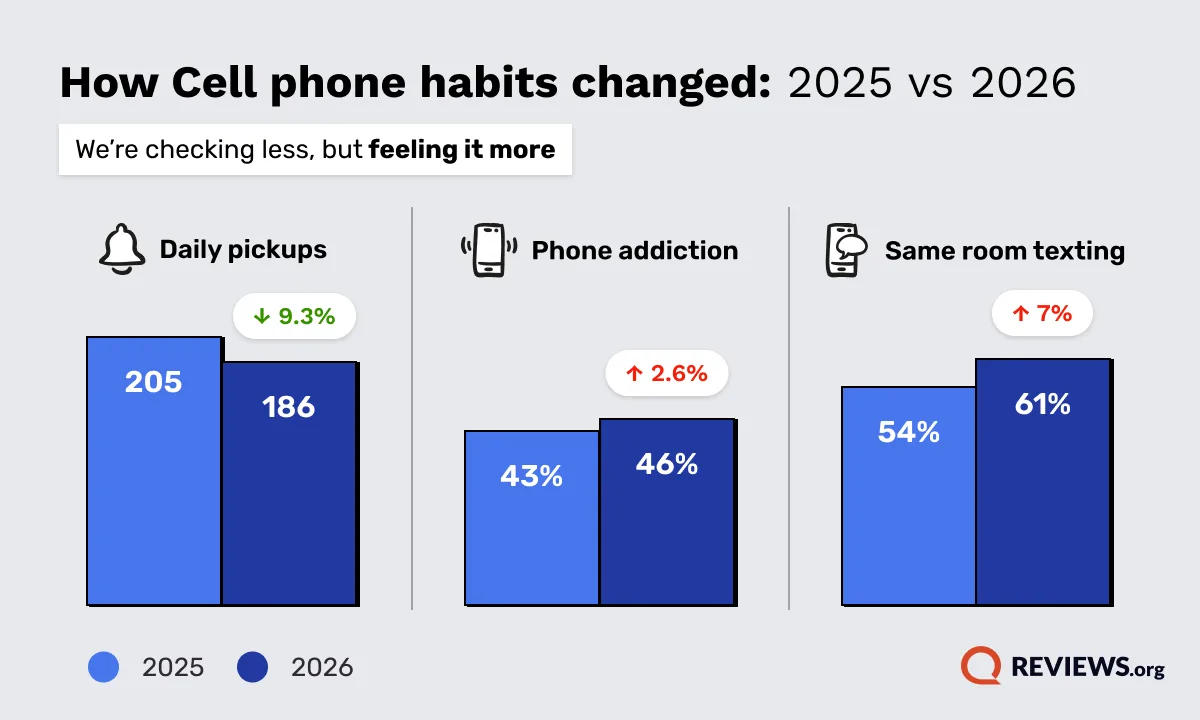
Despite slightly higher rates of self-reported addiction, Americans show less immediacy at checking notifications, dropping from 76% of people checking their phone within 5 minutes to just 71%.
This points to a few possibilities: do we find our notifications to be less urgent or necessary? Are we waiting to see if we can tackle a few notifications around the same time? Or have we tailored our notifications to the point where we know what to expect somewhat regularly (and can AI advancements help us in reducing extra screen time)? We can’t say from this data alone.
Year-over-year changes
| Question | 2026 | 2025 | Difference between 2026 and 2025 |
|---|---|---|---|
| How often we check our phones per day (# of times) | 186 | 205 | -19 |
| % of Americans who feel uneasy leaving their phone at home | 76.30% | 78.20% | -1.90% |
| % of Americans that check their phones within the first 10 minutes of waking up | 84.60% | 80.60% | 4.00% |
| % say they have never gone longer than 24 hours without their cell phone | 45.90% | 48.30% | -2.40% |
| % consider themselves addicted to their phones | 45.80% | 43.20% | 2.60% |
| % use or look at their phone while driving | 29.40% | 27.00% | 2.40% |
| % that check their phones within 5 minutes of receiving a notification | 71.00% | 76.00% | -5.00% |
| % that use their phone on the toilet | 67.90% | 65.70% | 2.20% |
| % that have texted someone in the same room as them before | 60.70% | 53.70% | 7.00% |
| % that says they feel a sense of panic or anxiety when their cell phone battery goes below 20% | 44.10% | 39.60% | 4.50% |
| % that sleep with their phone at night | 49.50% | 51.30% | -1.80% |
| % that use or look at their phone on a date | 40.10% | 38.10% | 2.00% |
And it’s not just a “young-person” problem, either: even Baby Boomers and Gen Xers get considerable amounts of screen time on their phones. To get a clearer understanding of how much screen time we’re getting, and how your experience might differ depending on your age, let’s look at generational differences.
Best cell phone plans
Compare top cell phone plans by provider
Data effective as of post date. Offers and availability vary by location and are subject to change.
Pro Tip: Whether you’re upgrading your phone or looking for a better deal, consider bundling your services for savings. Explore our top picks for internet and mobile bundles.
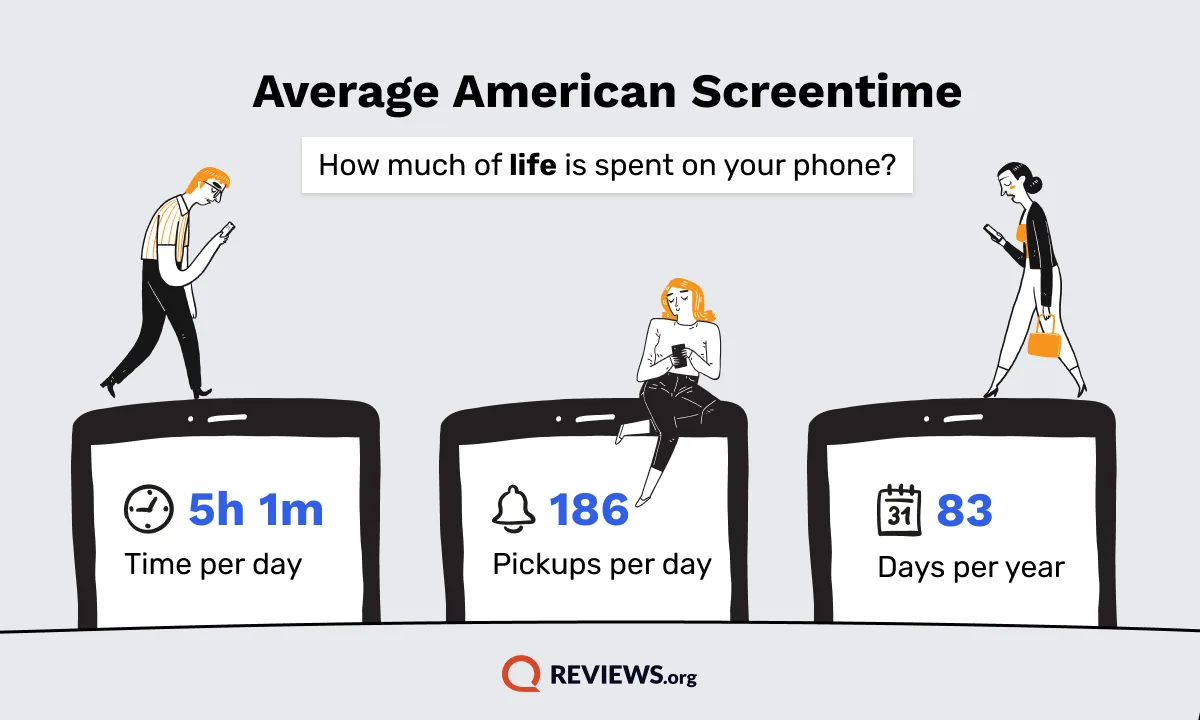
Americans spend at least 3 hours on their phone. Here’s the breakdown by generation.
In our recent analysis of internet screen time statistics, we found the average American spends 3 hours and 14 minutes on their phones alone—and they get far more screen time when considering other devices like tablets or desktop and laptop computers.
Which generation spends the most time on screens?
Gen Z leads in screen time for both smartphones and desktops (though millennials spend the same time on the computer, and aren’t far behind at all when it comes to smartphone use).
Screen Time By Generation
| Generation | Smartphone | Desktop | Laptop | Tablet | Connected TV |
|---|---|---|---|---|---|
| Baby Boomers | 2h 8m | 1h 18m | 1h 44m | 0h 46m | 3h 33m |
| Generation X | 3h 5m | 1h 38m | 2h 10m | 0h 51m | 3h 12m |
| Millennials | 3h 57m | 2h 4m | 2h 24m | 1h 1m | 3h 4m |
| Generation Z | 4h 6m | 2h 4m | 2h 33m | 1h 34m | 2h 55m |
Gen X stands firmly in third for phone time, logging nearly an hour less than Millennials and an hour more than Boomers. Overall, boomers spend the least amount of time on both smartphones and desktop computers.
| Generation | Smartphone (Daily) | Desktop computer (Daily) |
|---|---|---|
| Gen Z | 4h 6m | 2h 4m |
| Millennials | 3h 57m | 2h 4m |
| Gen X | 3h 5m | 1h 38m |
| Boomers | 2h 8m | 1h 18m |
Since most of us split our time online between both phone and internet, it’s worth looking at computer time usage as well. The differences in desktop use aren’t nearly as drastic, with most Americans averaging between 1-2 hours with the younger generations at the high-end, Gen X in the middle, and Boomers at the low end.
Daily phone pick ups by generation
On average, the American population averages 12 hourly phone pickups and 186 daily pickups.
Despite Gen Z spending more time on their phones (double that of the Boomers), the youngest adult generation has far fewer average phone pickups per hour and day—implying that when they are on their phone, they stay on for much longer.
| Generation | Average Hourly Pickups | Average Daily Pickups |
|---|---|---|
| Gen Z | 7 | 112 |
| Millennials | 12 | 186 |
| Gen X | 12 | 196 |
| Boomers | 14 | 224 |
| Overall | 12 | 186 |
Generation most likely to be addicted to their phone
Regardless of generation, nearly half of every age bracket considers themselves addicted to their phones. With that said, Millennials self-report the highest percentage at 47%, and the other generations hovering just above 45%.
Do you consider yourself addicted to your phone?
| Generation | Percentage that said yes |
|---|---|
| Millennials | 47.30% |
| Boomers | 45.50% |
| Gen X | 45.30% |
| Gen Z | 45.10% |
Which generation is most likely to check notifications the quickest?
Gen Z stands out for being the least likely to check their notifications quickly (meaning within 5 minutes), but over three-fourths of them still do. Millennials are the most likely to check their phones quickly at 87%, followed by the boomers at 85%, and Gen X isn’t far behind at 83%.
Do you check your phone within 5 minutes of getting a notification?
| Generation | Percentage that said yes |
|---|---|
| Gen Z | 77.40% |
| Millennials | 87.30% |
| Gen X | 82.90% |
| Boomers | 85.50% |
Generation most anxious after losing their phone
When it comes to anxious attachment to their phones, boomers reported the highest rate. Nearly three fourths of boomers feel anxious after losing their phone compared to the roughly 2/3rds of Millenials and Gen Xers, and just over half of Gen Z reported being anxious about losing their phones.
Generation Most Anxious After Losing Their Phone
| Generation | Percentage that said yes |
|---|---|
| Gen Z | 52.80% |
| Millennials | 66.70% |
| Gen X | 65.70% |
| Boomers | 74.80% |
Knowing we want a new phone may make the loss of an old one less of an issue: zoomers are the most likely to upgrade their phone soon, whereas boomers are the least likely.
Which generation is most likely to upgrade their phone?
Overall, over a third (37%) of Americans report upgrading their phone in the last year.
Zoomers are most likely (by far) to upgrade their phones, followed by Gen X and Millenials. Still, over a third of baby boomers plan to upgrade their phone, too.
Generation Most Likely To Upgrade Their Phone
| Generation | Percentage that said yes |
|---|---|
| Gen Z | 43.70% |
| Millennials | 35.90% |
| Gen X | 38.30% |
| Boomers | 34.80% |
On average, Americans keep their phones for 2.5 years (about every 29 months) rather than updating annually (a common misperception, largely based on marketing from bigger companies like Apple). People say they typically keep their current phone for about 22 months and want to upgrade in 16 months on average. However, the average American actually upgrades about every 29 months, despite planning to upgrade much sooner.
The top reasons for wanting to upgrade are for faster performance (22%), battery issues (18%), and new features (13%). Only about 8% say getting the newest model is their main reason, and around 6% upgrade primarily because of trade-in or contract deals. Americans pay about $634 on average for a phone, and 47% pay that upfront, so more frequent upgrades end up becoming costly considerations.
And if you feel like the costs for phones (along with internet and streaming prices) are becoming too much, you’re not alone: our recent survey analysis shows that Americans may spend upwards of $200,000 on these services in a lifetime. Of course, you always have options for reducing costs by finding a better cell phone plan or a cheaper internet provider.
Though our relationship with cell phones continues to develop and shift as the years go on, there’s no reason to believe they’re going away anytime soon, even with the advent of AI tech—if anything, we’re more likely to integrate our cell phones and their AI features into daily lives, blurring further the line between being online or offline.
Methodology
Reviews.org surveyed approximately 1,000 US adults ages 18 and older through an online Pollfish survey conducted in Q4 2025. The survey results were weighted by age, gender, and census region to reflect characteristics of the US adult population using available data from the US Census. The survey has an estimated margin of error of +/- 4% at a 95% confidence level.
Screen-time context in this report comes from a separate Reviews.org national survey of US adults conducted in 2025 for the Internet Screen Time report.

Written by
Trevor’s written about YMYL (your money, your life) topics for over six years across editorial publications and retail/eCommerce sites. His work’s been featured on Forbes, RealSimple, USA Today, MSN, BusinessInsider, Entrepreneur, PCMag, and CNN. When he’s not researching and writing, you can find him around Salt Lake City, Utah, snapping photos of mountains and architecture or seeking out some good tunes and friendly faces.
Related Articles
![]()
Back To Top