Linux Web Server Performance Benchmark - 2016 Results (original) (raw)
I have previously performed a benchmark on a variety of web servers in 2012 and have had some people request that I redo the tests with newer versions of the web servers as no doubt a lot has likely changed since then.
Here I’ll be performing benchmarks against the current latest versions of a number of Linux based web servers and then comparing them against each other to get an idea of which one performs the best under a static workload.
First I’ll discuss how the tests were set up and actually done before proceeding into the results.
The Benchmarking Software
Once again I made use of Weighttpd to perform the actual benchmark tests, as I’ve found that it works well and scales quite nicely with multiple threads.
This time around I ran weighttpd on its own virtual machine, I did not do this previously as I wanted to avoid the network stack to get the absolute best performance possible. The problem with running weighttpd on the same server that is running the web server software, is that a significant amount of CPU resources end up being used by the test itself which are thereby taken away from the web server.
Again weighttpd was run via the ab.c script, which essentially automates the testing process for me. Instead of running hundreds of weighttpd commands I use this script to step through different concurrency levels automatically.
weighttp -n 100000 -c [0-1000 step:10 rounds:3] -t 8 -k "http://x.x.x.x:80/index.html"
Where -n is the number of requests, in this case we are sending 100,000 requests for every concurrency level of -c specified. Thanks to ab.c, we are able to step through from 0 simultaneous requests up to 1,000 in increments of 10 at a time. Each test is also performed 3 times as specified in the rounds, this way I am able to get a better average result as each concurrency level is run 3 times. In total every test therefore results in around 30,000,000 GET requests being sent to the web server at http://x.x.x.x:80/index.html.
The -t flag specifies the amount of threads to use, this was adjusted from 1, 2, 4 and 8 depending on the amount of CPU cores assigned to the web server for each test. The -k flag is also specified as we are making use of keep alive.
The Test Environment
In order to perform the tests I made use of two virtual machines that were running on top of VMware ESXi 5.5, so while an extremely small amount of additional performance could have been gained from running on bare metal, making use of virtual machines allowed me to easily modify the amount of CPU cores available when changing between the tests. I’m not trying to get the absolute best performance anyway, as long as each test is comparable to the others then it’s fine and I can adequately test what I am after.
The physical server itself that was running ESXi had two CPU sockets, each with an Intel Xeon L5639 CPU @ 2.13GHz (Turbo 2.7GHz), for a total of 12 CPU cores. This is completely different hardware than what I used for my tests in 2012, so please do not directly compare the amount of requests per second against the old graphs. The numbers provided in this post should only be compared here within this post as everything was run on the same hardware here.
Both the VM running the weighttpd tests and the VM running the web server software were running CentOS 7.2 with Linux kernel 3.10.0-327.10.1.el7.x86_64 installed (fully up to date as of 05/03/2016). Both servers had 4GB of memory and 20gb of SSD based disk space available. The amount of CPU cores on the web server were adjusted to 1, 2, 4 and then 8.
The Web Server
While the web server VM had multiple different web server software installed at once, only one was actually running at any one time and bound to port 80 for the test. A system reboot was performed after each test as I wanted to get an accurate measure of the memory that was used from each test.
The web server versions tested are as follows, these are the latest most up to date versions currently available when the tests were performed 05/03/2016.
Update 1/04/2016: I have retested OpenLiteSpeed, as they made some fixes in response to this post in version 1.4.16.
Update 9/04/2016: I have retested Nginx Stable and Mainline versions, after some help from Valentin Bartenev from Nginx who reached out to me in the comments below I was able to resolve some strange performance issues I had at higher cpu core levels.
- Apache 2.4.6 (Prefork MPM)
- Nginx Stable 1.8.1
- Nginx Mainline 1.9.13
- Cherokee 1.2.104
- Lighttpd 1.4.39
- OpenLiteSpeed 1.4.16
- Varnish 4.1.1
It is important to note that these web servers were only serving a static workload, which was a 7 byte index.html page. The goal of this test was to get an idea of how the web servers performed with raw speed by serving out the same file. I would be interested in doing further testing in the future for dynamic content such as PHP, let me know if you’d be interested in seeing this.
While Varnish is used for caching rather than being a fully fledged web server itself, I thought it would still be interesting to include. Varnish cache was tested with an Nginx 1.8.1 back end – not that this really matters, as after the first request index.html will be pulled from the Varnish cache.
All web servers had keep alive enabled, with a keep alive timeout of 60 seconds, with 1024 requests allowed per keep alive connection. Where applicable, web server configuration files were modified to improve performance such as setting ‘server.max-worker’ in lighttpd to equal the amount of CPU cores as recommended in the documentation. Access logging was also disabled to prevent unnecessary disk I/O and to stop the disk from completely filling up with logs.
Server Configuration
The following adjustments were made to both the server performing the test and the web server to help maximize performance.
The /etc/sysctl.conf file was modified as below.
fs.file-max = 5000000 net.core.netdev_max_backlog = 400000 net.core.optmem_max = 10000000 net.core.rmem_default = 10000000 net.core.rmem_max = 10000000 net.core.somaxconn = 100000 net.core.wmem_default = 10000000 net.core.wmem_max = 10000000 net.ipv4.conf.all.rp_filter = 1 net.ipv4.conf.default.rp_filter = 1 net.ipv4.ip_local_port_range = 1024 65535 net.ipv4.tcp_congestion_control = bic net.ipv4.tcp_ecn = 0 net.ipv4.tcp_max_syn_backlog = 12000 net.ipv4.tcp_max_tw_buckets = 2000000 net.ipv4.tcp_mem = 30000000 30000000 30000000 net.ipv4.tcp_rmem = 30000000 30000000 30000000 net.ipv4.tcp_sack = 1 net.ipv4.tcp_syncookies = 0 net.ipv4.tcp_timestamps = 1 net.ipv4.tcp_wmem = 30000000 30000000 30000000 net.ipv4.tcp_tw_recycle = 1 net.ipv4.tcp_tw_reuse = 1
The /etc/security/limits.conf file was modified as below.
- soft nofile 10000
- hard nofile 10000
These changes are required to prevent various limits being hit, such as running out of TCP ports or open files. It’s important to note that these values are likely not what you would want to use within a production environment, I am using them to get the best performance I can from my servers and to also prevent the test runs from failing.
Benchmark Results
Now that all of that has been explained, here are the results of my benchmark tests as graphs.
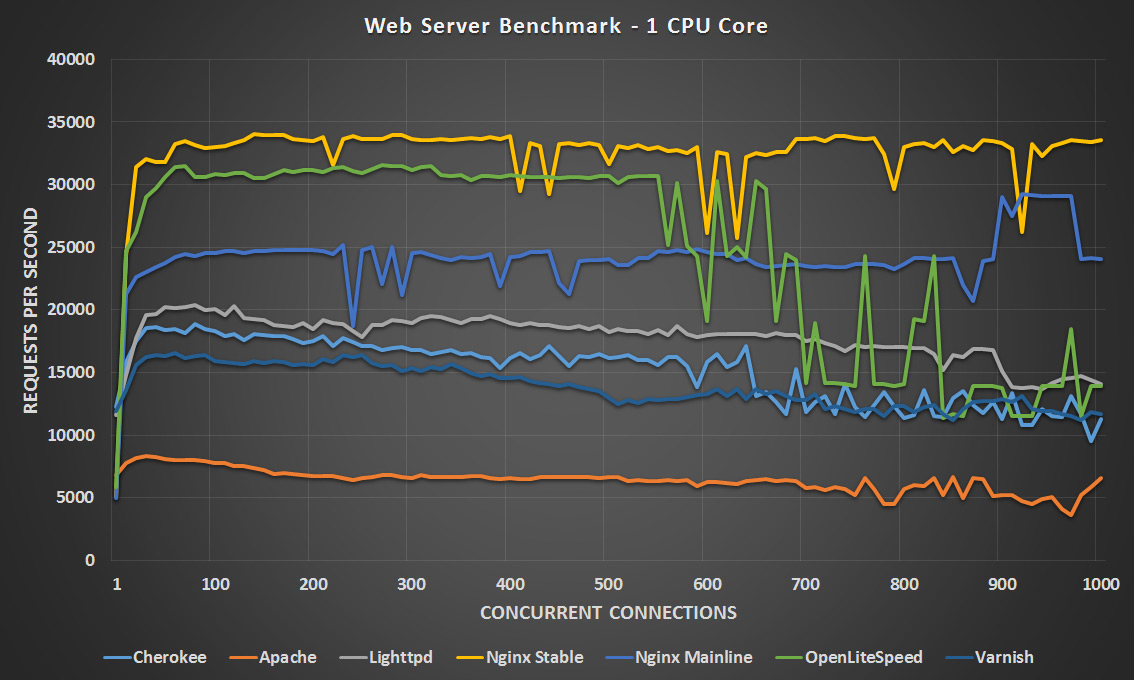
1 CPU Core – Click Image To Expand
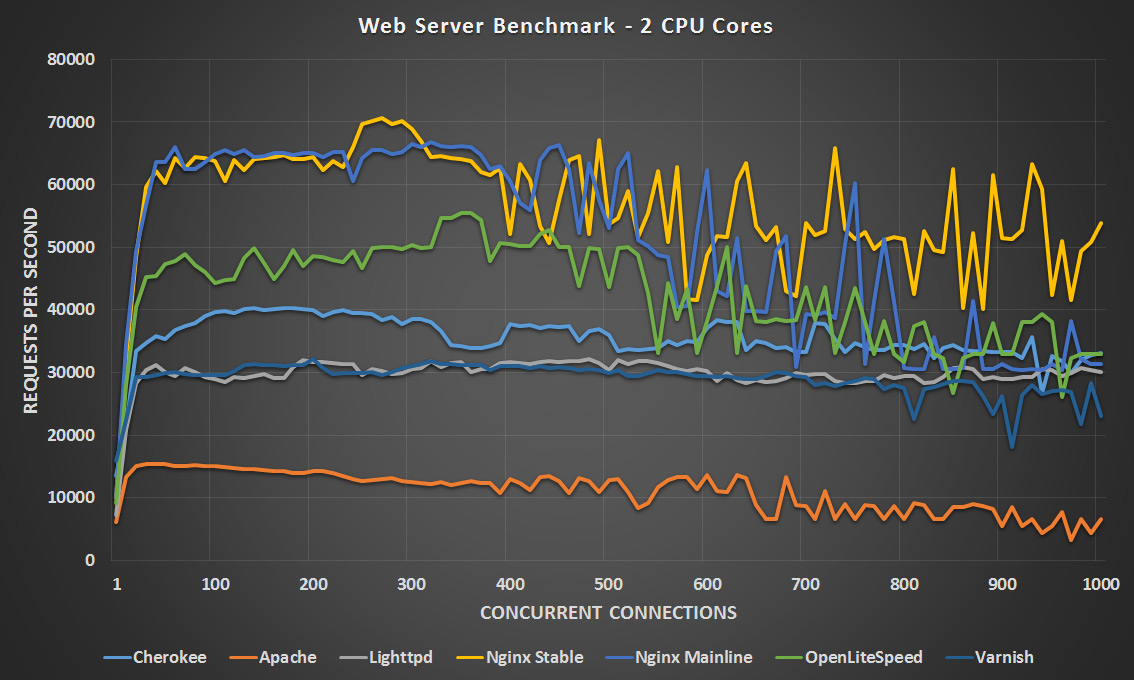
2 CPU Cores – Click Image To Expand
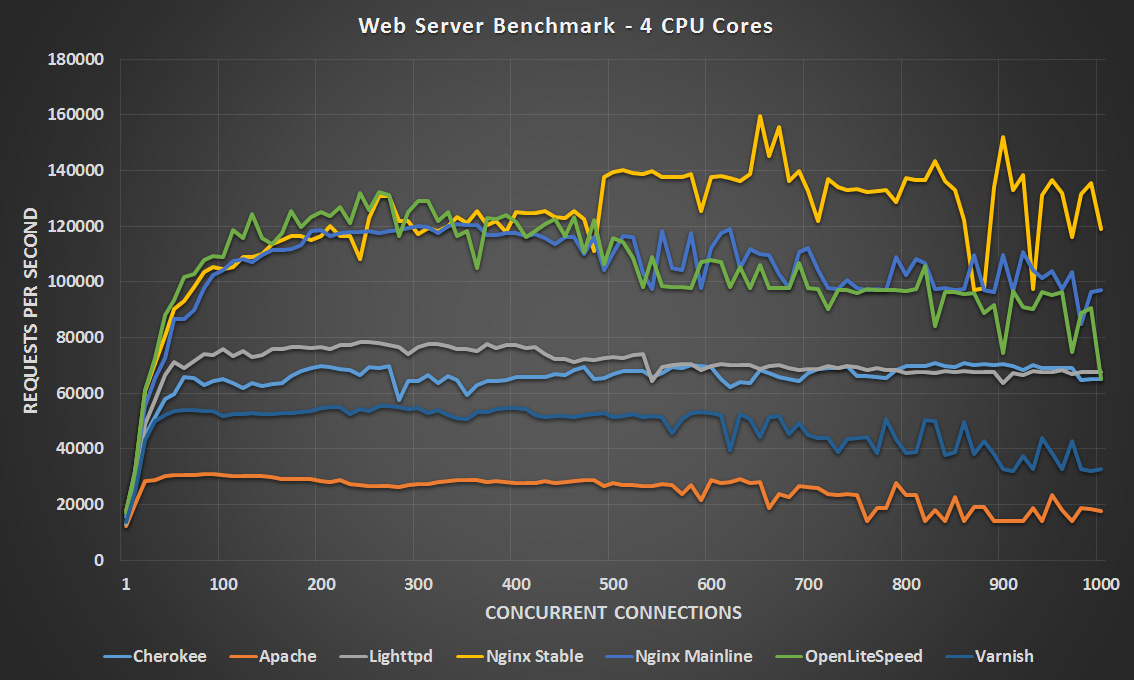
4 CPU Cores – Click Image To Expand
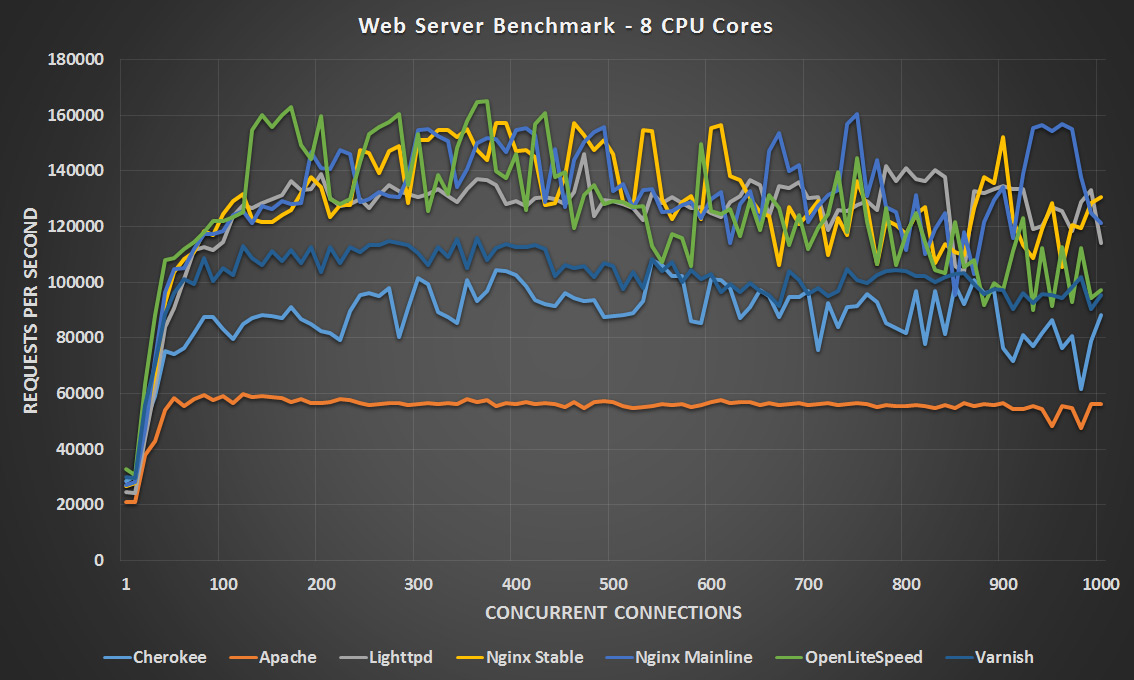
8 CPU Cores – Click Image To Expand
In general Apache still seems to perform the worst which was expected, as this has traditionally been the case. With 1 CPU core Nginx stable is clearly ahead, followed by OpenLiteSpeed until the 600 concurrency point where it starts to drop off and is surpassed by Nginx Mainline and Lighttpd at these higher concurrency levels. With two CPU cores Nginx mainline and stable are neck and neck however the stable version seems to perform better at the higher concurrency levels, with OpenLiteSpeed not too far behind and coming in third place.
With 4 CPU cores both versions of Nginx and OpenLiteSpeed are very close until the 500 concurrent connection point with OpenLiteSpeed slightly in the lead, however after 500 OpenLiteSpeed and Nginx Mainline drop off a little and appear to be closely matched while Nginx Stable takes the lead. At 8 CPU cores it’s a pretty tight match between OpenLiteSpeed, Nginx Stable/Mainline and Lighttpd. All four of these finished their tests within 12 seconds of each other, very close indeed. Nginx Mainline finished first in 4:16, Nginx Stable was second at 4:21, OpenLiteSpeed was third at 4:26 and Lighttpd was fourth at 4:28.
As we can see with the recent changes to OpenLiteSpeed it has definitely been optimized for this type of workload as it’s performing quite close to Nginx, the speeds basically doubled after this. Additionally it looks like Lighttpd is now beating Cherokee more consistently than when I previously ran these tests. The latest version of Varnish cache also noticeably performs better based on the more CPU cores it has available as it moves up in each test, from almost second worst at 1 CPU core to second best at 8 CPU cores.
In my original tests I had some strange performance issues with Nginx only using around 50% CPU at the 4 and 8 CPU core counts, after being contacted by Valentin Bartenev from Nginx and provided with some configuration change suggestions Nginx seems to be performing much better as can be seen by it coming out first in every test here. I think most of the performance increase was a result of removing “sendfile on;” from my configuration as suggested, as this is not much use for small content, and as mentioned I am using a 7 byte HTML file. Other suggested changes which helped improve performance included these:
accept_mutex off; open_file_cache max=100; etag off; listen 80 deferred reuseport fastopen=512; #I only found this worked in Mainline.
Otherwise the Nginx configuration was default.
Memory Usage
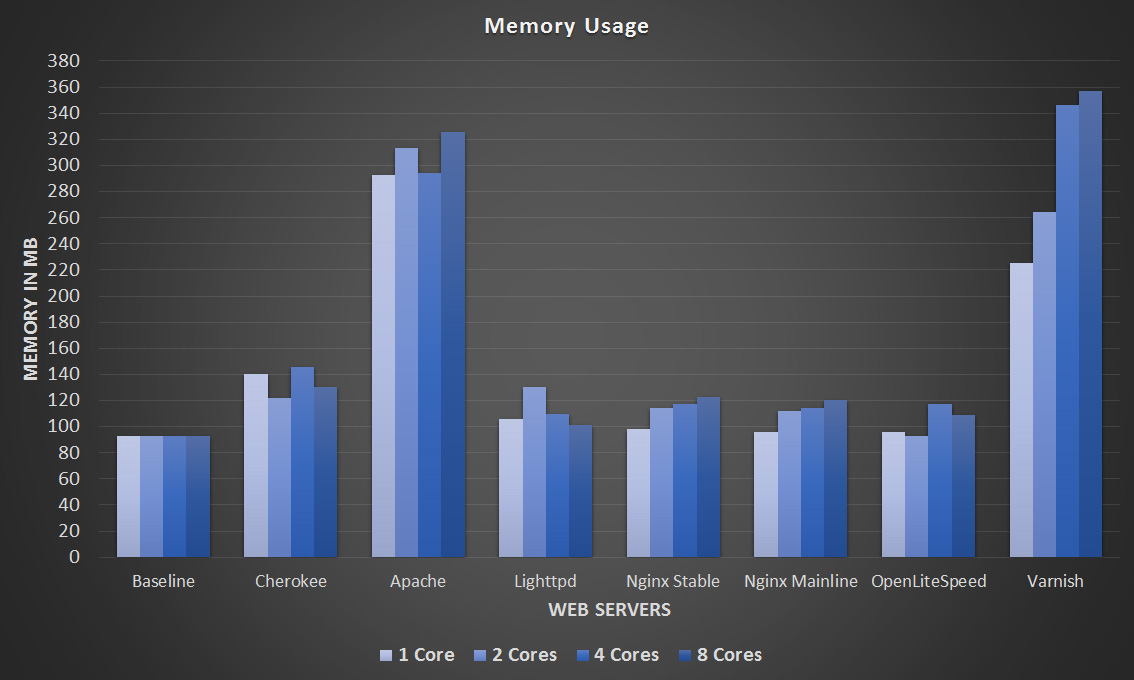
At the end of each test just before the benchmark completed, I recorded the amount of memory in use with the ‘free -m’ command. I have also noted the amount of memory in use by just the operating system after a fresh reboot so that we can compare what the web servers are actually using. The results are displayed in the graph below, and the raw memory data can be found in this text file.
Memory Usage – Click Image To Expand
As you should be able to see, the memory usage was not very much considering the VM had 4gb assigned. This should be expected with such a small and static workload. Despite this Apache and Varnish did seem to use significantly more memory than the other web servers. Varnish is configured to explicitly use RAM for cache, however the static index.html file was only 7 bytes in size. Other than those two, the others are fairly even in comparison.
Total Time Taken
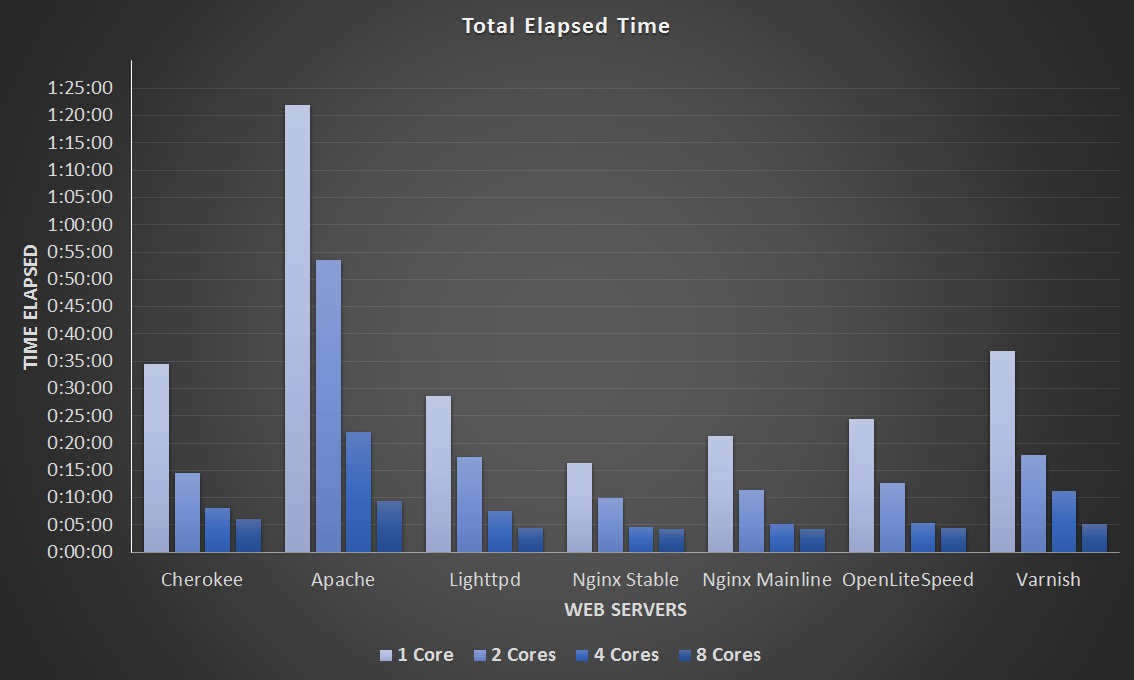
This final graph simply displays how long the tests took to complete in the format of hours:minutes:seconds. Keep in mind as mentioned previously each test will result in approximately 30,000,000 GET requests for the index.html page.
Total Time Taken – Click Image To Expand
The raw data from this graph can be viewed here.
Here we can see more easily that some web servers appear to scale better than others. Take Apache for example, with 1 CPU core the average requests per second were 7,500, double the available CPU and the requests per second double to around 15,000, double the CPU again to 4 CPU cores and the requests double again as well to 30,000, double again to 8 CPU cores and we’re now at 60,000 requests per second.
Although performing the worst overall, the Apache results are actually quite predictable and scalable. Compare this to the 4 and 8 CPU core result of Cherokee, where it seems that very little time was actually saved when increasing from 4 to 8 cores. Nginx on the other hand had very similar results in my 4 and 8 core testing in terms of the total time taken, despite performing the quickest I found this interesting that at this level the additional cores didn’t help very much, further tweaking may be required to get better performance here.
Summary
The results show that in most instances, simply increasing the CPU and tweaking the configuration a little provides a scalable performance increase under a static workload.
This will likely change as more than 8 CPU cores are added. I did start to see small diminishing returns when comparing the differences between going from 1 to 2 CPU cores against the jump from 4 to 8 CPU cores. More cores aren’t always going to be better unless there are optimizations in place to actually make use of more resources.
While Apache may be the most widely used web server it’s interesting that it’s still coming last in most tests, yet using more resources. I’m going to have to look into Lighttpd/OpenLiteSpeed more as they have both given some interesting results here and I haven’t used them much previously, particularly with a higher CPU core count. While Nginx did win I have a bit of experience with this and have used it in the past – it’s the web server I’m using to serve this website.
I’d be interested in hearing if this information will change the web server that you use. Which web server do you typically use and why?
