What is Matplotlib in Python? - Scaler Topics (original) (raw)
Overview
Matplotlib is a solution for Python users who need to visualize their data to make essential statistical conclusions. It is a complete plotting package useful for Python and NumPy users. This article will assist you in comprehending the matplotlib library, which is frequently used in the industry. Matplotlib includes a wide range of graphical tools and is simple to use.
Introduction
Data visualization is one of the essential skills that data scientists are expected to have. Visualization techniques can be used to understand and address most business challenges. Exploratory Data Analysis (EDA) and Graphical Plots are the main visualization components. Effective visualization helps users understand data trends and solve business problems more efficiently. Another advantage of visualization is that it reduces complex data more readably.
A visual is significantly more straightforward to understand than text for most people. As a result, visualization is the most effective communication tool for analyzing and interpreting data. It allows customers to interpret vast amounts of data quickly. Trends, correlations, patterns, distributions, and so on can all be better understood through data visualization.
For data visualization, numerous tools and technologies are available in the market, with Python being the most popular. Python has many libraries for data visualization; a few of the most prominent graphic libraries are:
- Matplotlib
- Seaborn
- Pandas visualization
- Plotly
What is Matplotlib in Python?
Matplotlib is the basic plotting library of the Python programming language. Among Python visualization packages, it is the most widely used.
Matplotlib is exceptionally fast at a variety of operations. In addition, it can export visualizations to all popular image formats, including PDF, SVG, JPG, PNG, BMP, and GIF.
It can create line graphs, scatter plots, histograms, bar charts, error charts, pie charts, box plots, and many other visualization styles. Along with that, 3D charting is also possible with Matplotlib.
Matplotlib serves as the foundation for several Python libraries and was used to build Pandas and Seaborn, for example. They make it possible to access Matplotlib's methods with less code.
John Hunter founded the Matplotlib project in 2002. It was created during a post-doctoral study in Neurobiology to show Electrocorticography (ECoG) data from epileptic patients.
Matplotlib, an open-source plotting toolkit for the Python programming language, has become the most extensively used plotting library. For example, it was used to visualize data during the 2008 landing of the Phoenix spacecraft.
Why is Matplotlib so Popular?
Matplotlib's popularity can be explained as follows:
- For beginners, it is simple and straightforward.
- It is open-source and free.
- Matplotlib is a highly customized and robust library.
- Matplotlib is good at working with data frames and arrays. Figures and axes are treated as objects. It has several stateful plotting APIs. As a result, methods like plot() can be used without any parameters.
- Those who have used MATLAB or other graph plotting tools will find Matplotlib easy to use.
- Matplotlib can be used in various contexts, such as Python scripts, the Python and iPython shells, and Jupyter Notebooks.
- Matplotlib is a 2-D plotting library. However, several extensions can produce complex visualizations such as 3-D graphs, etc.
- It offers high-quality photos and plots in various formats, including png, pdf, and pgf.
- Controls numerous aspects of a figure, including DPI, figure color, and figure size.
Examples of Matplotlib in Python
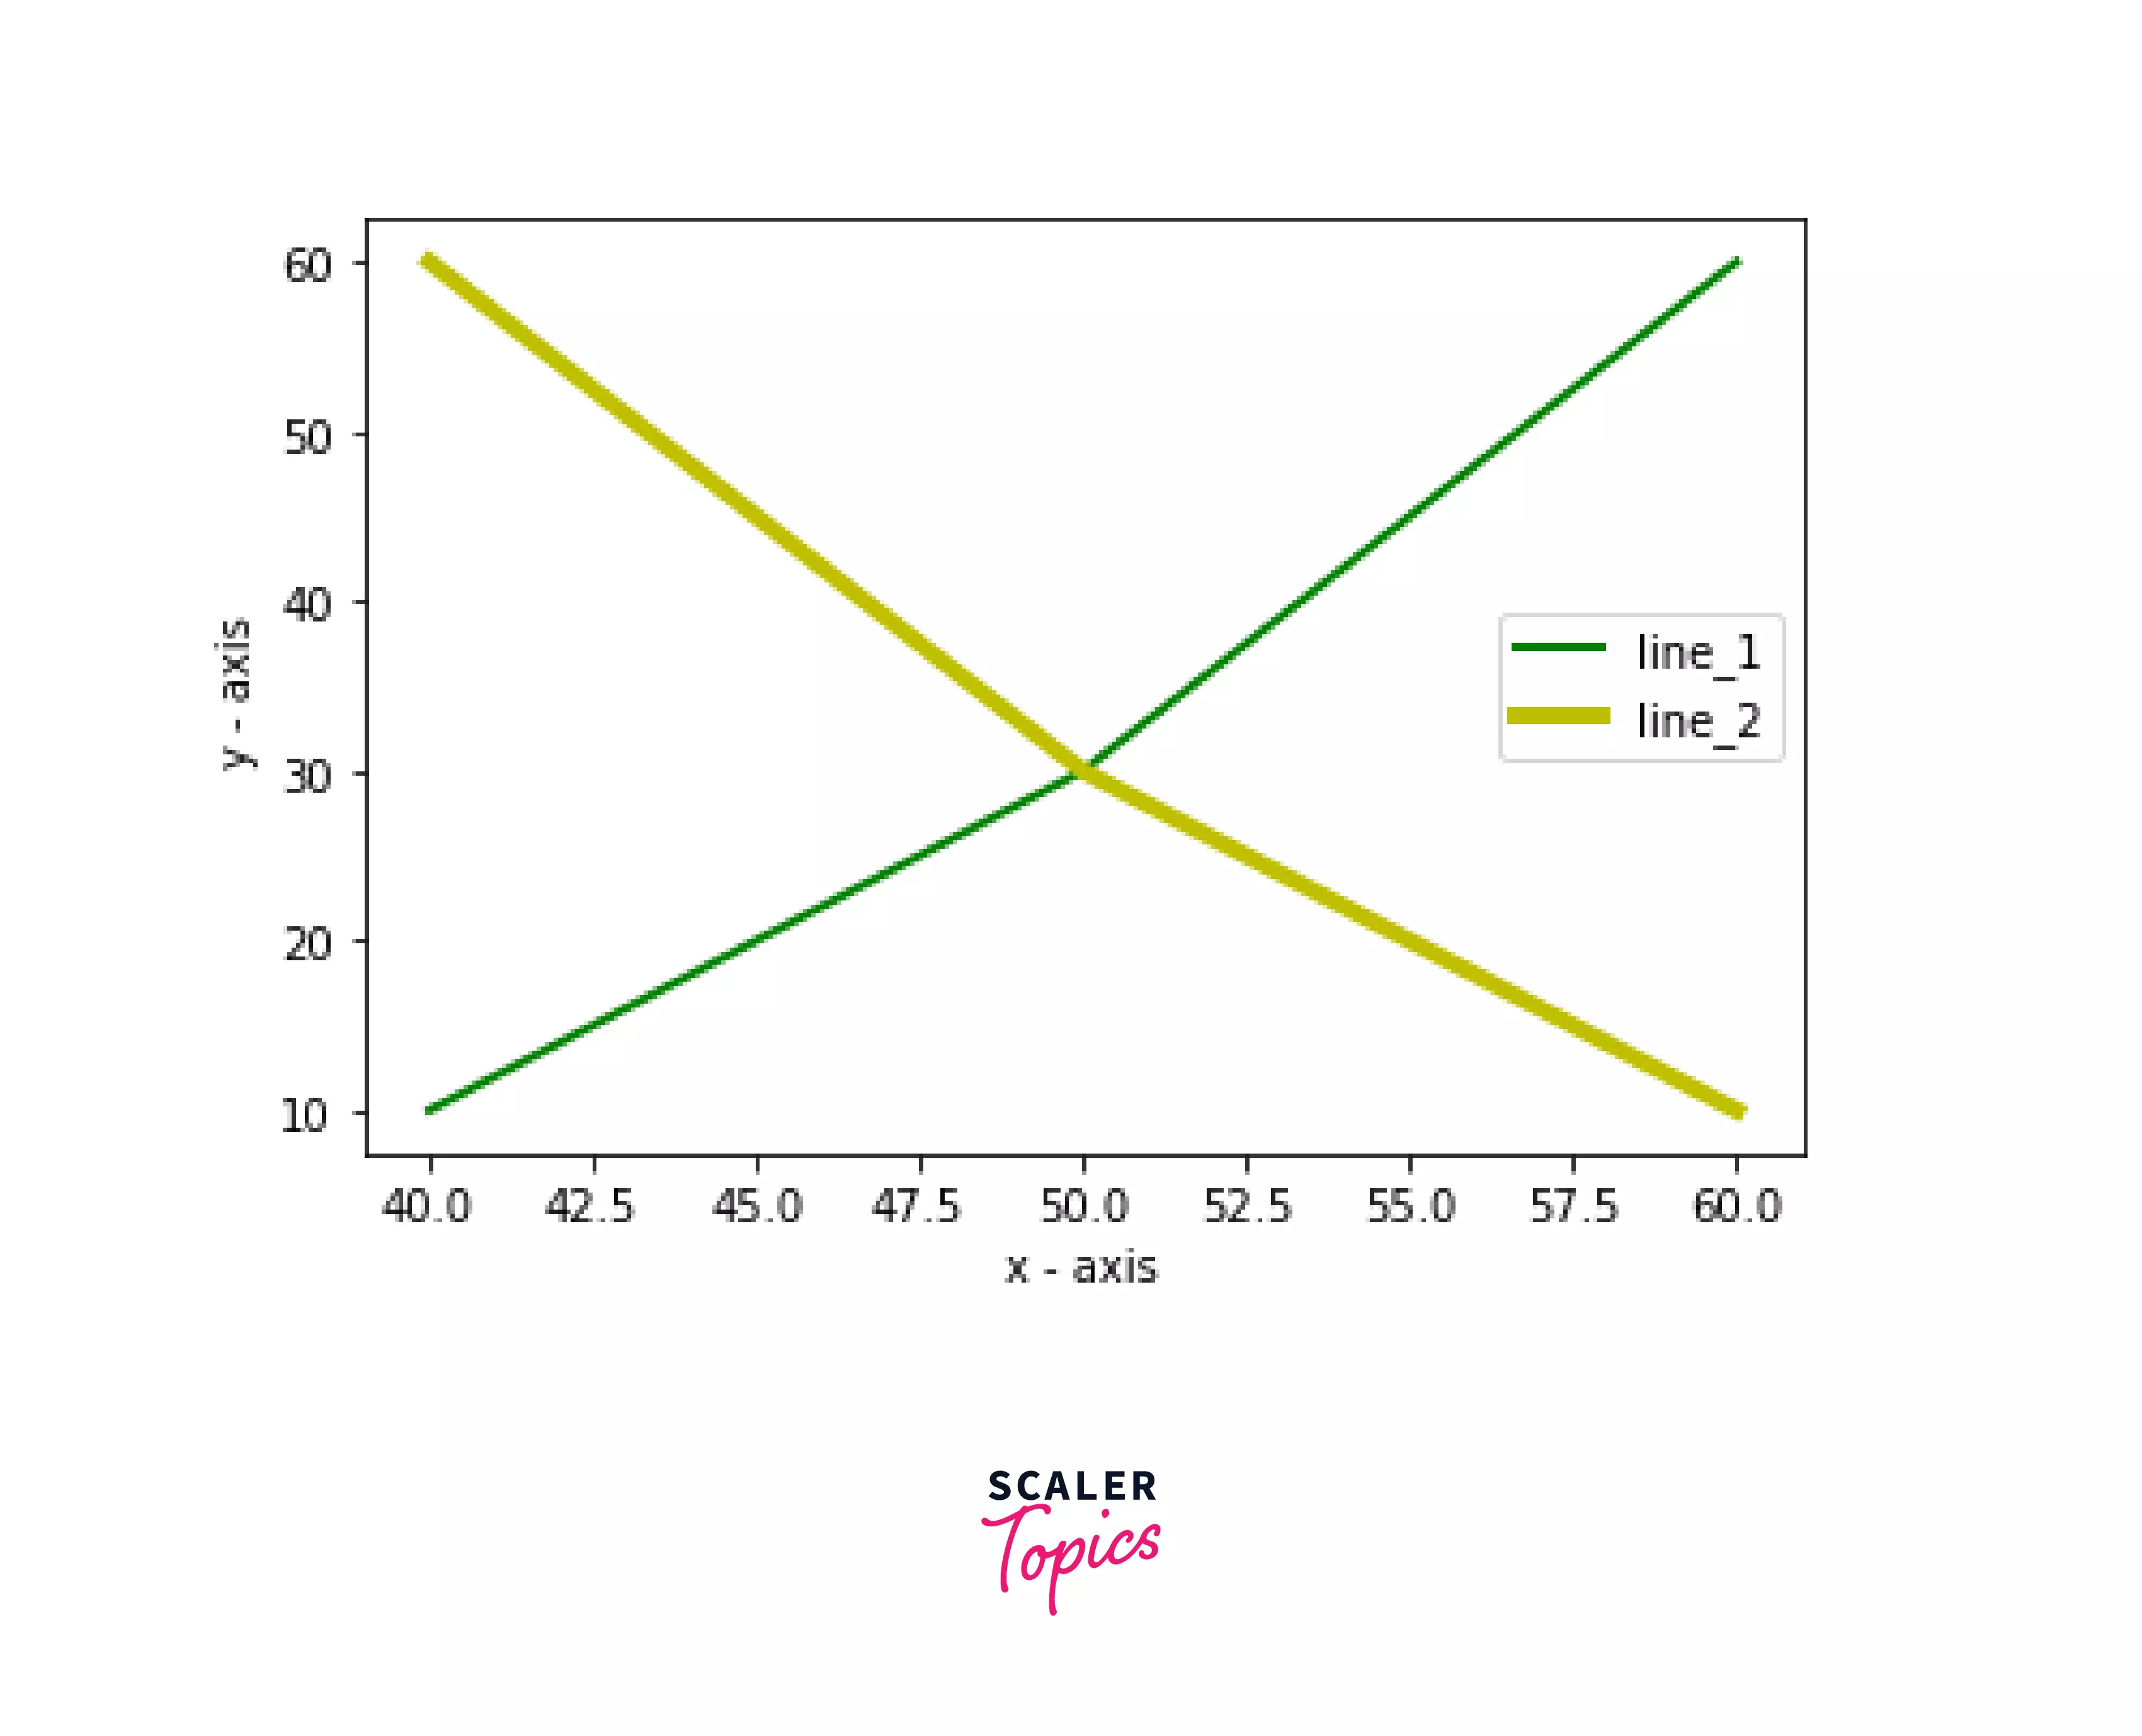
**Example 1:**Create several line charts on a shared plot by plotting two data ranges on the same chart. The data range(s) to be plotted are as follows:
line 1 pointsx1 = [40,50,60] y1 = [10,30,60]
line 2 pointsx2 = [40,50,60] y2 = [60,30,10]
The legend can be seen in the upper left corner. The X axis is labeled "X–Axis," and the Y axis is labeled "Y–Axis." The lines should be of varying width and color.
Output:
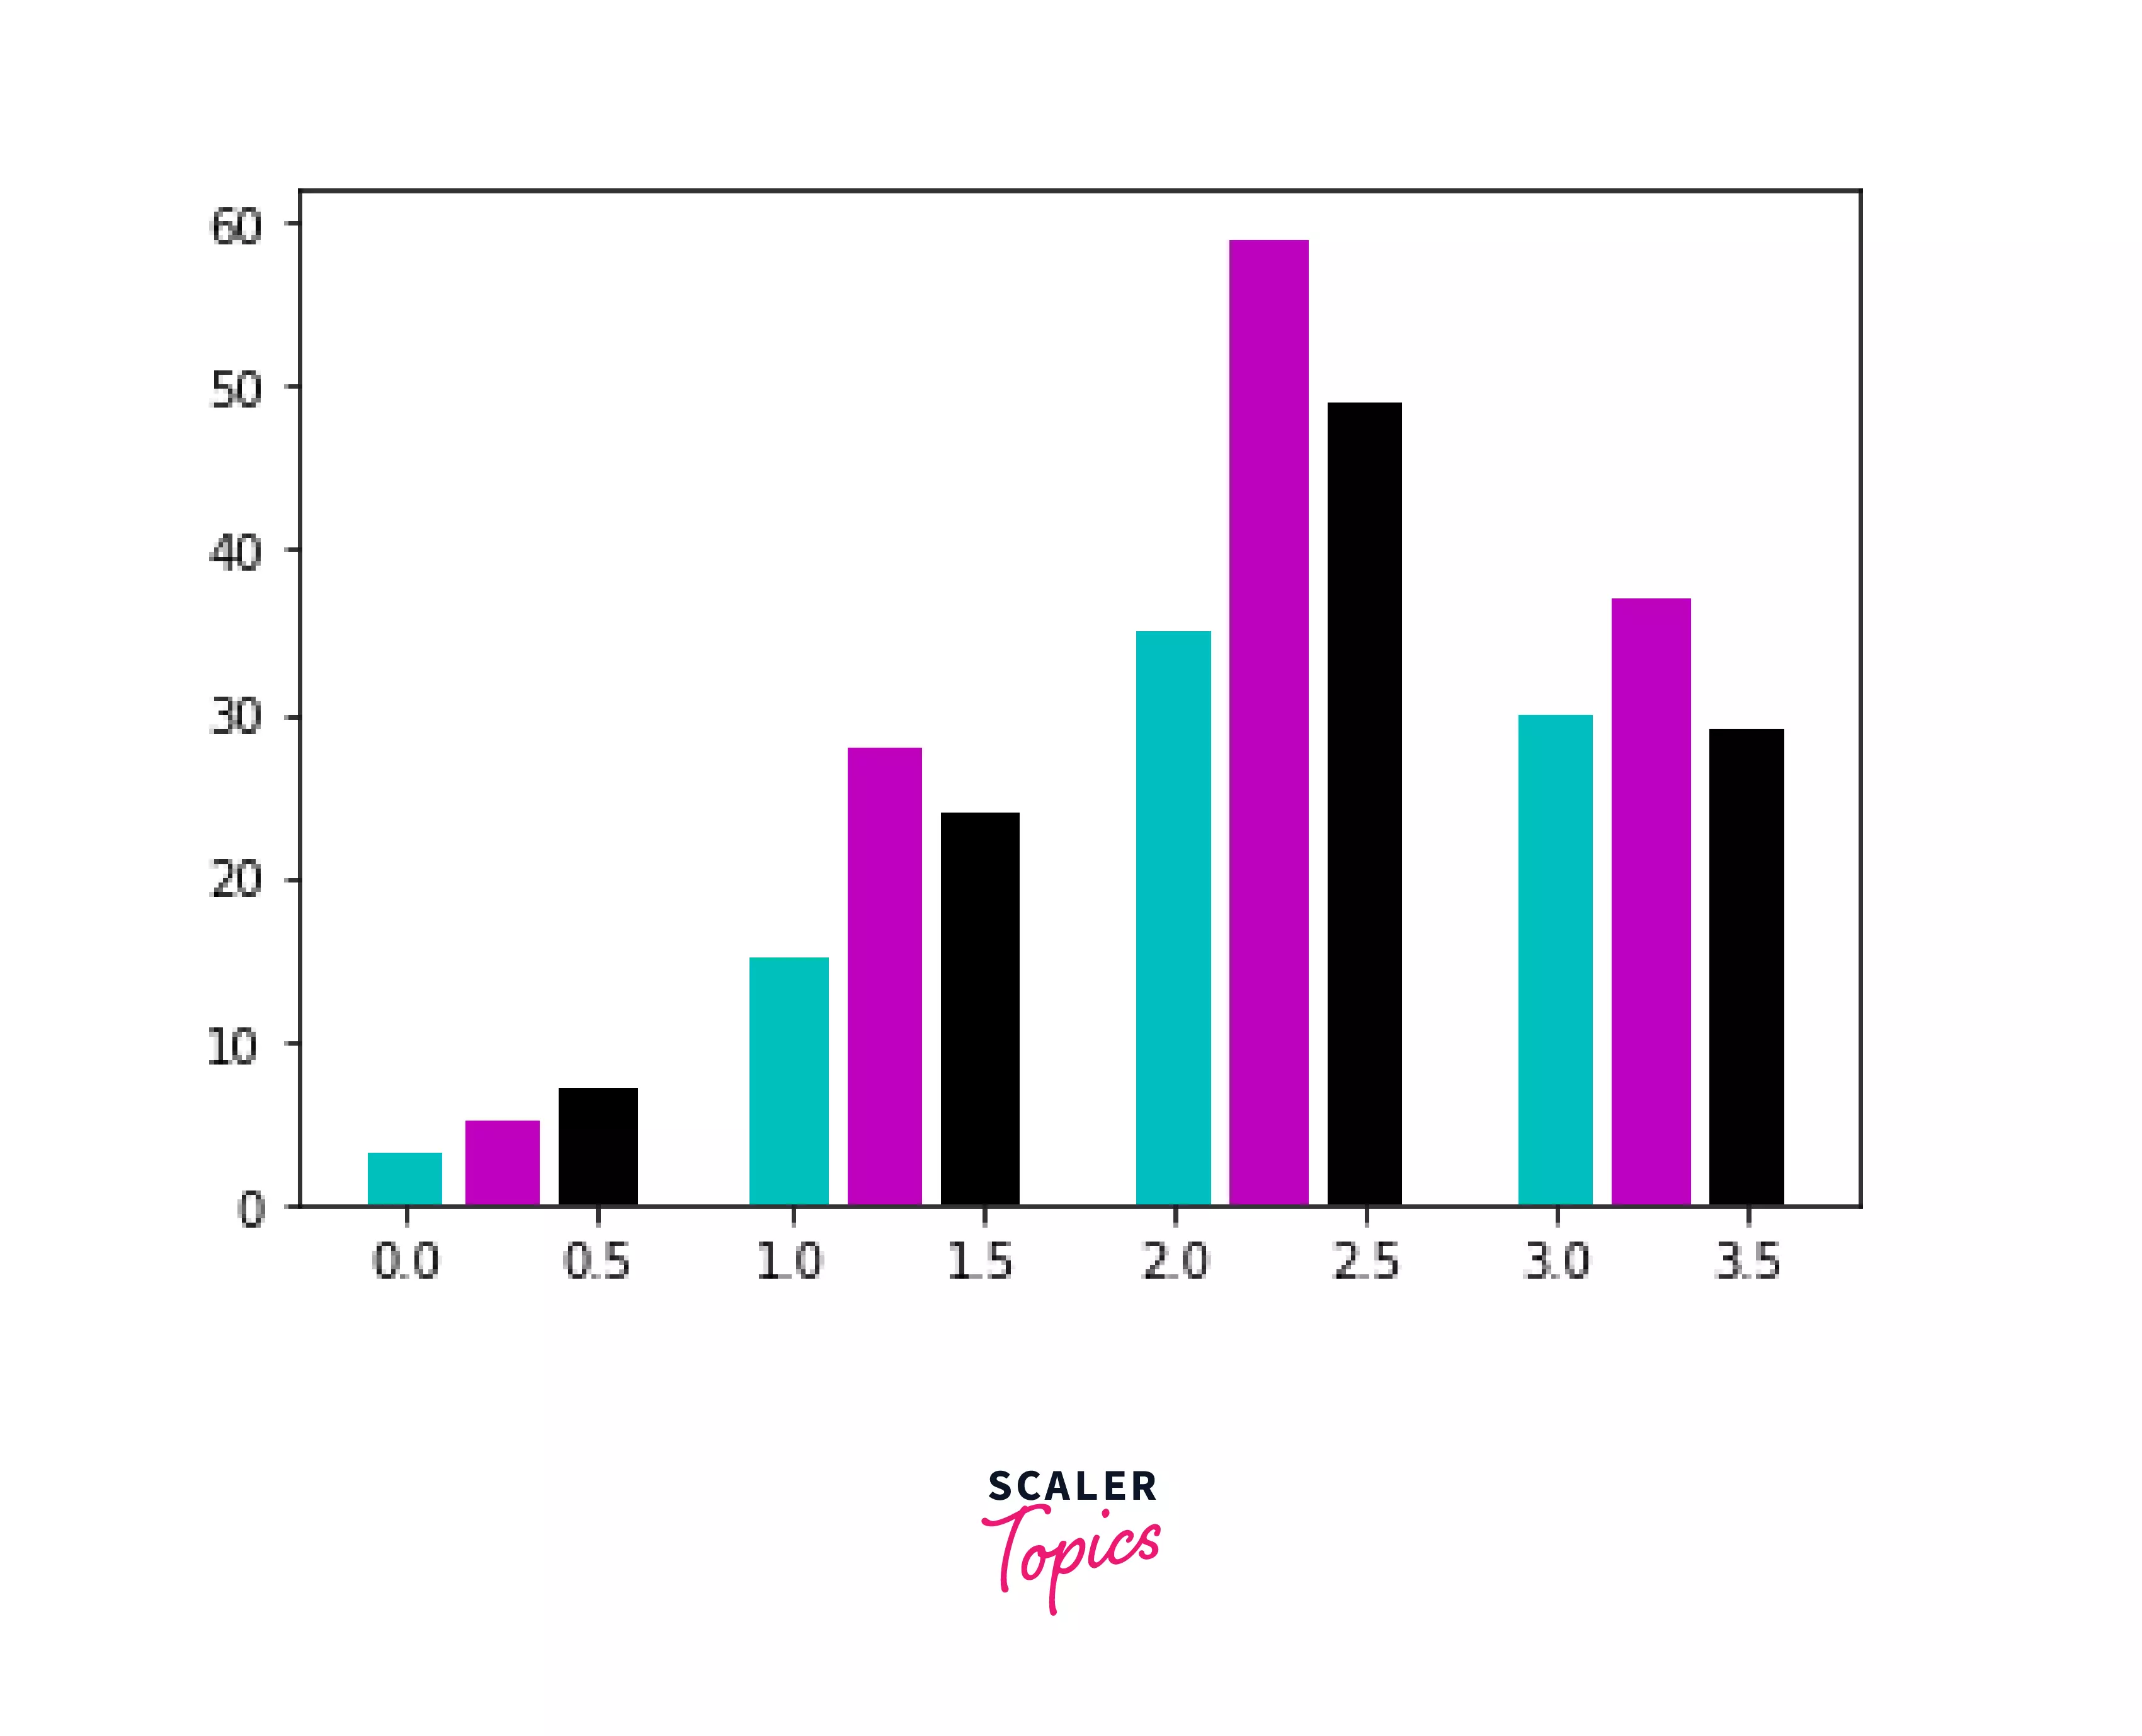
Example 2:
Make a bar chart using the following data from three runners over four marathons:
Runners = [[3,15,35,30],[5,28,59,37], [7,24,49,29]]
Output:
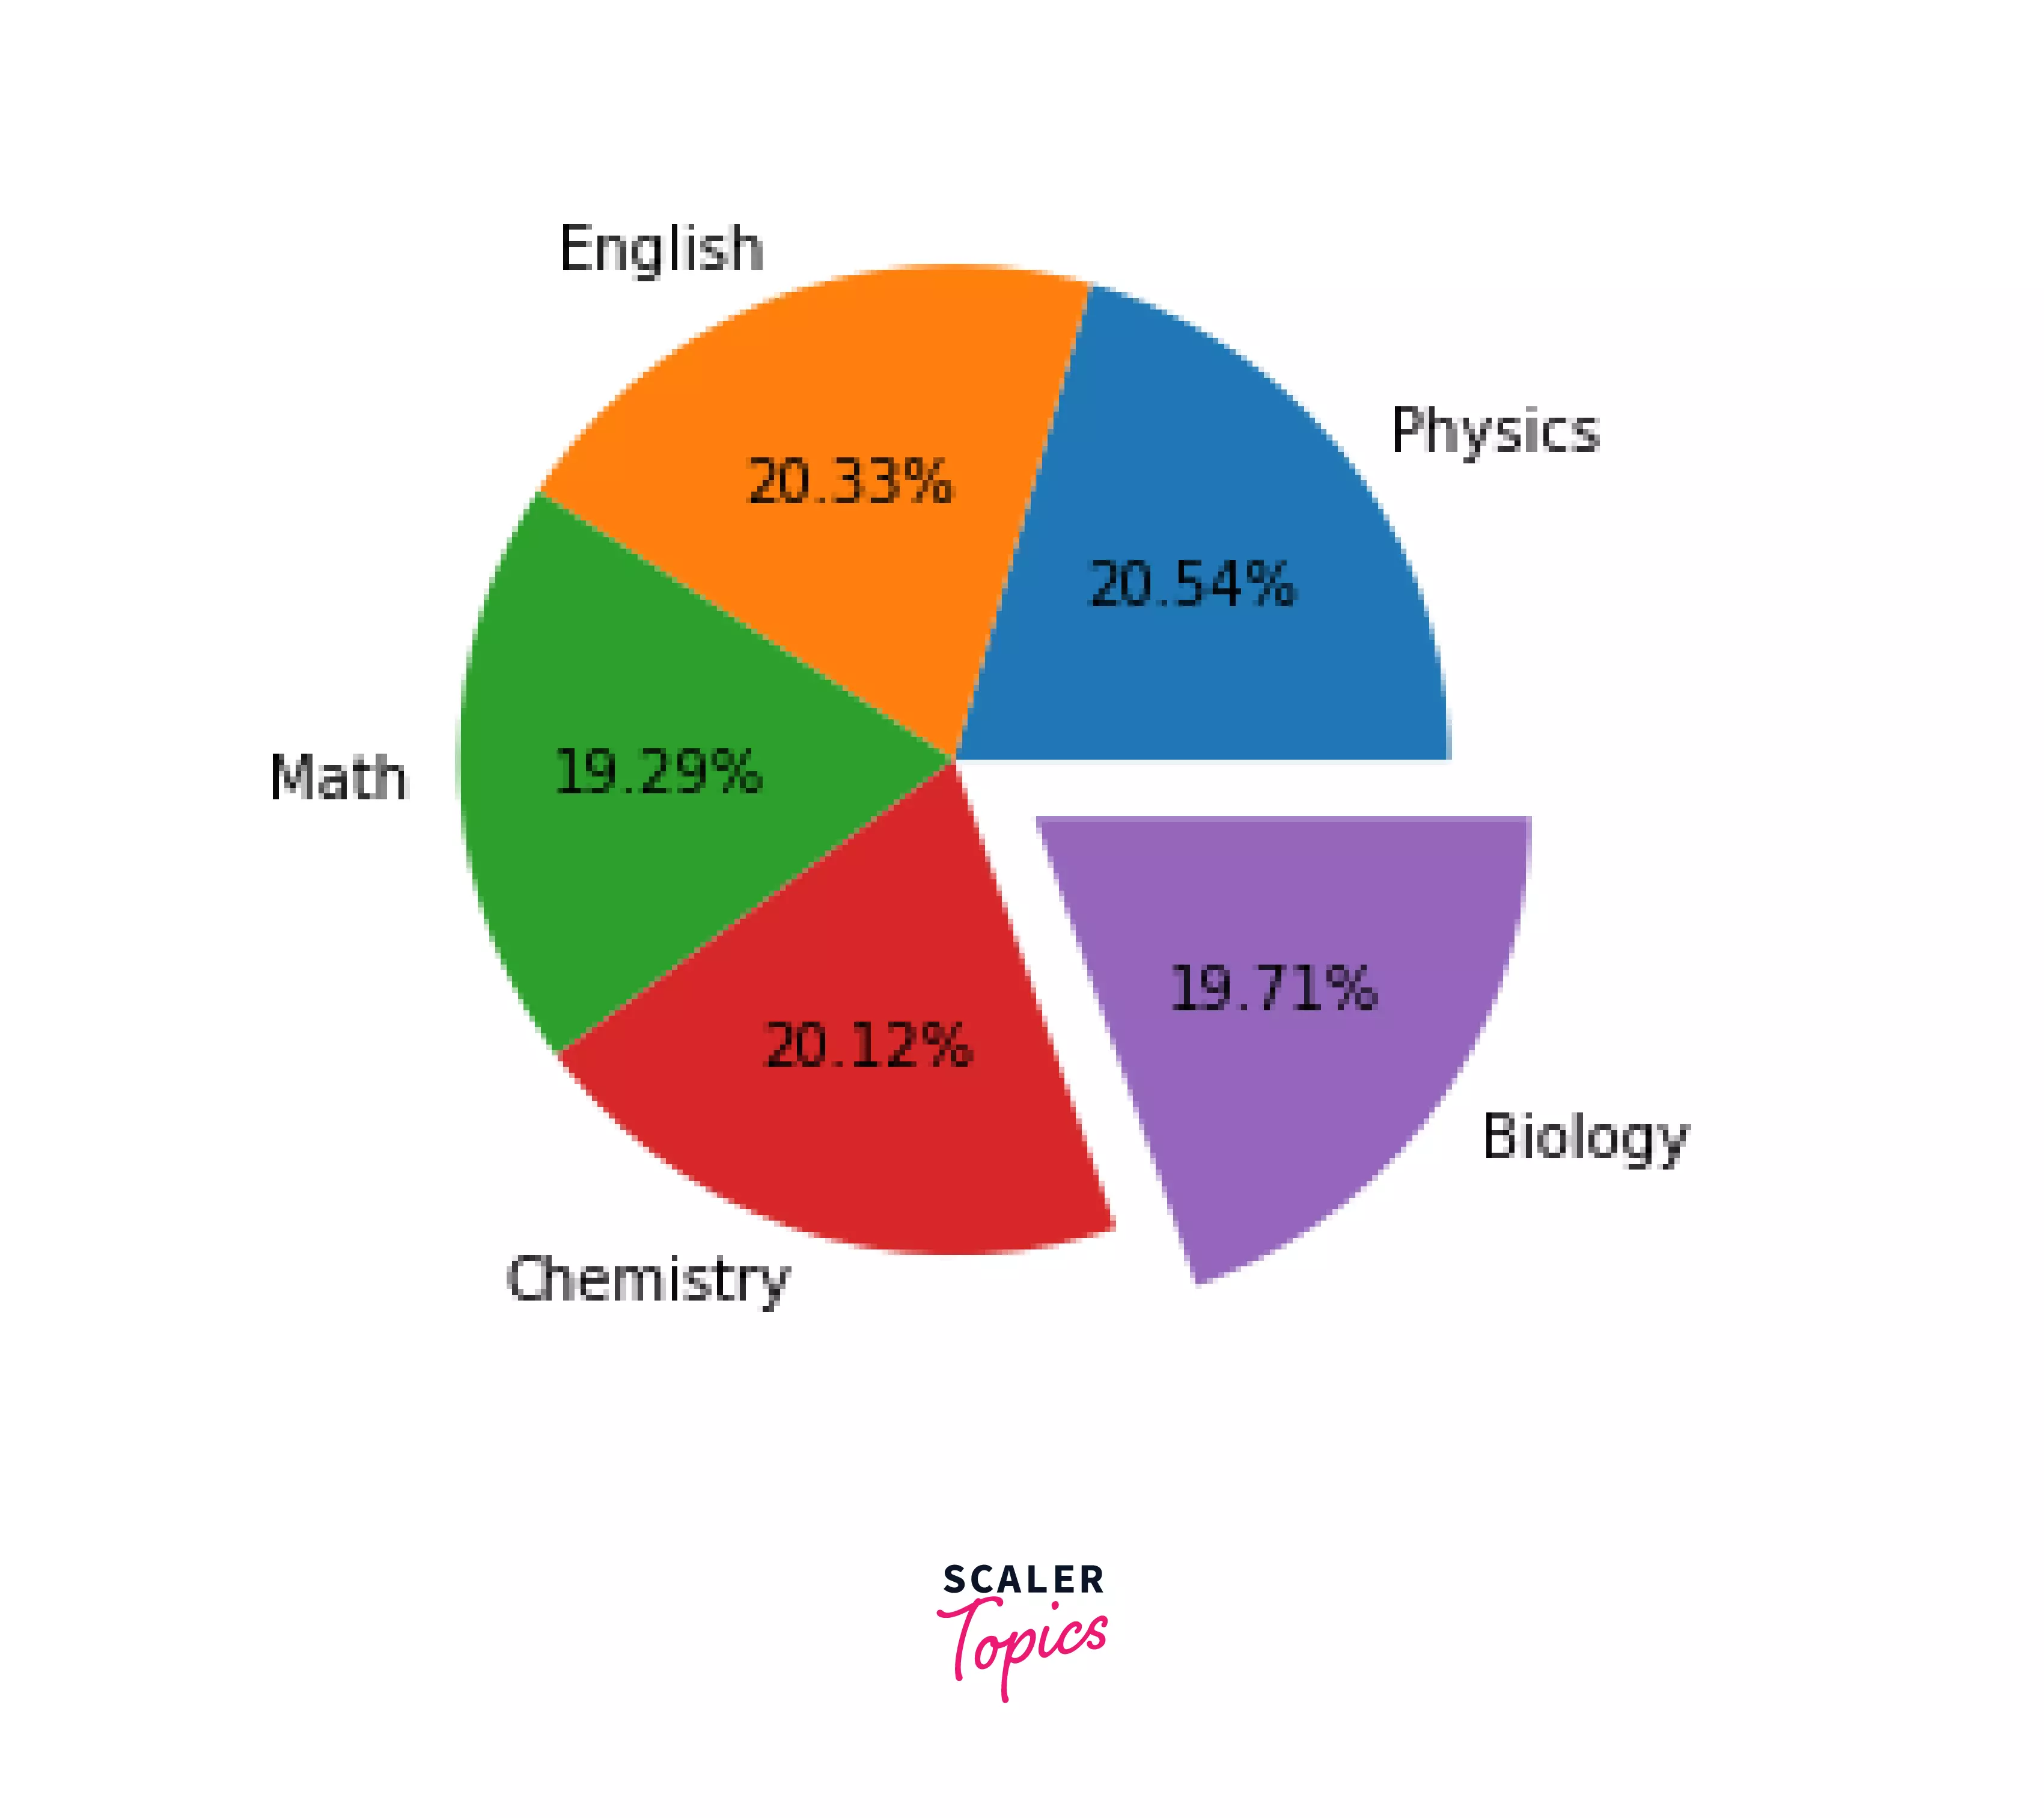
**Example 3:**Create a pie chart for a student's grades using the following data:
* _Physics - 99 * _English - 98 * _Math - 93 * _Chemistry - 97 * _Biology - 95
Output:
Features of Matplotlib
- It is a data visualization package for the Python programming language and is the most basic and widely used method for plotting data in Python.
- It includes tools for creating publication-standard plots and figures in several export formats and environments (pycharm, jupyter notebook) across platforms.
- It also includes a procedural interface called Pylab, which is supposed to behave similarly to MATLAB, a programming language popular among scientists and researchers. MATLAB is a commercial application that is not open source.
- It's comparable to MATLAB plotting, giving users complete control over fonts, lines, colors, styles, and axes attributes.
- Matplotlib with NumPy might be considered the open-source version of MATLAB.
- Creating high-quality static graphics for publications and professional presentations is a great approach, which Matplotlib aids with.
- It also works with various third-party libraries and packages, allowing matplotlib to expand its capabilities.
- It is clear that matplotlib, with its various compatible third-party libraries, provides users with powerful tools to visualize various data.
Applications of Matplotlib
- Matplotlib creates significant figures across various platforms in many physical and graphical formats.
- It is a Python library that can be used in scripts and shells.
- Web application servers can utilize Matplotlib.
- Matplotlib is a graphical user interface toolkit that may be used in a variety of graphical user interface toolkits.
Accelerate Your Data Science Career with Our Industry-Expert-Led Data Science Online Course. Enroll Now and Earn Your Certification!
Conclusion
- This lesson should have demonstrated what Python Matplotlib is capable of.
- This article explains how Matplotlib came to be and how it is often used with other libraries.
- The primary applications of Matplotlib in Python involve dealing with massive volumes of data and visualizing it in graphs for improved understanding.
- To summarise, matplotlib is a fantastic package for exploratory data research and displaying publishing quality. Its popularity derives from using a pyplot state machine to provide an easy-to-use procedural interface.