What is a business intelligence dashboard (BI dashboard)? (original) (raw)
A business intelligence dashboard, or BI dashboard, is a data visualization and analysis tool that displays on one screen the status of key performance indicators (KPIs) and other important business metrics. It provides these data points to an organization, department, team or process. Dashboards are an integral component of most BI software platforms and are used to deliver analytics information to business executives and other employees.
These tools are also sometimes referred to as business dashboards, business intelligence tools or data dashboards. They typically contain multiple data visualizations to give users a combined view of relevant KPIs and trends for both operational decision-making and strategic planning.
BI dashboards are more interactive than static BI reports. They let users access the data that underlies charts and graphs for further analysis. In some cases, members of a BI team design the dashboards; in others, business analysts and other users create them using self-service BI tools.
BI dashboard features and components
The primary role of modern BI dashboard software is supporting interactivity. These platforms provide other essential features, including user-friendly, customizable interfaces, dashboard templates to accelerate the design process, and the ability to pull in both historical and real-time data. Dashboard tools offer libraries of widgets, icons and images that automate dashboard functions and improve usability and visual appeal. They also have useful tabs, drop-down menus and other navigation features.
The primary components of designed dashboards include the following items:
- Connections to data sources. Depending on the data that users need to see, BI dashboards can be connected to data warehouses, data marts and data lakes -- the most common analytics data stores. They can also be connected to operational systems, industrial equipment and external data feeds to provide workflows with more up-to-date information.
- Data visualizations. Dashboards are configured with various types of data visualizations to show different performance metrics, statistics and other information. Supported visualizations range from basic line and bar charts to more elaborate graphics, such as bubble charts, heat maps and scatter plots.
- Data tables. BI dashboards also incorporate tables of data that provide an at-a-glance look at relevant data values. The tabular data often includes color coding and other graphical treatments to highlight specific information, such as a decline in sales or financial losses.
- Drill-down capabilities. This feature lets users click on a data visualization to get more information or look at and analyze detailed data. Doing so takes them to additional visualizations or data tables, often arranged in a hierarchical fashion so users can drill down multiple levels if they want to.
- Data filters. Filters areanother interactive feature, letting users customize date and time ranges, geographic settings and other parameters in data visualizations to get a more focused view of the information presented.
- Text boxes and tooltips. Dashboards often include standalone text boxes and pop-up information tooltips that explain the visualized data or provide additional information and context about the analysis.
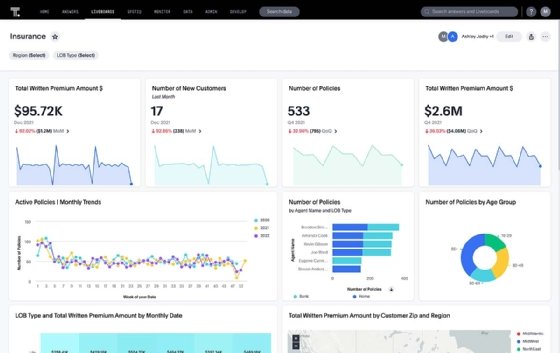
BI dashboards display various KPIs and data points. This ThoughtSpot dashboard shows insurance metrics.
Benefits and limitations of BI dashboards
BI dashboards are increasingly seen as critical tools to help enterprises derive valuable business insights from their growing storehouses of data. Businesses often have big data sets that combine the structured data commonly used in BI applications with unstructured and semistructured forms of data. Well-designed dashboards provide the following business benefits:
- They help executives make more informed decisions and strategic plans.
- They make number-intensive data and business analytics metrics comprehensible to users who aren't skilled analysts.
- They identify business trends so an organization can capitalize on opportunities and address problems.
- They integrate artificial intelligence capabilities to process vast amounts of historical data quickly. AI also helps discover relationships between data points, enhancing an organization's understanding of consumer behaviors and preferences.
- They ease the deployment and use of self-service BI applications by business analysts, managers and workers.
- They support more collaborative data analysis and decision-making processes through increased information sharing.
- They provide data visualization capabilities to make data more understandable and useful.
- They automate reporting and dashboard creation tasks using AI capabilities that quickly analyze data sets and recommend appropriate KPIs and layouts, for example.
But dashboards also pose challenges for both BI teams and business users. The potential drawbacks of BI dashboards don't necessarily result from the design of the software, but rather from how businesses use dashboards and the cost of creating, implementing and maintaining them. In many enterprises, BI and IT professionals still design and update dashboards for users. They're also responsible for documenting dashboards and tracking their usage.
Other challenges that organizations face in building effective dashboards include the following:
- Having overly flashy or cluttered designs that make dashboards hard to use.
- Embedding too much visual information and not constraining the associated raw data to what's needed.
- Failing to provide context to make it clear how KPIs and other data are relevant to end users.
- Not making it easy to create drill-down paths to plumb the data underlying surface metrics.
- Misrepresenting data in dashboards or leaving out relevant data, leading to inaccurate analytics.
BI dashboard design best practices
A good dashboard design presents business insights derived from data in a way that's easy to understand. In a well-designed dashboard, the different components seamlessly mesh with one another to provide views of the data that give users actionable insights for data-driven decisions and operational tasks. These dashboards also let users drill down to see more granular data if needed.
In general, dashboard design best practices include the following:
- Involve end users in the BI dashboard design process.
- Use an iterative approach to refine designs during development.
- Precisely identify the data that the intended users need to track.
- Let different departments or parts of an enterprise customize dashboards.
- Don't overdo the amount of information presented to users.
- Keep the data in BI dashboards up to date.
- Assess user experience issues with upfront testing to identify any problems.
Some consultants recommend that BI and analytics teams adopt a methodology similar to the software development lifecycle for designing dashboards. Doing so formalizes project management steps on BI dashboard design, from identifying business requirements for dashboards to assessing data quality, creating and testing initial designs, modifying them as needed and documenting finished dashboards.
BI dashboard examples and use cases
Organizations deploy a variety of operational and analytical dashboards to support decision-makers at all levels in an enterprise. The following are common types of BI dashboards designed for various functions.
Sales and marketing dashboards
Business executives, managers, and sales and marketing teams use this type of dashboard. A sales dashboard includes data on products or retail sales, the cost of sales operations and other KPIs. It helps users track progress toward sales goals and identify potential trouble spots. Similarly, a marketing dashboard contains data on costs, response rates, lead generation and other marketing metrics.
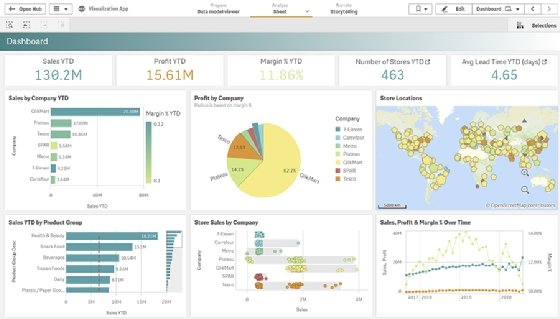
Sales dashboards, like this one from Qlik, show data on product and retail sales, plus other sales-related metrics.
Customer dashboards
A customer dashboard lets users view and analyze data about an organization's customer base, including its size, churn and retention rates, revenue per customer, lifetime value and other customer metrics used to help plan marketing campaigns and sales efforts.
A customer dashboard displays data about a company's customers, as seen here in an interactive format from Google's Looker tool.
Financial dashboards
This type of dashboard displays data on financial KPIs for the chief financial officer, other managers and employees in the finance department. The metrics in a financial dashboard range from revenue, operating expenses and profits to cash holdings, assets and liabilities. They help organizations monitor business performance and do financial planning and analysis.
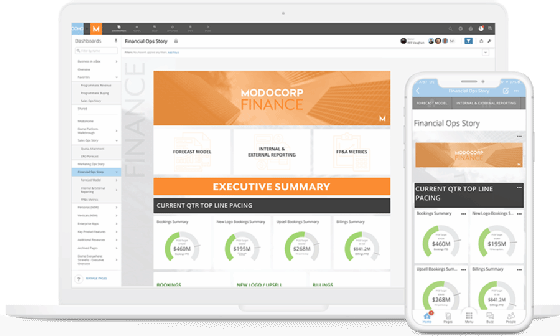
Financial dashboards include various finance-related metrics like these desktop and mobile views of the Domo dashboard.
Human resources dashboards
A human resources dashboard provides HR managers and business executives with relevant information on an organization's workforce. That includes basic workforce data -- such as the number of employees, salary statistics and demographics -- as well as hiring and recruiting metrics and KPIs on areas such as employee satisfaction, turnover and costs. This data is used to assist with talent management and employee experience initiatives.
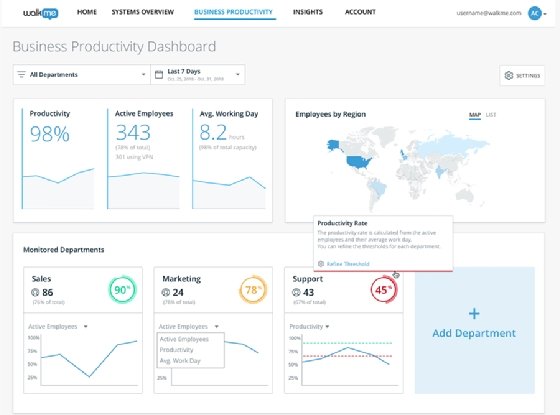
HR dashboards offer a mix of workforce and employee experience data. This one from WalkMe shows productivity metrics.
Operational dashboards
These dashboards track the status of operations, business processes and equipment on an ongoing basis for day-to-day monitoring and management. For example, an operational dashboard might show metrics on the output of manufacturing machines to help plant managers ensure that production goals are met, identify potential problems and optimize production processes.
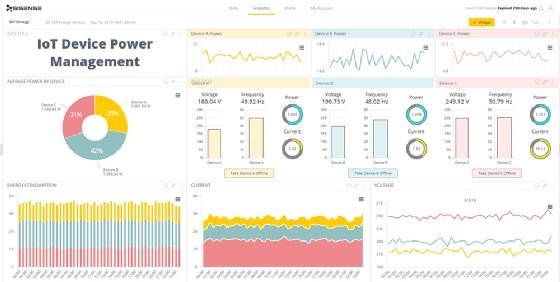
Operational dashboards contain data on business operations and processes. This example from Sisense shows IoT devices' power use.
IT dashboards
IT departments are big users of dashboards, along with BI, data management, data warehousing and data science teams. IT dashboards track metrics on various aspects of IT operations, including the use of networks, systems, databases and applications; available IT resources; performance problems; security issues; and technology costs.
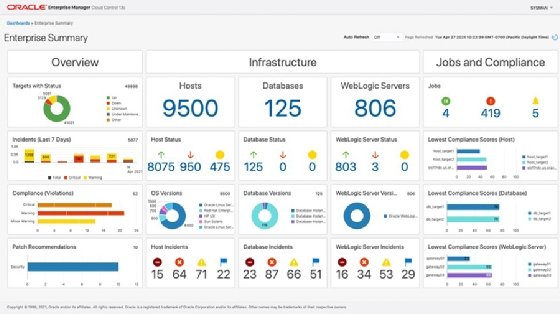
IT dashboards, like this Oracle example, show data on technology use and other IT metrics, such as database and server performance and compliance.
Project dashboards
A project or project management dashboard displays data on the status and progress of business efforts. Project managers use them to track tasks, deadlines, costs and other parameters that aid in monitoring work, spotting problems and keeping projects on schedule and budget.
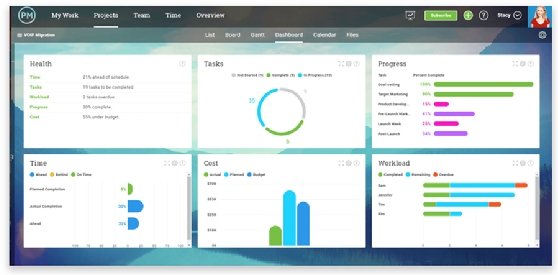
A project dashboard provides real-time metrics on projects so project managers can track their status, like this one from Projectmanager.com.
Mobile dashboards
This isn't an entirely separate dashboard category; many BI dashboards are designed for both PCs and mobile devices. However, dashboard designers looking to support mobile BI users must ensure that dashboards display in a readable way on smartphones and tablets. As a result, mobile dashboards are often relatively simple, with a few data visualizations that are easily viewed on a small screen.
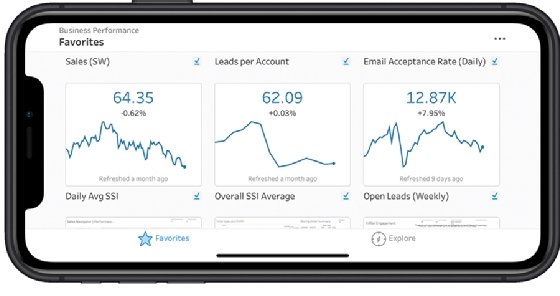
Mobile dashboards display data in a format suitable for mobile devices, such as this one from Tableau showing sales KPIs.
BI dashboards vs. BI reports
BI dashboards and BI reports appear to serve a similar purpose, but they serve different purposes. These distinctions include the following:
- Use cases. Businesses typically give employees access to BI dashboards with the metrics and insights they need as part of their work. However, BI reports are better suited for data scientists and other experts who perform detailed analyses and extrapolate more information from closer scrutiny.
- Size or length. A dashboard is normally built to have its metrics, widgets and other elements fit within a single webpage or mobile screen. A report might cover several or many pages because data is often presented in spreadsheets, and more space is needed for detailed visualizations.
- Depth. A glance at a business dashboard is often all that's needed for certain tasks, such as monitoring for changes in a metric. A report usually goes more in-depth, presenting complexities that a dashboard can't show in a single webpage or screen.
- Updates. Real-time data is easily monitored using dashboards. For example, the data transmitted from an IoT device measuring water quality or air temperature fluctuates constantly, and dashboards are ideal for keeping tabs on such data. Reports focus on past data and must be updated every so often.
- Filtering for specificity. Dashboards usually don't have filtering capabilities that let users focus on specific data, but reports are ideal for filtering complex data so certain elements or insights can be focused on.
- Alerts and notifications. Alerts are sent from interactive dashboards to a user's email address when a metric crosses a specific threshold. Reports aren't meant to send alerts or notifications. They require readers to determine the best courses of action for themselves.
BI dashboard vendors and products
Major vendors of analytics and BI platforms offer BI dashboards and dashboard design tools as part of their product lineups. Gartner's Magic Quadrant for Analytics and Business Intelligence Platforms lists the following vendors: Alibaba Cloud, Amazon Web Services, Domo, GoodData, Google, IBM, Incorta, Microsoft, MicroStrategy, Oracle, Pyramid Analytics, Qlik, Salesforce, SAP, SAS, Sisense, Spotfire, Tellius, ThoughtSpot and Zoho.
BI dashboards are available that pull data on KPIs from operational databases, business applications, web analytics tools and other sources, often without the need to do any coding. Other types of dashboards are embedded in business applications, such as financial, HR and project management software. This approach lets business users view KPIs and analyze data in the same application they use to do their job, without having to switch to a separate BI or reporting tool.
BI offerings often support multiple levels of product licensing. Some users in an organization get a license that lets them create a BI dashboard and publish and share it, while others have a less expensive view-only license that doesn't include data analysis and dashboard design capabilities.
History and evolution of BI dashboards
The first BI dashboards were created in the 1970s as part of business decision support systems, which were forerunners of modern BI tools. Early dashboards typically were static and included simple charts and graphics with dials and indicators similar to the ones on car dashboards to show the status of operational KPIs.
Dashboards were a core feature in executive information systems, a more advanced data analysis and reporting technology developed in the 1980s. Executive info systems were commonly called executive dashboards, a term that's still used to refer to BI dashboards built for CEOs and other C-suite executives.
In the 1990s, dashboards evolved into more functional and broadly useful tools with the emergence of BI software, data warehouses and online analytical processing engines. Those tools expanded the types of data analytics applications that organizations could deploy.
The introduction of self-service BI and data visualization tools in the mid-2000s accelerated the evolution of interactive dashboards. Self-service and visualization tools let end users design and publish their own BI dashboards.
By the end of the 2010s, AI features were added to some BI products. For example, Microsoft's Power BI introduced AI features in 2019 to extract insights from text and image data. Since then, additional AI capabilities, such as automated data preparation and cleansing, have been incorporated into other offerings.
The role of AI in modern BI dashboards
AI tools are costly to implement and maintain so not every BI platform vendor is implementing them in their dashboards just yet. Where AI is being used, enhancements and capabilities include automating dashboard creation, customization and data preparation, as well as analyzing data and forecasting future trends.
For example, to create a dashboard tailored to a user's needs, an AI-powered algorithm analyzes the data set the employee uses and suggests which visualization style, metrics and KPIs best display that specific data set. These algorithms even understand the most relevant metrics for users based on their job titles and responsibilities.
AI can automate tasks BI experts would otherwise have to perform manually, such as data preparation and cleansing. Afterward, algorithms analyze prepared data sets, discovering trends and insights to make predictions. This lets a business make better decisions. For instance, AI insights about customers' buying habits in the print-on-demand market help a business forecast the products and designs that are likely to be popular in the near future.
Businesses often consider business intelligence a collaborative effort. Learn how social BI enables users to interact with their organization's data.
This was last updated in October 2024
Continue Reading About What is a business intelligence dashboard (BI dashboard)?
- Understand the BI lifecycle to build and effective architecture
- Benefits cloud BI has over on-premises options
- BI adoption poised to break through barrier -- finally
- Key features of embedded analytics software
- How to use Microsoft Copilot in Power BI
 What is business intelligence (BI)? A detailed guide
  By: Craig Stedman
  20 top business intelligence tools to know about in 2025
  By: Donald Farmer
  Top 12 business intelligence challenges to manage
  By: George Lawton
  9 examples of business intelligence use cases for companies
  By: Mary Pratt