customer satisfaction (CSAT) (original) (raw)
Customer satisfaction (CSAT) is a measure of the degree to which a product or service meets customer expectations. It's usually part of an organization's broader customer relationship management efforts.
Information about customer satisfaction is often obtained through customer surveys in which consumers who bought a product or service self-report their level of satisfaction. Typically, customers will be asked to assess their satisfaction on a 1-5 or 1-10 scale where one is "very dissatisfied" and the highest number is "very satisfied." They also are usually given an option to add a written comment or leave a voice message comment.
Customer satisfaction as measured by the CSAT metric is an important indicator of a business's health. Other measures, such as customer health score (CHS), use information from various customer touchpoints to assess how satisfied customers are with a business's products or services.
Why is customer satisfaction important?
The CSAT metric is important because it helps businesses assess how well their product or overall customer experience is being received by customers. CSAT survey data provides insight into what's working well, what isn't and what customers think of a specific change.
Because CSAT is measured in a gradient or scale, as opposed to a simple yes or no response, subtle changes in satisfaction levels -- such as "satisfied" versus "very satisfied" -- can be detected. Open-ended, short answer CSAT questions can also point businesses to specific problem areas.
In terms of the inherent customer satisfaction that the CSAT metric captures, the business value of satisfied customers is well documented:
- Loyalty and churn. Having satisfied customers creates customer loyalty and prevents customer churn. Having many one-time customers is typically more expensive than having a consistent base of happy customers, after factoring in marketing, sales and advertising costs required for customer acquisition.
- Brand reputation. The overall satisfaction of customers is particularly important for growing companies. For smaller businesses scaling up, satisfaction levels of current and previous customers can be formative factors for brand and reputation moving forward. Unhappy customers are very likely to be outspoken about their dissatisfaction.
- Product reputation. Overall customer satisfaction can also be a critical point of value in a product or service offering.
How to measure customer satisfaction scores
Customer satisfaction surveys are distributed using communication channels such as email, social media, a post-purchase pop-up screen, phone call and in-app survey. Typically, a customer satisfaction survey will include the following two elements:
- A rating scale for each customer to self-report their satisfaction levels. Units on the scale might be quantitative, representing satisfaction levels with numeric scales (1-10 in satisfaction, or willingness to recommend to a friend), or qualitative. A common qualitative scale will range from "neutral" to "(dis)satisfied" and "very (dis)satisfied." Customers might be asked to report their satisfaction scores for multiple criteria or points in the customer journey.
- A short response prompt. This prompt, often optional, is for specific voice of the customer feedback or comments.
The results of the customer survey are used to calculate a CSAT score, which is most often expressed as a percentage. When calculating CSAT scores, the number of customers with positive responses such as "satisfied" or "very satisfied" -- or the comparable numeric values -- would first be added together. The sum of those responses would then be divided by the total number of survey responses and then multiplied by 100 to be expressed as a percentage.
Customer satisfaction = (number of satisfied and very satisfied customers ÷ total number of responses) x 100%
Other customer satisfaction metrics
Along with CSAT, there are other metrics to provide insights into customer satisfaction, such as the following:
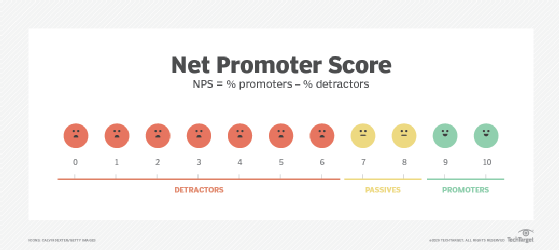
- Net promoter score (NPS). Customers are asked to select a number on a scale ranging from 0-10 that represents their willingness to recommend a product or service to others. Customers who fall in the 0-6 range are considered "detractors," the 7-8 range are "passives" and those in the 9-10 range are "promoters." The final NPS value is then calculated by taking the percent of detractors, and subtracting it from the percent of promoters.

A Net Promoter Score conveys how likely customers are to recommend a company to others.
- Customer acquisition cost ( CAC). CACmeasures the average marketing and sales costs for the business to acquire new customers and maintain existing customers. A high CAC number can indicate customer churn as a result of displeasure. CAC is measured by taking the sum of all sales, marketing and advertising costs, and dividing it by the number of existing customers.
Customer acquisition cost = (sales, marketing, advertising costs ÷ number of customers)
- Customer effort score ( CES). This score uses a scale from "strongly disagree" to "strongly agree" for customers to self-report their answers to the question: "Did the company make it easy for you to handle your issue or get what you want?" Typically, CESsurveys are deployed immediately after a customer's interaction with a service representative, or after a specific interaction with a product or service.
- Customer churn rate (CCR). This measures the customers lost over a certain period. To calculate CCR, the time period to be measured must be determined. CCR is calculated by dividing the number of lost customers by the number of acquired customers in a time period, and then multiplying that number by 100 to be expressed as a percentage.
Customer churn rate = (lost customers ÷ acquired customers) x 100%
- Customer retention rate (CRR). The customer retention metric is the opposite of the churn rate. It measures the number of customers that have been maintained over a period. To calculate the CRR, a time period is defined. Then, the number of new customers from that period is subtracted from the number of customers at the end of the period. That number is divided by the total number of customers at the start of the period. The result is multiplied by 100 to be expressed as a percentage.
Customer retention rate = ((number of customers at end of period - number of new customers during the period) ÷ number of customers at start of period) x 100%
- Customer health score. The CHS score factors in several types of consumer behavior measurements to determine how likely a customer is to leave. The term is subjective, as specific algorithms will vary among different types of products and businesses. CHS considers measures such as how long customers use a product, upsells, number of website visits, free versus premium service use and sum of all purchases.
How do you achieve high customer satisfaction scores?
Common ways of achieving high levels of customer service include the following:
- Using customer feedback to find the pain points and problems in the customer journey.
- Attempting to convert dissatisfied customers into satisfied customers.
- Identifying specific drivers of customer satisfaction for the business with the help of business intelligence tools. These drivers may vary considerably across businesses and products.
- Focusing on the improvement of employee experience and satisfaction, and how they affect customer satisfaction.
- Implementing a social media plan that provides multichannel support and prevents the spread of negative reviews.
- Offering swift, proactive customer support that provides short wait and first response times.
- Increasing the number of communication channels between the business and customers can lead to better customer service scores.
Potential downsides to CSAT metrics and surveys
While CSAT methods are more effective than not at identifying potential improvements for a business, there are downsides. Businesses might be able to address some of these issues with more creative ways of engaging with customers or more comprehensive metrics and surveys. However, others are out of their control.
Potential downsides that come with CSAT practices include the following:
- Susceptibility to bias. Customers who feel neutral towards their experiences might be less likely to leave reviews. Customers who feel strongly about an interaction, a products design or even its pricing, are more likely to leave reviews, particularly strongly worded ones. Someone's personal life experiences or agenda might also influence their feedback in a CSAT survey.
- Short-sightedness. CSAT survey questions often capture customer sentiment in a myopic way. They show how a customer feels at the time the survey was taken. Considering the possibility that feelings could drastically change over time, businesses that request feedback once without follow-up risk ending up with short-sighted customer insights. Many CSAT surveys also lack the detail and granularity needed to truly gauge respondents' feelings and their likelihood to engage with a company in the future.
- Customers ignoring the survey. A low response rate for a CSAT survey means customers aren't filling it out for reasons, such as busy schedules and lack of motivation. This means the results might be inaccurate in capturing overall customer satisfaction because many people aren't participating.
Example of a CSAT survey
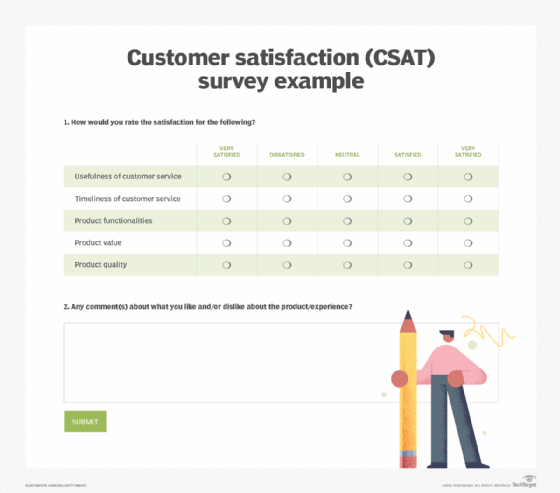
Most customer satisfaction surveys follow the same general format: They have a scale for customers to rate their satisfaction with a product or service, as well as an optional text field for customers to leave comments and feedback. Often, there are multiple criteria for customers to rank their satisfaction.
Businesses typically use survey templates for this, like the one shown below.

A customer satisfaction survey solicits feedback from customers on a recent product they've purchased or experience they've had with a business or other organization.
An important next step for companies that have obtained insights from CSAT surveys is to determine which ones are actionable and which ones aren't. Read about how to turn customer feedback into actionable insights.
This was last updated in August 2023