table (original) (raw)
What is a table?
A table in computer programming is a data structure used to organize information, just as it is on paper. There are many different types of computer-related tables that work in a number of different ways. Which type of table is used depends on the type of data being compiled and what type of analysis is needed.
Types of tables
The following are among the different types of data tables:
Data processing. In data processing, a computer table is also called an array and is an organized grouping of fields. Tables can store permanent data or be updated frequently. For example, a table contained in a disk volume is updated when sectors are written. Arrangement of information is a key function of a table.
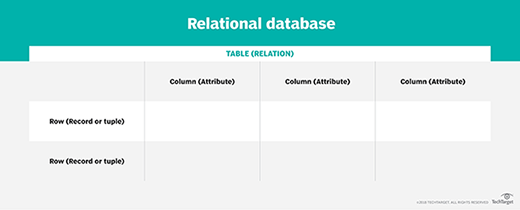
Relational database. In a relational database, a table is sometimes called a file. It organizes information about a single topic into rows and columns. For example, businesses typically maintain relational databases with customer information in a series of columns with column names, such as account numbers, addresses and phone numbers. Each piece of data is a field in the table. A column consists of all the entries for a single field, such as the telephone numbers of all the customers. Different fields are organized as records, which are complete sets of information -- such as all the information about a particular customer -- each of which comprises a row. The process of normalization determines the most effective way to organize data into tables.

Tables with rows and columns are a key part of a relational database.
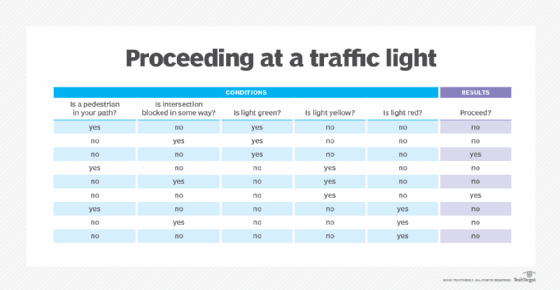
Decision. A decision table is often called a truth table, which can be computer generated or drawn on paper. Decision tables contain a list of decisions and the criteria on which they are based. All possible situations for decisions are listed, and the action to take in each situation specified. For example, at a traffic intersection, the decision to proceed might be expressed as yes or no, and the criteria might be the light is green or the light is red, respectively. A decision table can be incorporated into a computer program to direct its processing according to decisions made in different situations. Changes to the decision table are reflected in the program.

Decision tables contain a list of decisions that must be made in certain scenarios and the criteria that must be considered in making them.
Hypertext Markup Language (HTML). An HTML table is used to organize webpage elements spatially or to create a structure for data that is best displayed in tabular form, such as lists or specifications.
Example of tables
Some tables are text-based, such as the following one:
| Last name | First name | Department |
|---|---|---|
| Smith | David | Accounting |
| Miller | Susan | IT |
| Andrews | Richard | Operations |
| Mitchell | Robert | Legal |
Other tables are a mix of text and numbers, such as this one where the data is all numerical:
| Q1 revenue | Q2 revenue | Q3 revenue | Q4 revenue | Year-end total | |
|---|---|---|---|---|---|
| Product A | 255,750 | 265,500 | 278,500 | 285,600 | 1,085,350 |
| Product B | 126,600 | 177,000 | 165,650 | 169,500 | 638,750 |
| Service A | 95,600 | 98,500 | 87,550 | 88,600 | 370,250 |
| Totals by quarter | 477,950 | 541,000 | 531,700 | 543,700 | 2,094,350 |
Who uses tables and why?
Tables are used by anyone who needs to organize or analyze data in a structured way. In business settings, various professionals use tables, including the following:
- financial analysts
- project managers
- computer science analysts
- consultants
- market researchers
- human resources professionals
- engineers
- risk managers
- data analysts
- scientists
- medical professionals
- actuaries
Tables help organize and present data in a format that can be easier for humans and computers to understand than bulleted lists, descriptive text or other ways of communicating information. The value of a table is often correlated to the amount of data it contains. In other words, as the volume of data grows, the ability to consume it in a structured, manipulatable format becomes increasingly useful.
Tables are useful for analytical activities where a considerable amount of information must be analyzed according to set parameters. Spreadsheet applications, such as Microsoft Excel, can perform these actions fast, accurately and in large batches -- saving time and reducing errors.
Tables can be used to reorganize data according to various parameters, such as the date of creation and values in ascending or descending order. This type of data analysis can be used to identify trends, historical factors and levels of importance.
The following are examples of how tables are used:
- Compound growth rate. A table can be used to calculate the compound annual growth rate of an enterprise's sales revenue over a period of time.
- Alphabetical lists. Tables are useful when a large quantity of text data, such as lists of names, must be sorted in alphabetical order.
Excel is the prevailing spreadsheet application for personal and business use. However, there are alternatives, including Google Sheets and LibreOffice.
Pivot tables and how they can be used
A pivot table is a tool in spreadsheet programs that simplifies the process of analyzing hundreds or even thousands of data in table rows.
With just a few clicks, different fields of data can be rearranged and then analyzed to uncover new trends and patterns without modifying the source table itself. Pivot table tools can generate reports that can be easily modified by simply dragging fields to alternate locations as a way to highlight different types of data for analysis.
See how to use a no-code application program interface, or API, to simplify spreadsheet analysis at scale.
This was last updated in September 2022