Print Has Prevailed: The Staying Power of Physical Books (original) (raw)
The Briefing
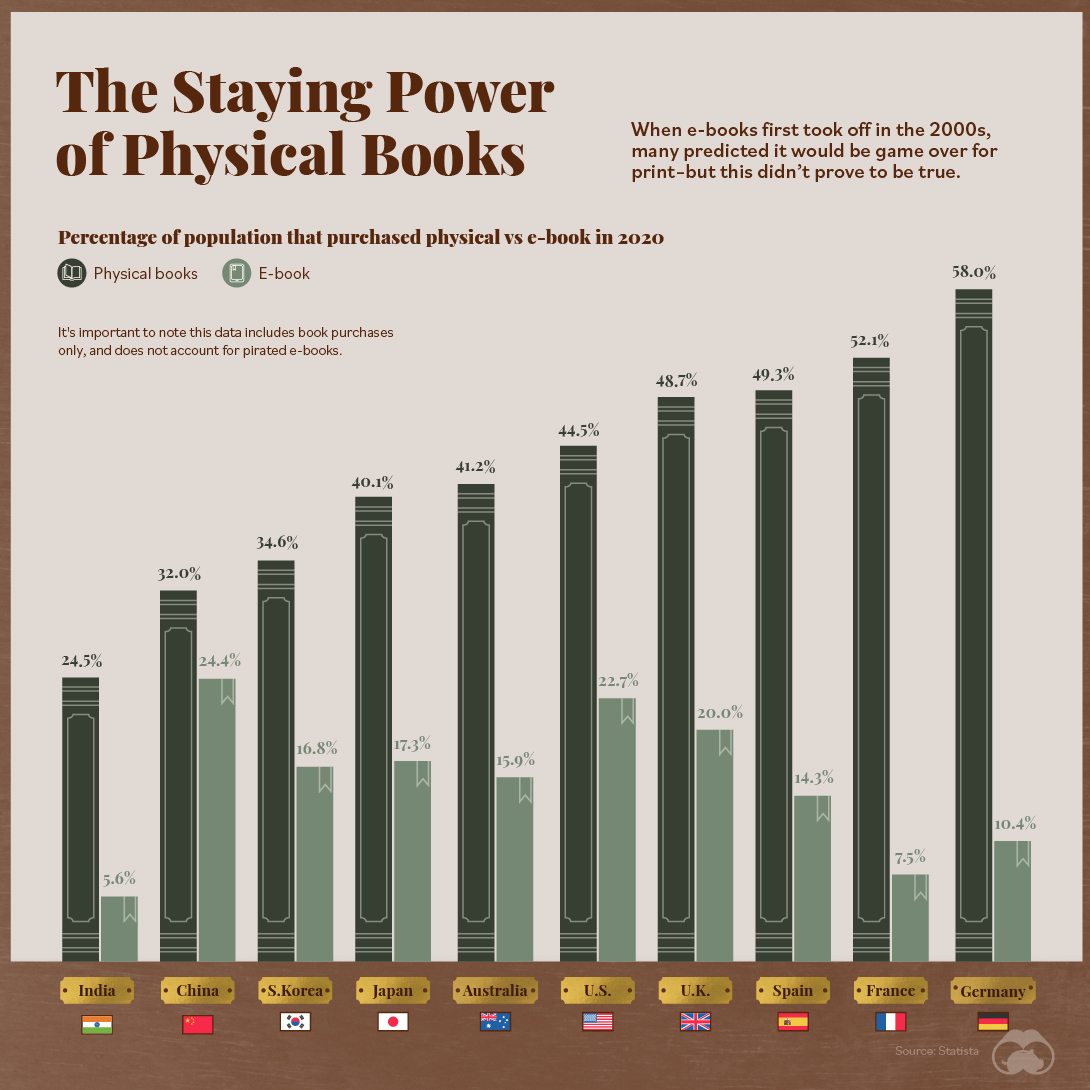
- Survey data from 10 different countries shows that a majority of people still prefer print books over e-books.
- 42.5% of respondents purchased at least one print book in 2020—that’s significantly more than the 15.5% who’d bought at least one e-book.
- Out of the 10 countries surveyed, Germany has the most print book lovers. 58% of German respondents bought a print book in 2020.
The Staying Power of Print Books
E-books are certainly not a new phenomenon. In fact, they’ve been around longer than the internet.
Yet, while the emergence of e-books dates back to the early 1970s, they didn’t hit the mainstream until the 2000s, when big companies began launching their own e-book readers, and digital libraries started to become more accessible to the public.
Around this time, sales for e-books started to soar, and by 2013, e-book sales made up 20% of all books sales in America. Many wondered if this was the end for print books.
But fast forward to 2021, and e-books haven’t made print books obsolete. At least, not yet.
E-book versus Print Book Purchases
A recent poll found that people still favor print books over e-books, at least when it comes to their purchasing behavior.
Of the 10 countries included in the survey, an estimated 42% of people had purchased at least one print book in 2020, while only 15.5% had bought an e-book that same year.
Here’s a look at all 10 countries, and the estimated share of their population who bought physical versus e-books in 2020:
| Country | Physical Books | E-books |
|---|---|---|
| 🇨🇳 China | 32.0% | 24.4% |
| 🇺🇸 United States | 44.5% | 22.7% |
| 🇬🇧 United Kingdom | 48.7% | 20.0% |
| 🇯🇵 Japan | 40.1% | 17.3% |
| 🇰🇷 South Korea | 34.6% | 16.8% |
| 🇦🇺 Australia | 41.2% | 15.9% |
| 🇪🇸 Spain | 49.3% | 14.3% |
| 🇩🇪 Germany | 58.0% | 10.4% |
| 🇫🇷 France | 52.1% | 7.5% |
| 🇮🇳 India | 24.5% | 5.6% |
| Average | 42.5% | 15.5% |
China had the highest portion of e-book lovers—an estimated 24.4% of its population purchased an e-book in 2020, which is more than 8 percentage points higher than the average across the whole list.
On the other end of the spectrum, e-books are least popular in India, where an estimated 5.6% of the country’s population purchased an e-book in 2020. Keep in mind, the country has a lower percentage of book purchasers in general.
Why Print Has Prevailed
Why are print books still more popular than e-books? There are many theories. One study suggests that readers retain information better from a print book versus an e-book, while other consumer surveys found that e-books haven’t yet managed to fully simulate the tactile experience of a print book.
However, while e-books might not eradicate print books entirely, the market for digital books is expected to grow in the near future. By 2025, global revenue from e-books could reach $18.4 billion, with 1.2 billion users across the globe.
Where does this data come from?
Source: Statista
UK Only
Charting the Rise of Cross-Border Money Transfers (2015-2023)
With over 280 million immigrants transferring billions of dollars annually, the remittance industry has become more valuable than ever.
![]()

Published
3 years ago
on
June 21, 2023
![]()
The Briefing
- 79% of remittance payments in 2022 were made to low and middle-income countries.
- Borderless, low-cost money transfer services like those provided by Wise can help immigrants support their families.
The Rise of Cross-Border Money Transfers
The remittance industry has experienced consistent growth recently, solidifying its position as a key component of the global financial landscape. Defined as the transfer of money from one country to another, usually to support a dependent, remittances play a pivotal role in providing food, healthcare, and education.
In this graphic, sponsored by Scottish Mortgage, we delve into the growth of the remittance industry, and the key factors propelling its success.
Powered by Immigration
With over 280 million immigrants worldwide, the remittance industry has an important place in our global society.
By exporting billions of dollars annually back to their starting nations, immigrants can greatly improve the livelihoods of their families and communities.
This is particularly true for low and middle-income countries, who in 2022 received, on average, 79% of remittance payments, according to Knomad, an initiative of the World Bank.
| Year | Low/Middle Income (US$ Billion) | World Total (US$ Billion) |
|---|---|---|
| 2015 | 447B∣447B | 447B∣602B |
| 2016 | 440B∣440B | 440B∣596B |
| 2017 | 477B∣477B | 477B∣638B |
| 2018 | 524B∣524B | 524B∣694B |
| 2019 | 546B∣546B | 546B∣722B |
| 2020 | 542B∣542B | 542B∣711B |
| 2021 | 597B∣597B | 597B∣781B |
| 2022 | 626B∣626B | 626B∣794B |
| 2023 | 639B∣639B | 639B∣815B |
India is one of the global leaders in receiving remittance payments. In 2022 alone, over $100 billion in remittances were sent to India, supporting many families.
Enter Wise
As the global remittance industry continues to grow, it is important to acknowledge the role played by innovative money transfer operators like Wise.
With an inclusive, user-centric platform and competitive exchange rates, Wise makes it easy and cost-effective for millions of individuals to send money home, worldwide.
Connection Without Borders
But Wise doesn’t just offer remittance solutions, the company offers a host of account services and a payment infrastructure that has helped over 6.1 million active customers move over $30 billion in the first quarter of 2023 alone.
Want to invest in transformative companies like Wise?
Discover Scottish Mortgage Investment Trust, a portfolio of some of the world’s most exciting growth companies.
![]()
Datastream
Can You Calculate Your Daily Carbon Footprint?
Discover how the average person’s carbon footprint impacts the environment and learn how carbon credits can offset your carbon footprint.

Published
3 years ago
on
June 20, 2023

The Briefing
- A person’s carbon footprint is substantial, with activities such as food consumption creating as much as 4,500 g of CO₂ emissions daily.
- By purchasing carbon credits from Carbon Streaming Corporation, you can offset your own emissions and fund positive climate action.
Your Everyday Carbon Footprint
While many large businesses and countries have committed to net-zero goals, it is essential to acknowledge that your everyday activities also contribute to global emissions.
In this graphic, sponsored by Carbon Streaming Corporation, we will explore how the choices we make and the products we use have a profound impact on our carbon footprint.
Carbon Emissions by Activity
Here are some of the daily activities and products of the average person and their carbon footprint, according to Clever Carbon.
| Household Activities & Products | CO2 Emissions (g) |
|---|---|
| 💡 Standard Light Bulb (100 watts, four hours) | 172 g |
| 📱 Mobile Phone Use (195 minutes per day)* | 189 g |
| 👕 Washing Machine (0.63 kWh) | 275 g |
| 🔥 Electric Oven (1.56 kWh) | 675 g |
| ♨️ Tumble Dryer (2.5 kWh) | 1,000 g |
| 🧻 Toilet Roll (2 ply) | 1,300 g |
| 🚿 Hot Shower (10 mins) | 2,000 g |
| 🚙 Daily Commute (one hour, by car) | 3,360 g |
| 🍽️ Average Daily Food Consumption (three meals of 600 calories) | 4,500 g |
| *Phone use based on yearly use of 69kg per the source, Reboxed |
Your choice of transportation plays a crucial role in determining your carbon footprint. For instance, a 15 km daily commute to work on public transport generates an average of 1,464 g of CO₂ emissions. Compared to 3,360 g—twice the volume for a journey the same length by car.
By opting for more sustainable modes of transport, such as cycling, walking, or public transportation, you can significantly reduce your carbon footprint.
Addressing Your Carbon Footprint
One way to compensate for your emissions is by purchasing high-quality carbon credits.
Carbon credits are used to help fund projects that avoid, reduce or remove CO₂ emissions. This includes nature-based solutions such as reforestation and improved forest management, or technology-based solutions such as the production of biochar and carbon capture and storage (CCS).
While carbon credits offer a potential solution for individuals to help reduce global emissions, public awareness remains a significant challenge. A BCG-Patch survey revealed that only 34% of U.S. consumers are familiar with carbon credits, and only 3% have purchased them in the past.
About Carbon Streaming
By financing the creation or expansion of carbon projects, Carbon Streaming Corporation secures the rights to future carbon credits generated by these sustainable projects. You can then purchase these carbon credits to help fund climate solutions around the world and compensate for your own emissions.
Ready to get involved?
>> Learn more about purchasing carbon credits at Carbon Streaming