BCG Matrix: A Strategic Framework for Resource Allocation (original) (raw)
Every leadership team faces the same fundamental question: where do we concentrate resources to generate the best return? In a business with multiple products, divisions, or service lines, that question gets harder because there are too many competing claims on the same pool of capital and management attention.
The BCG Matrix cuts through that complexity. Developed by Bruce Henderson of the Boston Consulting Group in the 1970s, this strategic framework categorizes your portfolio across two dimensions: market share and market growth rate. Based on these dimensions, it produces a clear, visual framework for making capital allocation decisions.
Not every business unit deserves the same investment. The BCG Matrix is how you make that argument with data rather than politics.
The four quadrants and what they mean for resource allocation
The matrix sits on two axes: relative market share (your position versus competitors) and market growth rate (how fast the overall market is expanding). The intersection of these two variables produces four quadrants, each with a distinct strategic implication.
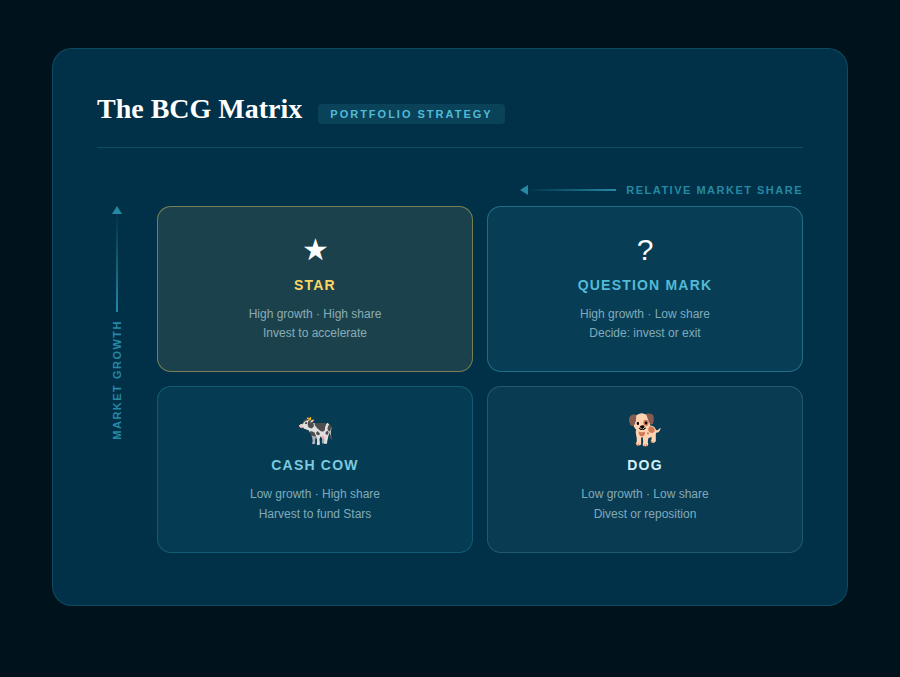
Stars: high market share, high growth
Your best current businesses (competitive leaders in expanding markets). Stars require significant ongoing investment to defend and extend their position as the market grows. Underfund them and competitors gain ground.
Cash Cows: high market share, low growth
Mature businesses with established competitive positions in slower-growing markets. Cash cows generate more profit than they need to maintain their position. That makes them the engine that funds everything else.
Manage them for efficiency. Extract margin. Use the cash to invest in stars and selected question marks.
Question Marks: low market share, high growth
High-growth markets where you haven't yet established competitive strength. These are the most strategically demanding quadrant where potential, uncertainty and capital requirement are high. The decision is binary: invest to win market share, or exit before the market matures and takes you with it as a dog.
Dogs: low market share, low growth
Businesses in slow-growing markets where you're not the competitive leader. Dogs rarely generate enough return to justify the management attention they consume. The typical strategic response is divestment or active cost reduction, freeing up resources for the quadrants that can actually compound.
When the BCG Matrix is the right tool
The BCG Matrix is most valuable when you're making explicit portfolio-level capital allocation decisions.
Use it when your organization manages multiple business units or product lines and needs a shared framework for comparing them against each other.
Use it when resource constraints are real and leadership needs a defensible basis for deciding which businesses get more capital and which get less.
Use it when strategic planning cycles demand prioritization (annual budgeting, portfolio reviews, M&A evaluation) and the conversation needs to be grounded in market position and growth dynamics rather than historical budget shares.
And use it when a business unit is underperforming and leadership needs to determine whether the path forward is investment, harvest, or exit.
In practice: Siemens Energy's portfolio reshaping
When Siemens Energy split from Siemens AG in the early 2020s, it inherited a classic BCG portfolio problem: a mix of high-growth renewables businesses that needed capital, legacy gas-turbine assets generating substantial cash, early-stage digital platforms with uncertain futures, and conventional power assets in structural decline.
The BCG Matrix is exactly how that capital allocation conversation gets resolved.
Stars
Siemens Energy's renewables and grid-integration portfolio (offshore wind, grid-stabilization systems, digital-grid management) sits squarely in the stars quadrant. The market is growing at double-digit annual rates driven by decarbonization investment. Siemens Energy is investing heavily in manufacturing capacity and strategic partnerships to entrench its position before the market consolidates.
Underfund it now and competitors gain ground that's expensive to recover.
Cash cow
The cash cow is the legacy gas-turbine installed base. These assets generate high-margin, recurring revenue through maintenance contracts, spare parts, and long-term service agreements... even as the market itself matures.
Leadership runs this segment with disciplined capital expenditure and high-efficiency operations. The surplus funds everything else.
Question mark
The question mark is Siemens Energy's digital-twin and AI-driven energy-management platform. These are early-stage offerings in a fast-growing industrial digitalization market, competing against purpose-built software vendors with significant head starts. The decision is time-boxed: invest now to embed these tools into the existing installed base of power plants and industrial customers, or fall behind and exit.
Siemens Energy frames it as a multi-year bet with clear thresholds for adoption and ROI before full-scale commitment.
Dogs
The dogs are older conventional-power and legacy infrastructure assets in markets with low or negative growth, no competitive leadership position, and no credible path to margin improvement. The strategy is harvest (limit new capital, run off existing contracts) or prepare for divestment. Management attention belongs elsewhere.
The result is the same outcome the BCG Matrix is designed to produce: leadership stopped defending historical business-unit budgets and started asking which quadrant each business sits in and what that means for capital allocation. Cash-cow profits were consciously redirected to scale renewables, fund digital capability, and maintain a disciplined exit plan for the dogs. Explicit choices about where growth will come from and how today's cash-generating businesses fund the bets that define the company's position in a decade.
How to use the BCG Matrix
1. Gather and plot the data
For each business unit or product line, establish two data points: relative market share (your share compared to the largest competitor in the market) and market growth rate. Plot each business on the matrix. The visual distribution is often the most revealing part of the exercise.
Organizations are frequently surprised by how many resources are concentrated in dogs and how little is going to stars.
2. Assess strategic position honestly
The matrix is only as useful as the data behind it and the objectivity of the assessment. Question marks in particular require honest evaluation:
- Is the market growing fast enough to justify the investment required to win share?
- Does the organization have the capability to compete against established players?
The instinct is to preserve what exists. The discipline is to assess what's worth building.
3. Translate quadrant position into resource decisions
Each quadrant implies a different investment posture: invest and grow (stars), maximize cash extraction (cash cows), invest selectively or exit (question marks), divest or harvest (dogs). These decisions should flow directly into budget allocations, OKR priorities, and the operating commitments teams are held accountable for delivering.