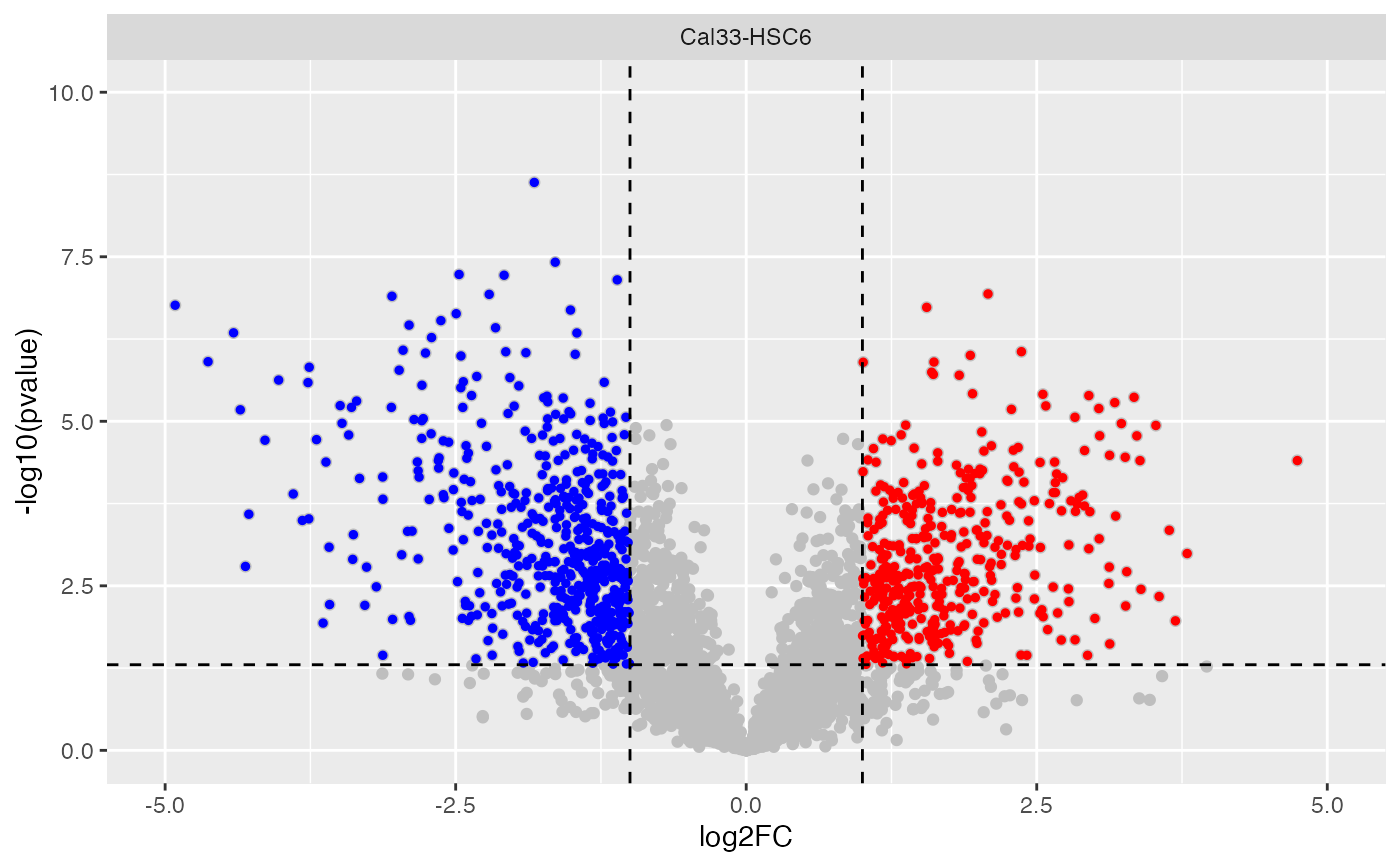
Volcano plot (log2fc / pvalues) — artmsVolcanoPlot (original) (raw)
It generates a scatter-plot used to quickly identify changes
artmsVolcanoPlot( mss_results, output_name = "volcano_plot.pdf", lfc_upper = 1, lfc_lower = -1, whatPvalue = "adj.pvalue", FDR = 0.05, PDF = TRUE, decimal_threshold = 16, verbose = TRUE )
Arguments
| mss_results | (data.frame or file) Selected MSstats results |
|---|---|
| output_name | (char) Name for the output file (don't forget the .pdfextension) |
| lfc_upper | (numeric) log2fc upper threshold (positive value) |
| lfc_lower | (numeric) log2fc lower threshold (negative value) |
| whatPvalue | (char) pvalue or adj.pvalue (default) |
| FDR | (numeric) False Discovery Rate threshold |
| (logical) Option to generate pdf format. Default: T | |
| decimal_threshold | (numeric) Decimal threshold for the pvalue. Default: 16 (10^-16) |
| verbose | (logical) TRUE (default) shows function messages |
Value
(pdf) of a volcano plot
Examples
artmsVolcanoPlot(mss_results = artms_data_ph_msstats_results, whatPvalue = "pvalue", PDF = FALSE)