Types of visualizations - Amazon CodeGuru Profiler (original) (raw)
Amazon CodeGuru Profiler uses three types of visualizations to display profiling data collected from applications.
- An overview visualization provides a bottom-up view of your profiling data.
- A hotspots visualization provides a top-down view of your profiling data.
- An inspect visualization provides a focus view of a named stack frame.
Together, these visualizations can help you identify potential performance issues in your applications. All visualizations use a common set of tools to explore and filter data.
The following topics provide more information about each visualization type.
Topics
Overview visualizations
An overview visualization provides a bottom-up view of your profiling data. It's similar to reading a stack trace in many IDEs. At the bottom of the visualization are the entry point functions. As you move higher, there are functions that are called deeper in the stack trace. Functions at the top of the visualization are the ones doing basic system operations.
From stack traces to overview visualization
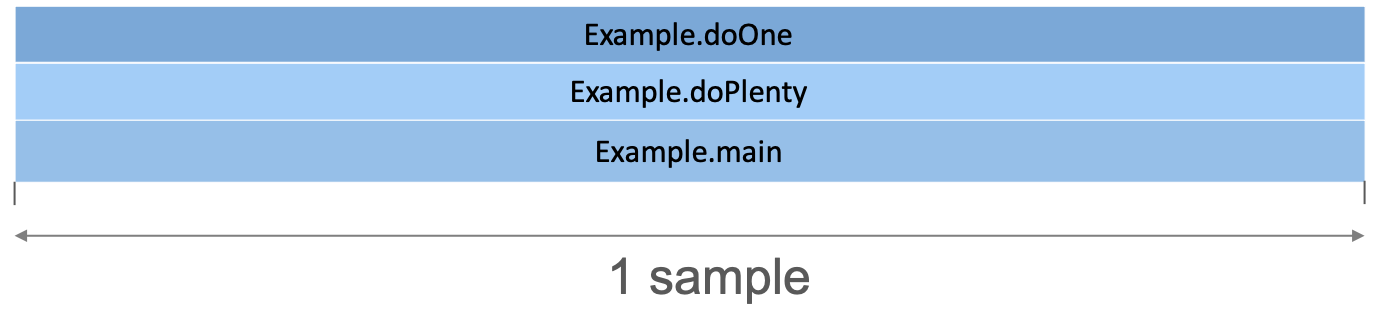
The following example shows how stack trace samples are represented in an overview visualization. Each stack trace that we sample from the profiled application is added to the visualization.
Thread main
    java.lang.Thread.State: RUNNABLE
      com.amazon.profiler.demo.Example.doOne()
      com.amazon.profiler.demo.Example.doPlenty()
      com.amazon.profiler.demo.Example.main(String[])
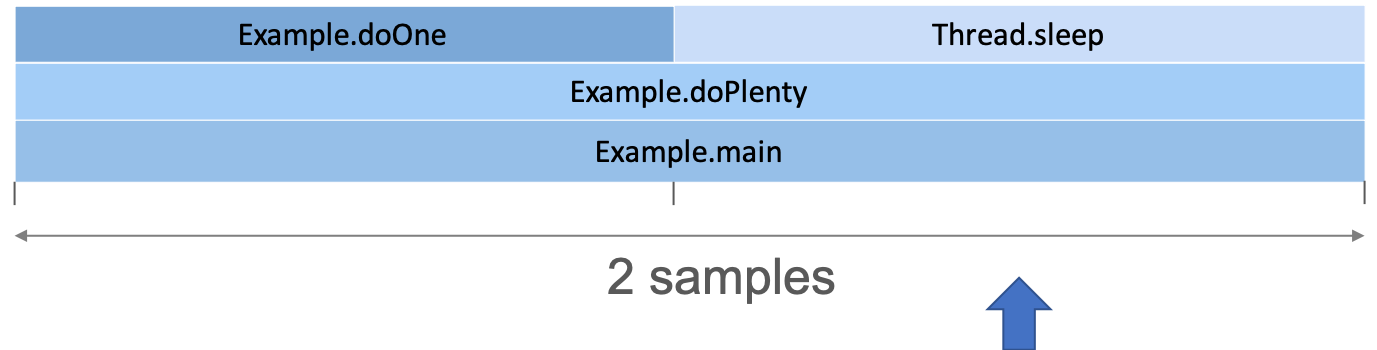
 Thread main
    java.lang.Thread.State: TIMED_WAITING
      java.lang.Thread.sleep(long)
      com.amazon.profiler.demo.Example.doPlenty()
      com.amazon.profiler.demo.Example.main(String[])
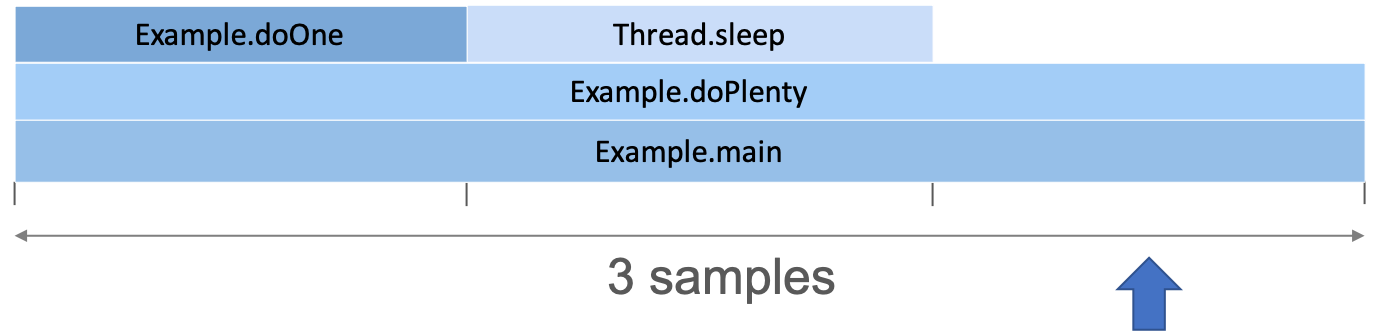
Thread main
    java.lang.Thread.State: RUNNABLE
      com.amazon.profiler.demo.Example.doPlenty()
      com.amazon.profiler.demo.Example.main(String[])
Thread main
    java.lang.Thread.State: RUNNABLE
      com.amazon.profiler.demo.Example.doOne()
      com.amazon.profiler.demo.Example.main(String[])
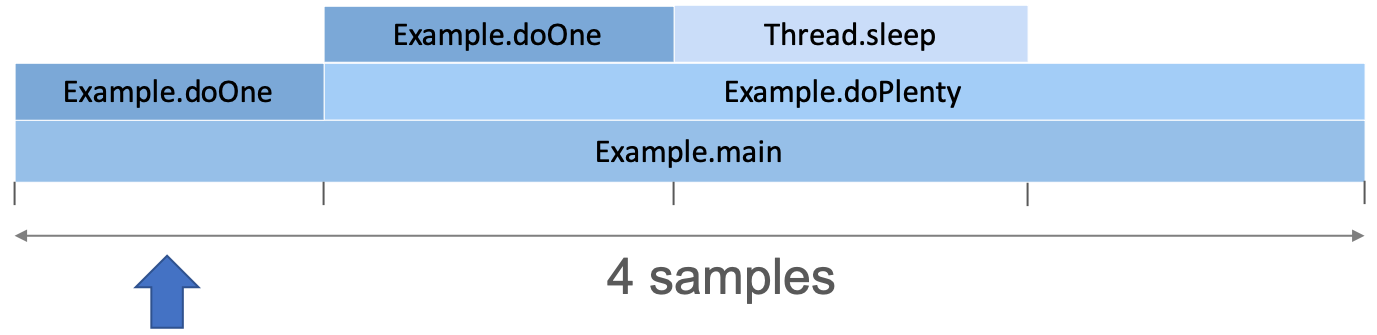
As we collect more samples, the functions in which threads spend a lot of time appear wider in the visualization.
What you can learn from overview visualization
An overview visualization can help you find specific call stacks that lead to inefficient code. You can find code that is running on the CPU by looking for flat tops in the visualization. The flat tops are areas where the CPU is doing work directly in that function.
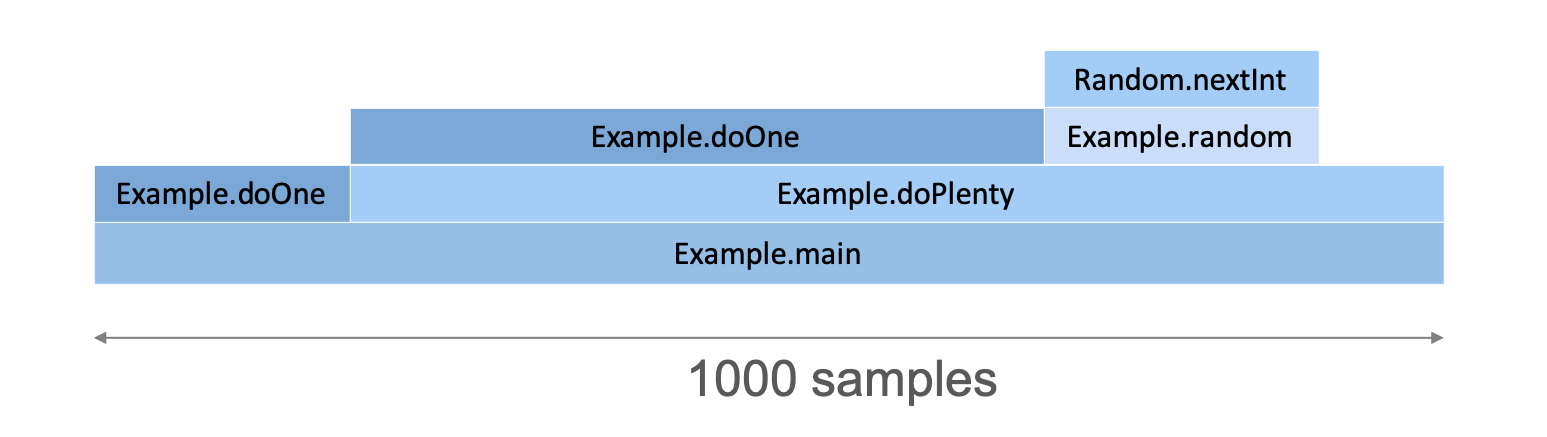
This overview example tells the following:
- The
doOnefunction is called inside bothmainfunction anddoPlentyfunction because it appears above both frames. - More than half of the CPU time spent in
doPlentyis actually spent in thedoOnefunction because the width ofdoOneis more than half the width ofdoPlenty. - The
doPlentyfunction is also doing some basic CPU operations because it has some self time (some width with no callee frames).
The overview example DOES NOT tell the following:
- Inside
maincode, thedoOnefunction is called before thedoPlentyfunction. Frames are ordered alphabetically, and from the visualization, we can't tell in which order the functions are called. - The
doOnefunction is called more often than therandomfunction. The overview visualization only tells that more CPU time is spent indoOnebut CodeGuru Profiler doesn't give any information about the number of times it was called. It might be that it is called less often but is more CPU heavy. - The
doPlentyfunction takes n seconds to execute. CodeGuru Profiler doesn't measure execution time; it only provides estimates of the average CPU time spent in that function over the profile's time range. It's not a duration. A CPU-heavy function that is rarely called and a cheap function that is called many times can look similar in an overview visualization.
An overview visualization can make it difficult to spot problems with functions that are spread around in multiple stacks. For example, logging calls are often distributed across threads and functions. In these cases, a hotspots visualization might be a better choice.
Hotspots visualizations
A hotspots visualization shows a top-down view of your profile. The functions consuming the most application time are at the top of the visualization. The entry point functions are at the bottom of the visualization.
You can use a hotspots visualization to investigate functions that are by themselves computationally expensive.
Example
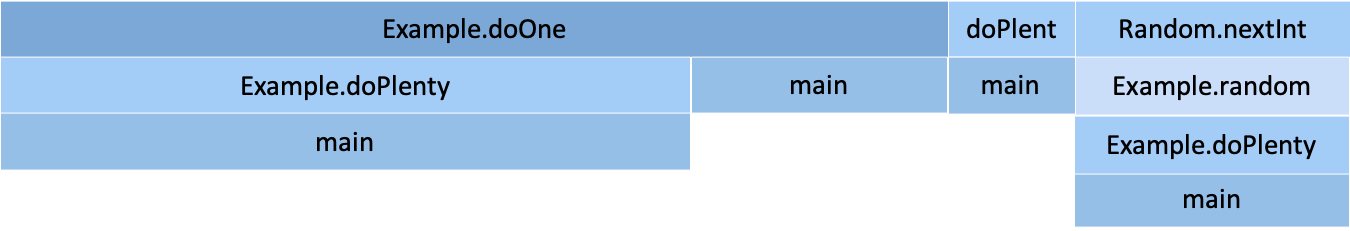
This overview example tells the following:
- The
doOnefunction has two different callers because there are two frames below it. - Most of the overall CPU time is spent in the
doOnefunction because it is the majority of the width in the top row.
Inspect visualizations
An inspect visualization is useful to analyze a frame that appears in many places in a visualization. It groups all of the frames with the same name together in the middle of the visualization. Children (callees) are merged into the visualization above the frame. Parents (callers) are merged into the visualization below the frame.