Monitoring concurrency - AWS Lambda (original) (raw)
Lambda emits Amazon CloudWatch metrics to help you monitor concurrency for your functions. This topic explains these metrics and how to interpret them.
Sections
- General concurrency metrics
- Provisioned concurrency metrics
- Working with the ClaimedAccountConcurrency metric
General concurrency metrics
Use the following metrics to monitor concurrency for your Lambda functions. The granularity for each metric is 1 minute.
ConcurrentExecutions– The number of active concurrent invocations at a given point in time. Lambda emits this metric for all functions, versions, and aliases. For any function in the Lambda console, Lambda displays the graph forConcurrentExecutionsnatively in the Monitoring tab, under Metrics. View this metric usingMAX.UnreservedConcurrentExecutions– The number of active concurrent invocations that are using unreserved concurrency. Lambda emits this metric across all functions in a region. View this metric using MAX.ClaimedAccountConcurrency– The amount of concurrency that is unavailable for on-demand invocations.ClaimedAccountConcurrencyis equal toUnreservedConcurrentExecutionsplus the amount of allocated concurrency (i.e. the total reserved concurrency plus total provisioned concurrency). IfClaimedAccountConcurrencyexceeds your account concurrency limit, you can request a higher account concurrency limit. View this metric usingMAX. For more information, seeWorking with the ClaimedAccountConcurrency metric.
Provisioned concurrency metrics
Use the following metrics to monitor Lambda functions using provisioned concurrency. The granularity for each metric is 1 minute.
ProvisionedConcurrentExecutions– The number of execution environment instances that are actively processing an invocation on provisioned concurrency. Lambda emits this metric for each function version and alias with provisioned concurrency configured. View this metric usingMAX.
ProvisionedConcurrentExecutions is not the same as the total number of provisioned concurrency that you allocate. For example, suppose you allocate 100 units of provisioned concurrency to a function version. During any given minute, if at most 50 out of those 100 execution environments were handling invocations simultaneously, then the value of MAX(ProvisionedConcurrentExecutions) is 50.
ProvisionedConcurrencyInvocations– The number of times Lambda invokes your function code using provisioned concurrency. Lambda emits this metric for each function version and alias with provisioned concurrency configured. View this metric using SUM.
ProvisionedConcurrencyInvocations differs fromProvisionedConcurrentExecutions in thatProvisionedConcurrencyInvocations counts total number of invocations, whileProvisionedConcurrentExecutions counts number of active environments. To understand this distinction, consider the following scenario:
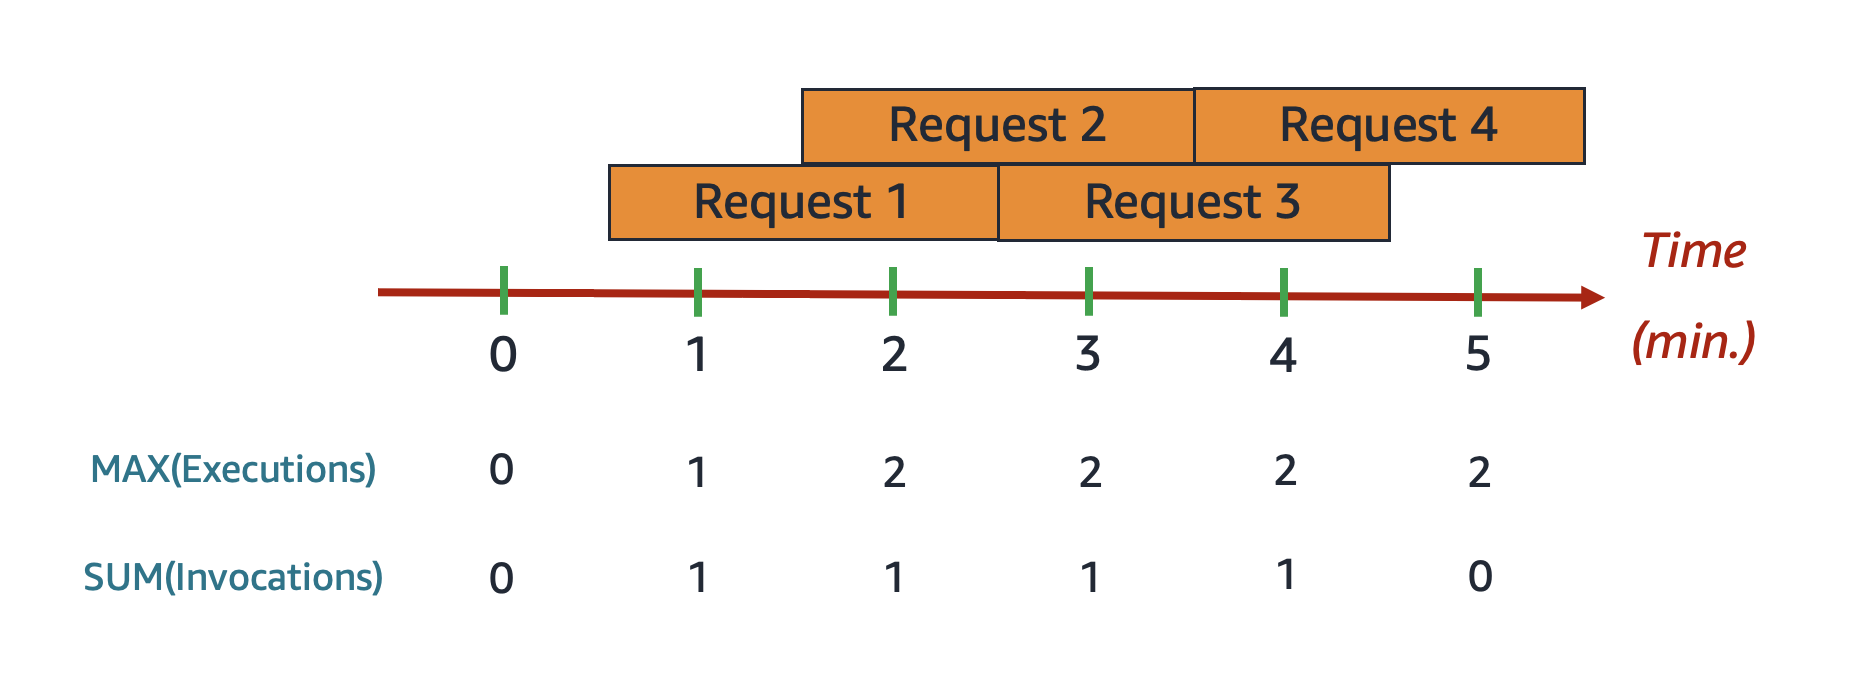
In this example, suppose that you receive 1 invocation per minute, and each invocation takes 2 minutes to complete. Each orange horizontal bar represents a single request. Suppose that you allocate 10 units of provisioned concurrency to this function, such that each request runs on provisioned concurrency.
In between minutes 0 and 1, Request 1 comes in.At minute 1, the value forMAX(ProvisionedConcurrentExecutions) is 1, since at most 1 execution environment was active during the past minute. The value forSUM(ProvisionedConcurrencyInvocations) is also 1, since 1 new request came in during the past minute.
In between minutes 1 and 2, Request 2 comes in, andRequest 1 continues to run. At minute 2, the value forMAX(ProvisionedConcurrentExecutions) is 2, since at most 2 execution environments were active during the past minute. However, the value forSUM(ProvisionedConcurrencyInvocations) is 1, since only 1 new request came in during the past minute. This metric behavior continues until the end of the example.
ProvisionedConcurrencySpilloverInvocations– The number of times Lambda invokes your function on standard (reserved or unreserved) concurrency when all provisioned concurrency is in use. Lambda emits this metric for each function version and alias with provisioned concurrency configured. View this metric using SUM. The value ofProvisionedConcurrencyInvocations+ProvisionedConcurrencySpilloverInvocationsshould be equal to the total number of function invocations (i.e. theInvocationsmetric).ProvisionedConcurrencyUtilization– The percentage of provisioned concurrency in use (i.e. the value ofProvisionedConcurrentExecutionsdivided by the total amount of provisioned concurrency allocated). Lambda emits this metric for each function version and alias with provisioned concurrency configured. View this metric using MAX.
For example, suppose you provision 100 units of provisioned concurrency to a function version. During any given minute, if at most 60 out of those 100 execution environments were handling invocations simultaneously, then the value ofMAX(ProvisionedConcurrentExecutions) is 60, and the value ofMAX(ProvisionedConcurrencyUtilization) is 0.6.
A high value for ProvisionedConcurrencySpilloverInvocations may indicate that you need to allocate additional provisioned concurrency for your function. Alternatively, you can configure Application Auto Scaling to handle automatic scaling of provisioned concurrency based on pre-defined thresholds.
Conversely, consistently low values for ProvisionedConcurrencyUtilization may indicate that you over-allocated provisioned concurrency for your function.
Working with theClaimedAccountConcurrency metric
Lambda uses the ClaimedAccountConcurrency metric to determine how much concurrency your account is available for on-demand invocations. Lambda calculatesClaimedAccountConcurrency using the following formula:
ClaimedAccountConcurrency = UnreservedConcurrentExecutions + (allocated concurrency)UnreservedConcurrentExecutions is the number of active concurrent invocations that are using unreserved concurrency. Allocated concurrency is the sum of the following two parts (substituting RC as "reserved concurrency" and PC as "provisioned concurrency"):
- The total
RCacross all functions in a Region. - The total
PCacross all functions in a Region that usePC, excluding functions that useRC.
Note
You can’t allocate more PC than RC for a function. Thus, a function’s RC is always greater than or equal to itsPC. To calculate the contribution to allocated concurrency for such functions with both PC and RC, Lambda considers only RC, which is the maximum of the two.
Lambda uses the ClaimedAccountConcurrency metric, rather thanConcurrentExecutions, to determine how much concurrency is available for on-demand invocations. While the ConcurrentExecutions metric is useful for tracking the number of active concurrent invocations, it doesn't always reflect your true concurrency availability. This is because Lambda also considers reserved concurrency and provisioned concurrency to determine availability.
To illustrate ClaimedAccountConcurrency, consider a scenario where you configure a lot of reserved concurrency and provisioned concurrency across your functions that go largely unused. In the following example, assume that your account concurrency limit is 1,000, and you have two main functions in your account:function-orange and function-blue. You allocate 600 units of reserved concurrency for function-orange. You allocate 200 units of provisioned concurrency for function-blue. Suppose that over time, you deploy additional functions and observe the following traffic pattern:
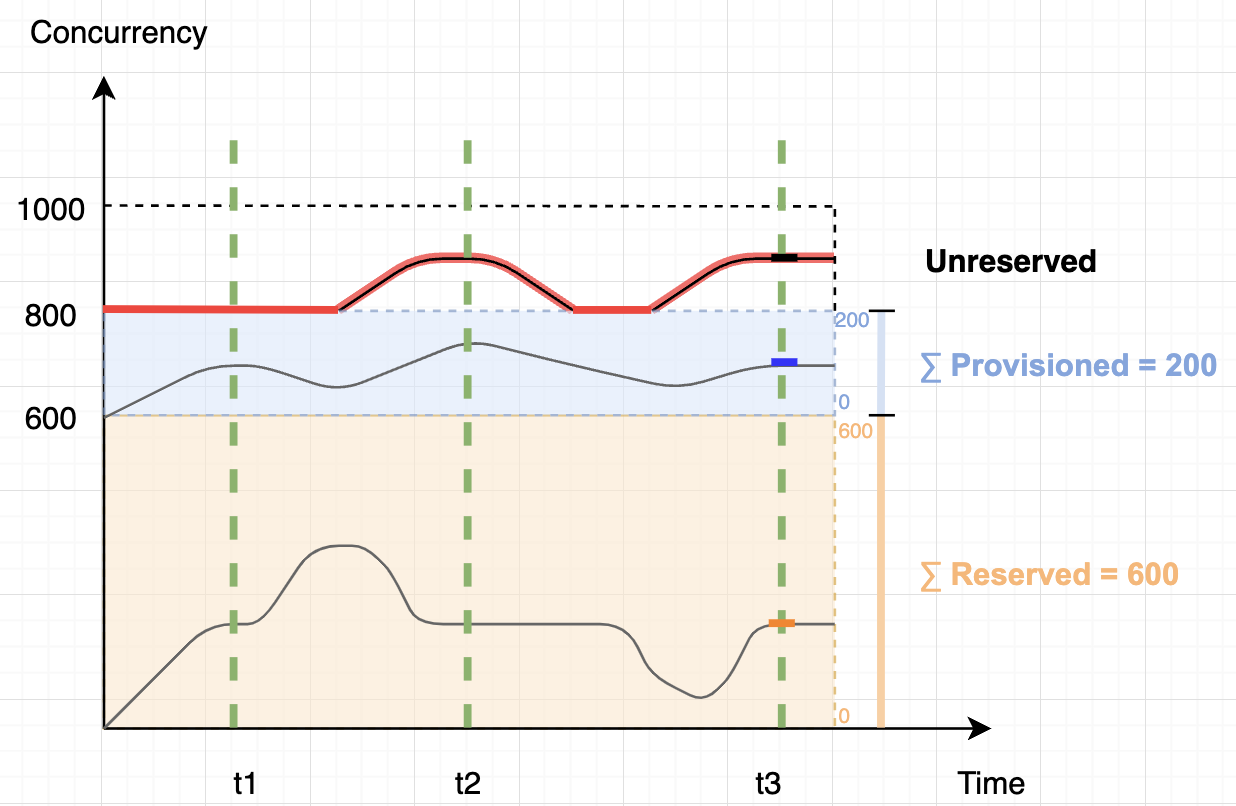
In the previous diagram, the black lines indicate the actual concurrency use over time, and the red line indicates the value ofClaimedAccountConcurrency over time. Throughout this scenario,ClaimedAccountConcurrency is 800 at minimum, despite low actual concurrency utilization across your functions. This is because you allocated 800 total units of concurrency for function-orange andfunction-blue. From Lambda's perspective, you have "claimed" this concurrency for use, so you effectively have only 200 units of concurrency remaining for other functions.
For this scenario, allocated concurrency is 800 in theClaimedAccountConcurrency formula. We can then derive the value ofClaimedAccountConcurrency at various points in the diagram:
- At
t1,ClaimedAccountConcurrencyis 800 (800 + 0UnreservedConcurrentExecutions). - At
t2,ClaimedAccountConcurrencyis 900 (800 + 100UnreservedConcurrentExecutions). - At
t3,ClaimedAccountConcurrencyis again 900 (800 + 100UnreservedConcurrentExecutions).
Setting up the ClaimedAccountConcurrency metric in CloudWatch
Lambda emits the ClaimedAccountConcurrency metric in CloudWatch. Use this metric along with the value of SERVICE_QUOTA(ConcurrentExecutions) to get the percent utilization of concurrency in your account, as shown in the following formula:
Utilization = (ClaimedAccountConcurrency/SERVICE_QUOTA(ConcurrentExecutions)) * 100%The following screenshot illustrates how you can graph this formula in CloudWatch. The green claim_utilization line represents the concurrency utilization in this account, which is at around 40%:
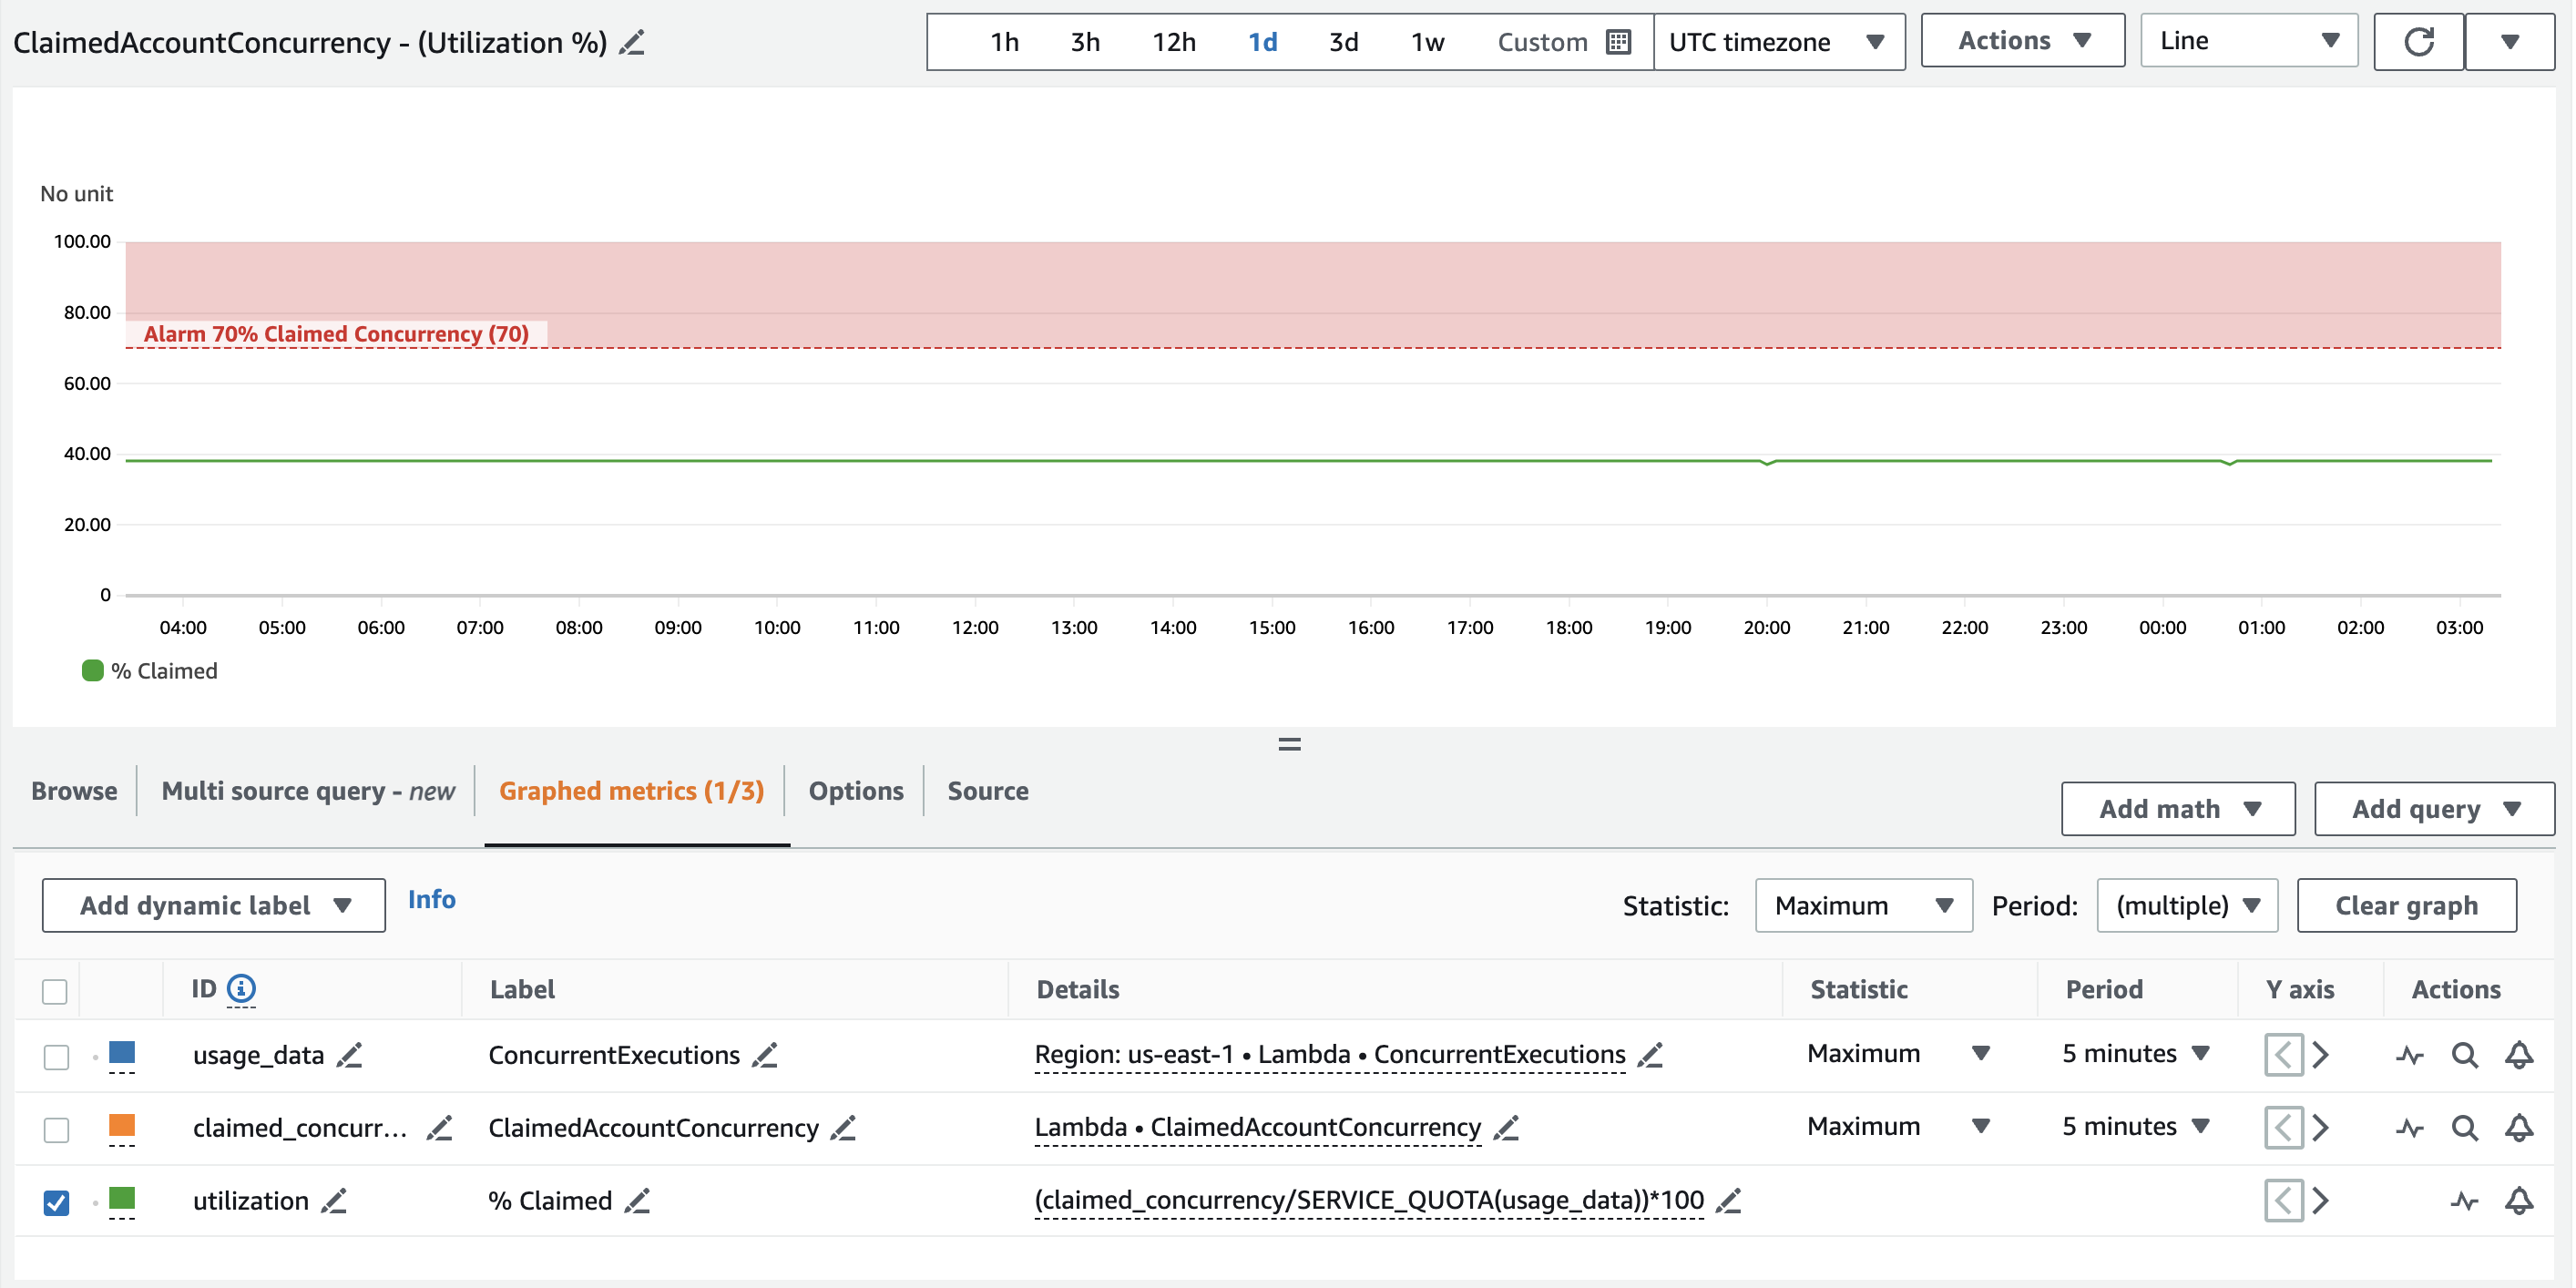
The previous screenshot also includes a CloudWatch alarm that goes intoALARM state when the concurrency utilization exceeds 70%. You can use the ClaimedAccountConcurrency metric along with similar alarms to proactively determine when you might need to request a higher account concurrency limit.