Accessing real-time telemetry data for extensions using the Telemetry API (original) (raw)
The Telemetry API enables your extensions to receive telemetry data directly from Lambda. During function initialization and invocation, Lambda automatically captures telemetry, including logs, platform metrics, and platform traces. The Telemetry API enables extensions to access this telemetry data directly from Lambda in near real time.
Within the Lambda execution environment, you can subscribe your Lambda extensions to telemetry streams. After subscribing, Lambda automatically sends all telemetry data to your extensions. You then have the flexibility to process, filter, and dispatch the data to your preferred destination, such as an Amazon Simple Storage Service (Amazon S3) bucket or a third-party observability tools provider.
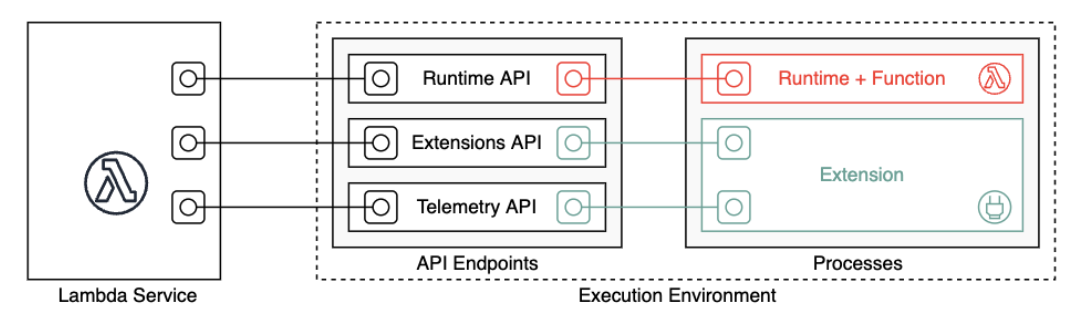
The following diagram shows how the Extensions API and Telemetry API link extensions to Lambda from within the execution environment. Additionally, the Runtime API connects your runtime and function to Lambda.
Important
The Lambda Telemetry API supersedes the Lambda Logs API. While the Logs API remains fully functional, we recommend using only the Telemetry API going forward. You can subscribe your extension to a telemetry stream using either the Telemetry API or the Logs API. After subscribing using one of these APIs, any attempt to subscribe using the other API returns an error.
Extensions can use the Telemetry API to subscribe to three different telemetry streams:
- Platform telemetry – Logs, metrics, and traces, which describe events and errors related to the execution environment runtime lifecycle, extension lifecycle, and function invocations.
- Function logs – Custom logs that the Lambda function code generates.
- Extension logs – Custom logs that the Lambda extension code generates.
Note
Lambda sends logs and metrics to CloudWatch, and traces to X-Ray (if you've activated tracing), even if an extension subscribes to telemetry streams.
Sections
- Creating extensions using the Telemetry API
- Registering your extension
- Creating a telemetry listener
- Specifying a destination protocol
- Configuring memory usage and buffering
- Sending a subscription request to the Telemetry API
- Inbound Telemetry API messages
- Lambda Telemetry API reference
- Lambda Telemetry API Event schema reference
- Converting Lambda Telemetry API Event objects to OpenTelemetry Spans
- Using the Lambda Logs API
Creating extensions using the Telemetry API
Lambda extensions run as independent processes in the execution environment. Extensions can continue to run after function invocation completes. Because extensions are separate processes, you can write them in a language different from the function code. We recommend writing extensions using a compiled language such as Golang or Rust. This way, the extension is a self-contained binary that can be compatible with any supported runtime.
The following diagram illustrates a four-step process to create an extension that receives and processes telemetry data using the Telemetry API.
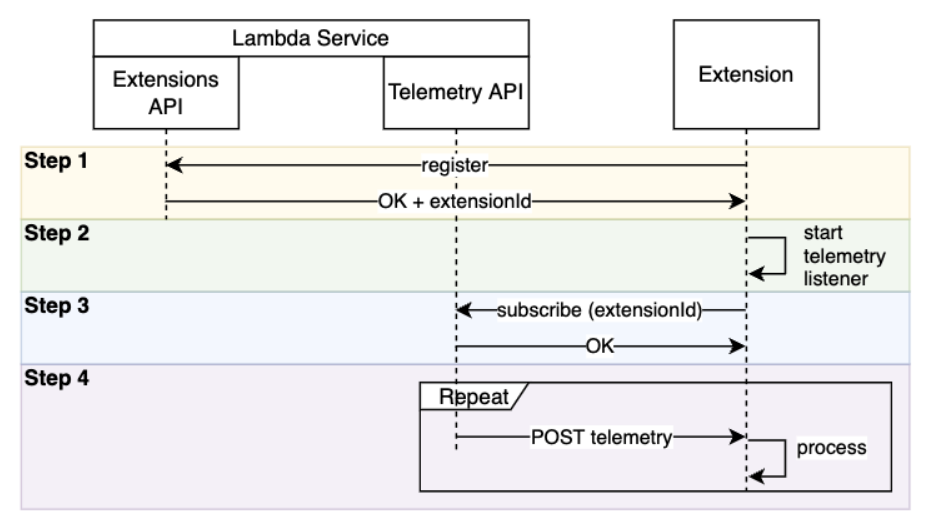
Here is each step in more detail:
- Register your extension using the Using the Lambda Extensions API to create extensions. This provides you with a
Lambda-Extension-Identifier, which you'll need in the following steps. For more information about how to register your extension, see Registering your extension. - Create a telemetry listener. This can be a basic HTTP or TCP server. Lambda uses the URI of the telemetry listener to send telemetry data to your extension. For more information, see Creating a telemetry listener.
- Using the Subscribe API in the Telemetry API, subscribe your extension to the desired telemetry streams. You'll need the URI of your telemetry listener for this step. For more information, see Sending a subscription request to the Telemetry API.
- Get telemetry data from Lambda via the telemetry listener. You can do any custom processing of this data, such as dispatching the data to Amazon S3 or to an external observability service.
Note
A Lambda function's execution environment can start and stop multiple times as part of its lifecycle. In general, your extension code runs during function invocations, and also up to 2 seconds during the shutdown phase. We recommend batching the telemetry as it arrives to your listener. Then, use the Invoke and Shutdown lifecycle events to send each batch to their desired destinations.
Registering your extension
Before you can subscribe to telemetry data, you must register your Lambda extension. Registration occurs during the extension initialization phase. The following example shows an HTTP request to register an extension.
POST http://${AWS_LAMBDA_RUNTIME_API}/2020-01-01/extension/register
 Lambda-Extension-Name: lambda_extension_name
{
    'events': [ 'INVOKE', 'SHUTDOWN']
}
If the request succeeds, the subscriber receives an HTTP 200 success response. The response header contains the Lambda-Extension-Identifier. The response body contains other properties of the function.
HTTP/1.1 200 OK
Lambda-Extension-Identifier: a1b2c3d4-5678-90ab-cdef-EXAMPLE11111
{
    "functionName": "lambda_function",
    "functionVersion": "$LATEST",
    "handler": "lambda_handler",
    "accountId": "123456789012"
}
For more information, see the Extensions API reference.
Creating a telemetry listener
Your Lambda extension must have a listener that handles incoming requests from the Telemetry API. The following code shows an example telemetry listener implementation in Golang:
// Starts the server in a goroutine where the log events will be sent
func (s *TelemetryApiListener) Start() (string, error) {
    address := listenOnAddress()
    l.Info("[listener:Start] Starting on address", address)
    s.httpServer = &http.Server{Addr: address}
    http.HandleFunc("/", s.http_handler)
    go func() {
        err := s.httpServer.ListenAndServe()
        if err != http.ErrServerClosed {
            l.Error("[listener:goroutine] Unexpected stop on Http Server:", err)
            s.Shutdown()
        } else {
            l.Info("[listener:goroutine] Http Server closed:", err)
        }
    }()
    return fmt.Sprintf("http://%s/", address), nil
}

// http_handler handles the requests coming from the Telemetry API.
// Everytime Telemetry API sends log events, this function will read them from the response body
// and put into a synchronous queue to be dispatched later.
// Logging or printing besides the error cases below is not recommended if you have subscribed to
// receive extension logs. Otherwise, logging here will cause Telemetry API to send new logs for
// the printed lines which may create an infinite loop.
func (s *TelemetryApiListener) http_handler(w http.ResponseWriter, r *http.Request) {
    body, err := ioutil.ReadAll(r.Body)
    if err != nil {
        l.Error("[listener:http_handler] Error reading body:", err)
        return
    }

    // Parse and put the log messages into the queue
    var slice []interface{}
    _ = json.Unmarshal(body, &slice)

    for _, el := range slice {
        s.LogEventsQueue.Put(el)
    }

    l.Info("[listener:http_handler] logEvents received:", len(slice), " LogEventsQueue length:", s.LogEventsQueue.Len())
    slice = nil
}
Specifying a destination protocol
When you subscribe to receive telemetry using the Telemetry API, you can specify a destination protocol in addition to the destination URI:
{
    "destination": {
        "protocol": "HTTP",
        "URI": "http://sandbox.localdomain:8080"
    }
}
Lambda accepts two protocols for receiving telemetry:
- HTTP (recommended) – Lambda delivers telemetry to a local HTTP endpoint (
http://sandbox.localdomain:${PORT}/${PATH}) as an array of records in JSON format. The$PATHparameter is optional. Lambda supports only HTTP, not HTTPS. Lambda delivers telemetry through POST requests. - TCP – Lambda delivers telemetry to a TCP port in Newline delimited JSON (NDJSON) format.
Note
We strongly recommend using HTTP rather than TCP. With TCP, the Lambda platform cannot acknowledge when it delivers telemetry to the application layer. Therefore, if your extension crashes, you might lose telemetry. HTTP does not have this limitation.
Before subscribing to receive telemetry, establish the local HTTP listener or TCP port. During setup, note the following:
- Lambda sends telemetry only to destinations that are inside the execution environment.
- Lambda retries to send telemetry (with backoff) in the absence of a listener, or if the POST request encounters an error. If the telemetry listener crashes, it resumes receiving telemetry after Lambda restarts the execution environment.
- Lambda reserves port 9001. There are no other port number restrictions or recommendations.
Configuring memory usage and buffering
Memory usage in an execution environment grows linearly with the number of subscribers. Subscriptions consume memory resources because each one opens a new memory buffer to store telemetry data. Buffer memory usage contributes to the overall memory consumption in the execution environment.
When subscribing to receive telemetry through the Telemetry API, you have the option to buffer telemetry data and deliver it to subscribers in batches. To optimize memory usage, you can specify a buffering configuration:
{
    "buffering": {
        "maxBytes": 256*1024,
        "maxItems": 1000,
        "timeoutMs": 100
    }
}| Parameter | Description | Defaults and limits |
|---|---|---|
| maxBytes | The maximum volume of telemetry (in bytes) to buffer in memory. | Default: 262,144 Minimum: 262,144 Maximum: 1,048,576 |
| maxItems | The maximum number of events to buffer in memory. | Default: 10,000 Minimum: 1,000 Maximum: 10,000 |
| timeoutMs | The maximum time (in milliseconds) to buffer a batch. | Default: 1,000 Minimum: 25 Maximum: 30,000 |
When setting up buffering, keep these points in mind:
- If any of the input streams are closed, Lambda flushes the logs. For example, this can occur if the runtime crashes.
- Each subscriber can customize their buffering configuration in their subscription request.
- When determining the buffer size for reading the data, anticipate receiving payloads as large as
2 * maxBytes + metadataBytes, wheremaxBytesis a component of your buffering setup. To gauge the amount ofmetadataBytesto consider, review the following metadata. Lambda appends metadata similar to this to each record:
{
   "time": "2022-08-20T12:31:32.123Z",
   "type": "function",
   "record": "Hello World"
} - If the subscriber cannot process incoming telemetry fast enough, or if your function code generates very high log volume, Lambda might drop records to keep memory utilization bounded. When this occurs, Lambda sends a
platform.logsDroppedevent.
Sending a subscription request to the Telemetry API
Lambda extensions can subscribe to receive telemetry data by sending a subscription request to the Telemetry API. The subscription request should contain information about the types of events that you want the extension to subscribe to. In addition, the request can contain delivery destination information and a buffering configuration.
Before sending a subscription request, you must have an extension ID (Lambda-Extension-Identifier). When you register your extension with the Extensions API, you obtain an extension ID from the API response.
Subscription occurs during the extension initialization phase. The following example shows an HTTP request to subscribe to all three telemetry streams: platform telemetry, function logs, and extension logs.
PUT http://${AWS_LAMBDA_RUNTIME_API}/2022-07-01/telemetry HTTP/1.1
{
   "schemaVersion": "2022-12-13",
   "types": [
        "platform",
        "function",
        "extension"
   ],
   "buffering": {
        "maxItems": 1000,
        "maxBytes": 256*1024,
        "timeoutMs": 100
   },
   "destination": {
        "protocol": "HTTP",
        "URI": "http://sandbox.localdomain:8080"
   }
}
If the request succeeds, then the subscriber receives an HTTP 200 success response.
HTTP/1.1 200 OK
"OK"
Inbound Telemetry API messages
After subscribing using the Telemetry API, an extension automatically starts to receive telemetry from Lambda via POST requests. Each POST request body contains an array of Event objects. Each Event has the following schema:
{
   time: String,
   type: String,
   record: Object
}- The
timeproperty defines when the Lambda platform generated the event. This is different from when the event actually occurred. The string value oftimeis a timestamp in ISO 8601 format. - The
typeproperty defines the event type. The following table describes all possible values. - The
recordproperty defines a JSON object that contains the telemetry data. The schema of this JSON object depends on thetype.
The following table summarizes all types of Event objects, and links to the Telemetry API Event schema reference for each event type.
| Category | Event type | Description | Event record schema |
|---|---|---|---|
| Platform event | platform.initStart | Function initialization started. | platform.initStart schema |
| Platform event | platform.initRuntimeDone | Function initialization completed. | platform.initRuntimeDone schema |
| Platform event | platform.initReport | A report of function initialization. | platform.initReport schema |
| Platform event | platform.start | Function invocation started. | platform.start schema |
| Platform event | platform.runtimeDone | The runtime finished processing an event with either success or failure. | platform.runtimeDone schema |
| Platform event | platform.report | A report of function invocation. | platform.report schema |
| Platform event | platform.restoreStart | Runtime restore started. | platform.restoreStart schema |
| Platform event | platform.restoreRuntimeDone | Runtime restore completed. | platform.restoreRuntimeDone schema |
| Platform event | platform.restoreReport | Report of runtime restore. | platform.restoreReport schema |
| Platform event | platform.telemetrySubscription | The extension subscribed to the Telemetry API. | platform.telemetrySubscription schema |
| Platform event | platform.logsDropped | Lambda dropped log entries. | platform.logsDropped schema |
| Function logs | function | A log line from function code. | function schema |
| Extension logs | extension | A log line from extension code. | extension schema |