Getting Performance Numbers — OpenVINO™ documentation (original) (raw)
Benchmarking methodology for OpenVINO#
OpenVINO benchmarking (general)#
The OpenVINO benchmark setup includes a single system with OpenVINO™, as well as the benchmark application installed. It measures the time spent on actual inference (excluding any pre or post processing) and then reports on the inferences per second (or Frames Per Second).
OpenVINO Model Server benchmarking (general)#
OpenVINO™ Model Server (OVMS) employs the Intel® Distribution of OpenVINO™ toolkit runtime libraries and exposes a set of models via a convenient inference API over gRPC or HTTP/REST. Its benchmark results are measured with the configuration of multiple-clients-single-server, using two hardware platforms connected by ethernet. Network bandwidth depends on both platforms and models used. It is set not to be a bottleneck for workload intensity. The connection is dedicated only to measuring performance.
The benchmark setup for OVMS consists of four main parts:
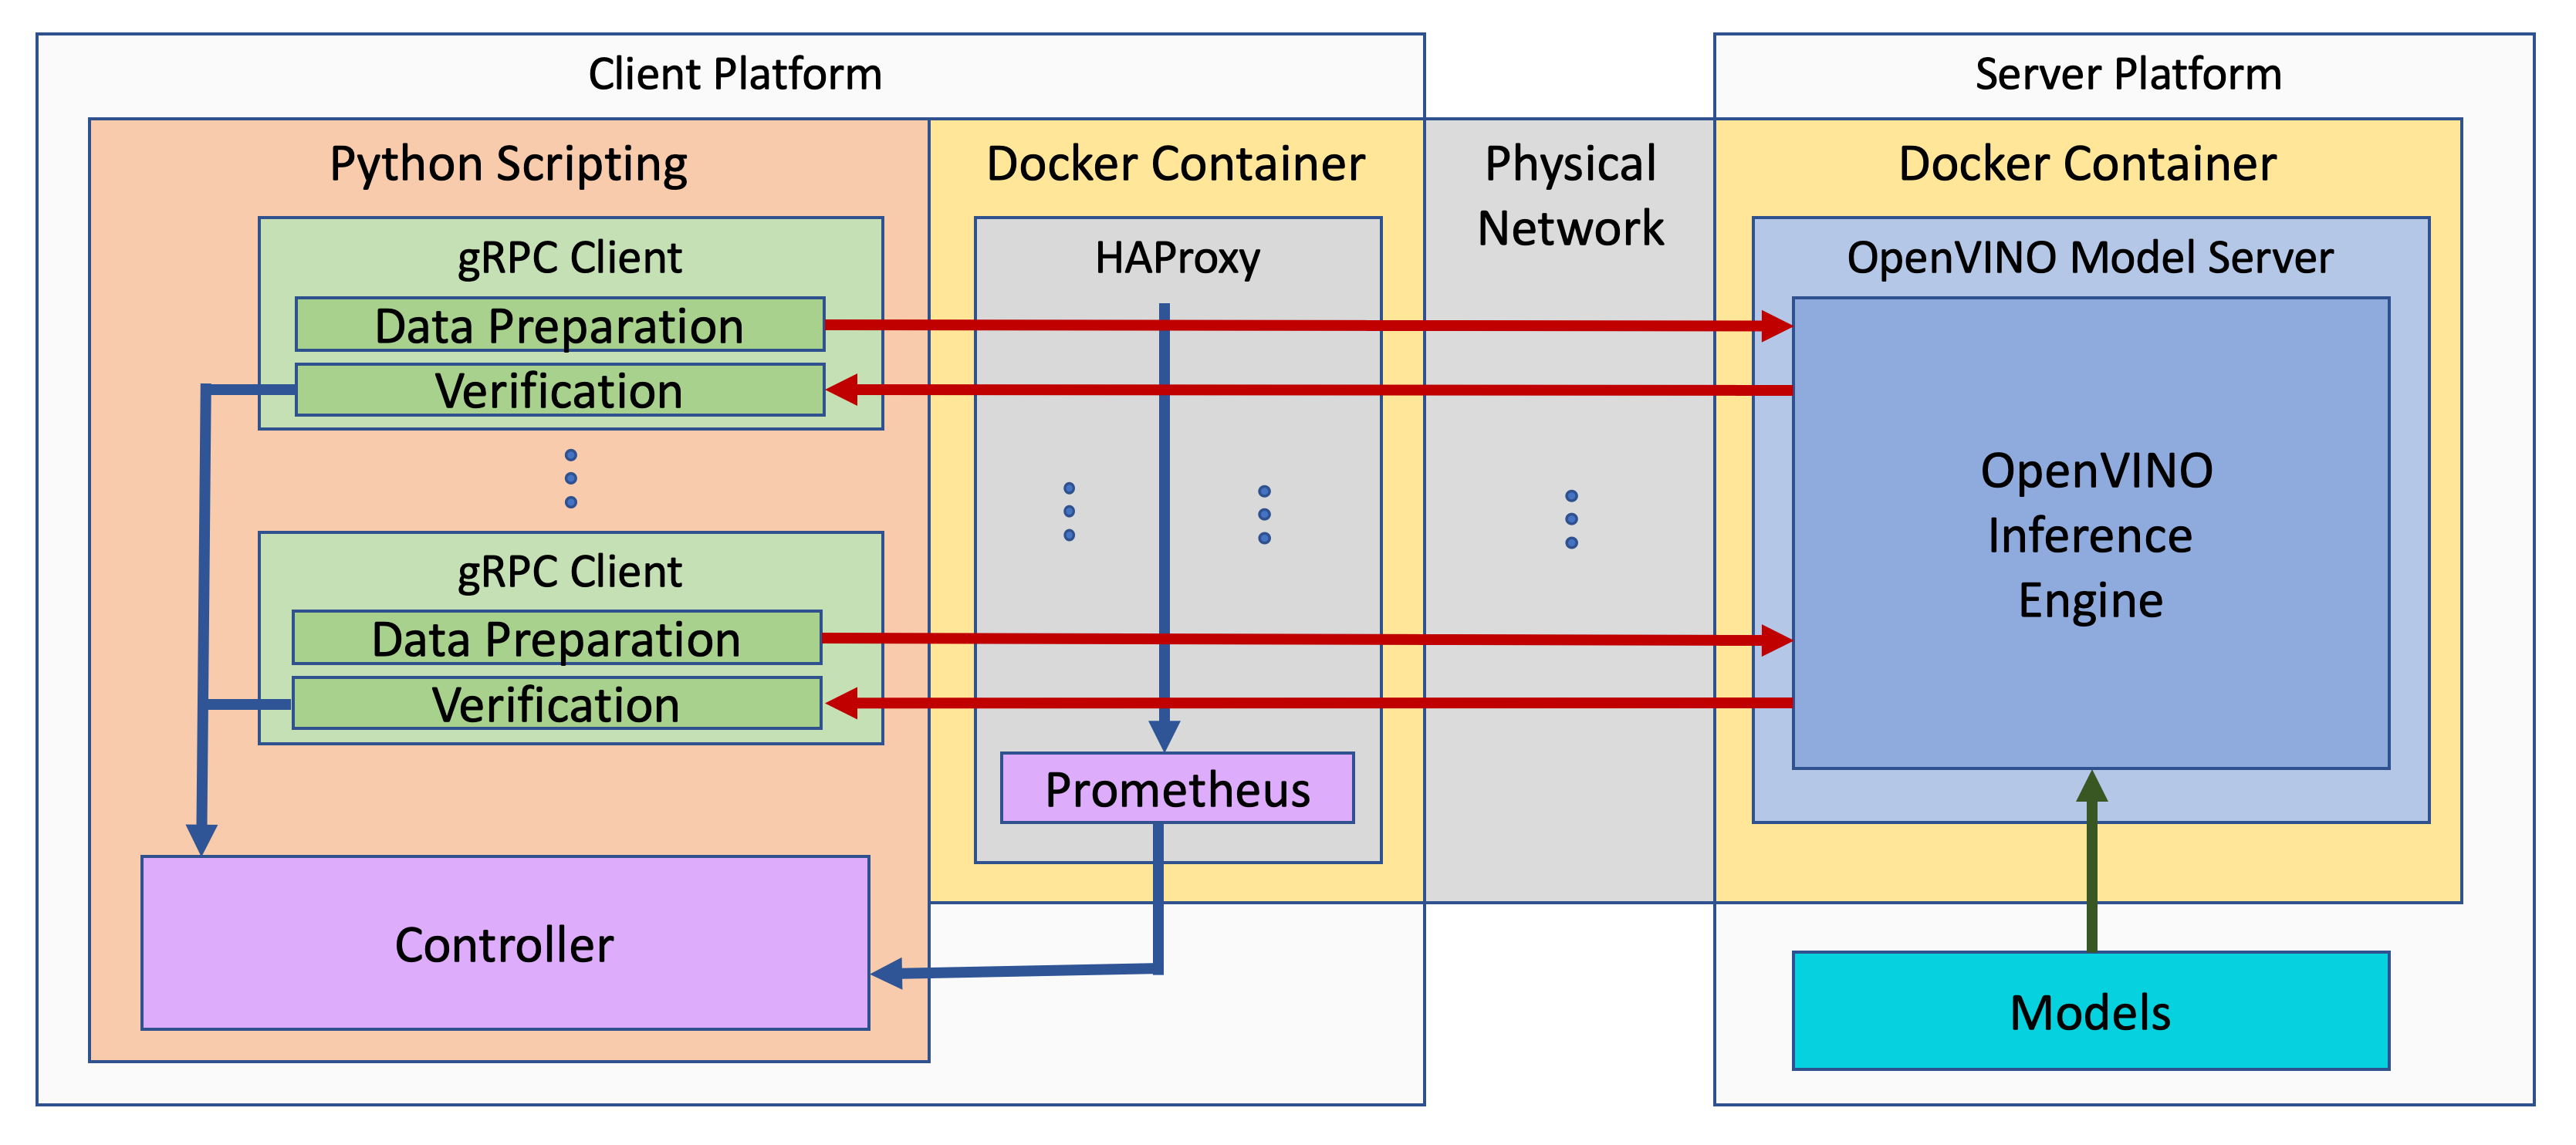
- OpenVINO™ Model Server is launched as a docker container on the server platform and it listens to (and answers) requests from clients. OpenVINO™ Model Server is run on the same system as the OpenVINO™ toolkit benchmark application in corresponding benchmarking. Models served by OpenVINO™ Model Server are located in a local file system mounted into the docker container. The OpenVINO™ Model Server instance communicates with other components via ports over a dedicated docker network.
- Clients are run in separated physical machine referred to as client platform. Clients are implemented in Python3 programming language based on TensorFlow* API and they work as parallel processes. Each client waits for a response from OpenVINO™ Model Server before it will send a new next request. The role played by the clients is also verification of responses.
- Load balancer works on the client platform in a docker container. HAProxy is used for this purpose. Its main role is counting of requests forwarded from clients to OpenVINO™ Model Server, estimating its latency, and sharing this information by Prometheus service. The reason of locating the load balancer on the client site is to simulate real life scenario that includes impact of physical network on reported metrics.
- Execution Controller is launched on the client platform. It is responsible for synchronization of the whole measurement process, downloading metrics from the load balancer, and presenting the final report of the execution.
OpenVINO Model Server benchmarking (LLM)#
In the benchmarking results presented here, the load from clients is simulated using the benchmark_serving.py script from vLLM and the ShareGPT dataset. It represents real life usage scenarios. Both OpenVINO Model Server and vLLM expose OpenAI-compatible REST endpoints so the methodology is identical.
In the experiments, we change the average request rate to identify the tradeoff between total throughput and the TPOT latency.
Note that in the benchmarking, the feature of prefix_caching is not used.
How to obtain benchmark results#
General considerations#
When evaluating performance of a model with OpenVINO Runtime, it is required to measure a proper set of operations.
- Avoid including one-time costs such as model loading.
- Track operations that occur outside OpenVINO Runtime, such as video decoding, separately.
Performance conclusions should be build on reproducible data. As for the performance measurements, they should be done with a large number of invocations of the same routine. Since the first iteration is almost always significantly slower than the subsequent ones, an aggregated value can be used for the execution time for final projections:
- If the warm-up run does not help or execution times still vary, you can try running a large number of iterations and then use the mean value of the results.
- If time values differ too much, consider using a geomean.
- Be aware of potential power-related irregularities, such as throttling. A device may assume one of several different power states, so it is advisable to fix its frequency when optimizing, for better performance data reproducibility.
- Note that end-to-end application benchmarking should also be performed under real operational conditions.
When comparing OpenVINO Runtime performance with the framework or reference code, make sure that both versions are as similar as possible:
Wrap the exact inference execution (for examples, see Benchmark app).
Do not include model loading time.
Ensure that the inputs are identical for OpenVINO Runtime and the framework. For example, watch out for random values that can be used to populate the inputs.
In situations when any user-side pre-processing should be tracked separately, consider image pre-processing and conversion.
When applicable, leverage the Dynamic Shapes support.
If possible, demand the same accuracy. For example, TensorFlow allows
FP16execution, so when comparing to that, make sure to test the OpenVINO Runtime with theFP16as well.Install the latest release package supporting the frameworks of the tested models.
For the most reliable performance benchmarks,prepare the model for use with OpenVINO.
For testing generative AI models, make sure you select the method that best suits your case, Optimum-Intel or the OpenVINO GenAI package.
OpenVINO benchmarking (general)#
The default way of measuring OpenVINO performance is running a piece of code, referred to asthe benchmark tool. For Python, it is part of the OpenVINO Runtime installation, while for C++, it is available as a code sample.
Running the benchmark application#
The benchmark_app includes a lot of device-specific options, but the primary usage is as simple as:
benchmark_app -m -d -i
Each of the OpenVINO supported devicesoffers performance settings that contain command-line equivalents in the Benchmark app.
While these settings provide really low-level control for the optimal model performance on a_specific_ device, it is recommended to always start performance evaluation with theOpenVINO High-Level Performance Hintsfirst, like so:
for throughput prioritization
benchmark_app -hint tput -m -d
for latency prioritization
benchmark_app -hint latency -m -d
Internal Inference Performance Counters and Execution Graphs#
More detailed insights into inference performance breakdown can be achieved with device-specific performance counters and/or execution graphs. Both C++ and Pythonversions of the benchmark_app support a -pc command-line parameter that outputs an internal execution breakdown.
For example, the table below is part of performance counters forCPU inference. of a TensorFlow implementation of ResNet-50Keep in mind that since the device is CPU, the realTime wall clock and the cpu time layers are the same. Information about layer precision is also stored in the performance counters.
| layerName | execStatus | layerType | execType | realTime (ms) | cpuTime (ms) |
|---|---|---|---|---|---|
| resnet_model/batch_normalization_15/FusedBatchNorm/Add | EXECUTED | Convolution | jit_avx512_1x1_I8 | 0.377 | 0.377 |
| resnet_model/conv2d_16/Conv2D/fq_input_0 | NOT_RUN | FakeQuantize | undef | 0 | 0 |
| resnet_model/batch_normalization_16/FusedBatchNorm/Add | EXECUTED | Convolution | jit_avx512_I8 | 0.499 | 0.499 |
| resnet_model/conv2d_17/Conv2D/fq_input_0 | NOT_RUN | FakeQuantize | undef | 0 | 0 |
| resnet_model/batch_normalization_17/FusedBatchNorm/Add | EXECUTED | Convolution | jit_avx512_1x1_I8 | 0.399 | 0.399 |
| resnet_model/add_4/fq_input_0 | NOT_RUN | FakeQuantize | undef | 0 | 0 |
| resnet_model/add_4 | NOT_RUN | Eltwise | undef | 0 | 0 |
| resnet_model/add_5/fq_input_1 | NOT_RUN | FakeQuantize | undef | 0 | 0 |
The execStatus column of the table includes the following possible values:
- EXECUTED - the layer was executed by standalone primitive.
- NOT_RUN - the layer was not executed by standalone primitive or was fused with another operation and executed in another layer primitive.
The execType column of the table includes inference primitives with specific suffixes. The layers could have the following marks:
- The I8 suffix is for layers that had 8-bit data type input and were computed in 8-bit precision.
- The FP32 suffix is for layers computed in 32-bit precision.
All Convolution layers are executed in int8 precision. The rest of the layers are fused into Convolutions using post-operation optimization, as described inCPU Device. This contains layer names (as seen in OpenVINO IR), type of the layer, and execution statistics.
Both benchmark_app versions also support the exec_graph_path command-line option. It requires OpenVINO to output the same execution statistics per layer, but in the form of plugin-specific Netron-viewable graph to the specified file.
Especially when performance-debugginglatency, note that the counters do not reflect the time spent in the plugin/device/driver/etc queues. If the sum of the counters is too different from the latency of an inference request, consider testing with less inference requests. For example, running singleOpenVINO streamwith multiple requests would produce nearly identical counters as running a single inference request, while the actual latency can be quite different.
Lastly, the performance statistics with both performance counters and execution graphs are averaged, so such data for theinputs of dynamic shapesshould be measured carefully, preferably by isolating the specific shape and executing multiple times in a loop, to gather reliable data.
Use ITT to Get Performance Insights#
In general, OpenVINO and its individual plugins are heavily instrumented with Intel® Instrumentation and Tracing Technology (ITT). Therefore, you can also compile OpenVINO from the source code with ITT enabled and use tools likeIntel® VTune™ Profilerto get detailed inference performance breakdown and additional insights in the application-level performance on the timeline view.
OpenVINO benchmarking (LLM)#
Large Language Models require a different benchmarking approach to static models. A detailed description will be added soon.