Debugging Auto-Device Plugin — OpenVINO™ documentation (original) (raw)
Using Debug Log#
In case of execution problems, just like all other plugins, Auto-Device provides the user with information on exceptions and error values. If the returned data is not enough for debugging purposes, more information may be acquired by means of ov:🪵:Level.
There are six levels of logs, which can be called explicitly or set via the OPENVINO_LOG_LEVEL environment variable (can be overwritten by compile_model() or set_property()):
0 - ov:🪵:Level::NO1 - ov:🪵:Level::ERR2 - ov:🪵:Level::WARNING3 - ov:🪵:Level::INFO4 - ov:🪵:Level::DEBUG5 - ov:🪵:Level::TRACE
Python
core = ov.Core()

# compile a model on AUTO and set log level to debug
compiled_model = core.compile_model(
    model=model,
    device_name="AUTO",
    config={log.level: log.Level.DEBUG},
)
# set log level with set_property and compile model
core.set_property(
    device_name="AUTO",
    properties={log.level: log.Level.DEBUG},
)
compiled_model = core.compile_model(model=model, device_name="AUTO")
C++
ov::Core core;
// read a network in IR, PaddlePaddle, or ONNX format std::shared_ptrov::Model model = core.read_model("sample.xml");
// compile a model on AUTO and set log level to debug ov::CompiledModel compiled_model = core.compile_model(model, "AUTO", ov:🪵:level(ov:🪵:Level::DEBUG));
// or set log level with set_property and compile model core.set_property("AUTO", ov:🪵:level(ov:🪵:Level::DEBUG)); ov::CompiledModel compiled_model2 = core.compile_model(model, "AUTO");
OS environment variable
When defining it via the variable, a number needs to be used instead of a log level name, e.g.:
Linux export OPENVINO_LOG_LEVEL=0
Windows set OPENVINO_LOG_LEVEL=0
The property returns information in the following format:
[time]LOG_LEVEL[file] [PLUGIN]: message
in which the LOG_LEVEL is represented by the first letter of its name (ERROR being an exception and using its full name). For example:
[17:09:36.6188]D[plugin.cpp:167] deviceName:GPU, defaultDeviceID:, uniqueName:GPU_ [17:09:36.6242]I[executable_network.cpp:181] [AUTOPLUGIN]:select device:GPU [17:09:36.6809]ERROR[executable_network.cpp:384] [AUTOPLUGIN] load failed, GPU:[ GENERAL_ERROR ]
Instrumentation and Tracing Technology#
All major performance calls of both OpenVINO™ Runtime and the AUTO plugin are instrumented with Instrumentation and Tracing Technology (ITT) APIs. To enable ITT in OpenVINO™ Runtime, compile it with the following option:
-DENABLE_PROFILING_ITT=ON
For more information, you can refer to:
Analyze Code Performance on Linux#
You can analyze code performance using Intel® VTune™ Profiler. For more information and installation instructions refer to theIntel® VTune™ Profiler User GuideWith Intel® VTune™ Profiler installed you can configure your analysis with the following steps:
- Open Intel® VTune™ Profiler GUI on the host machine with the following command:
cd /vtune install dir/intel/oneapi/vtune/2021.6.0/env
source vars.sh
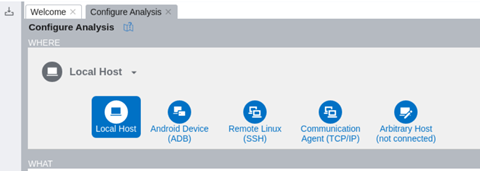
vtune-gui - Select Configure Analysis
- In the where pane, select Local Host
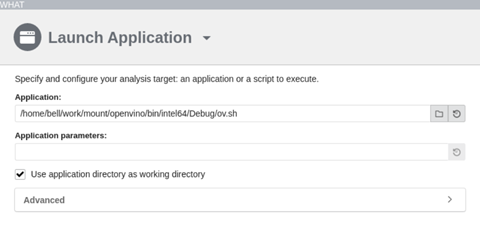
- In the what pane, specify your target application/script on the local system.
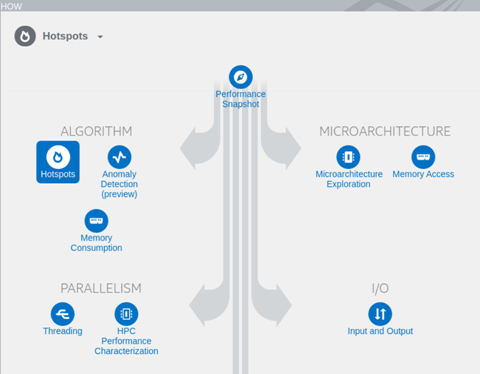
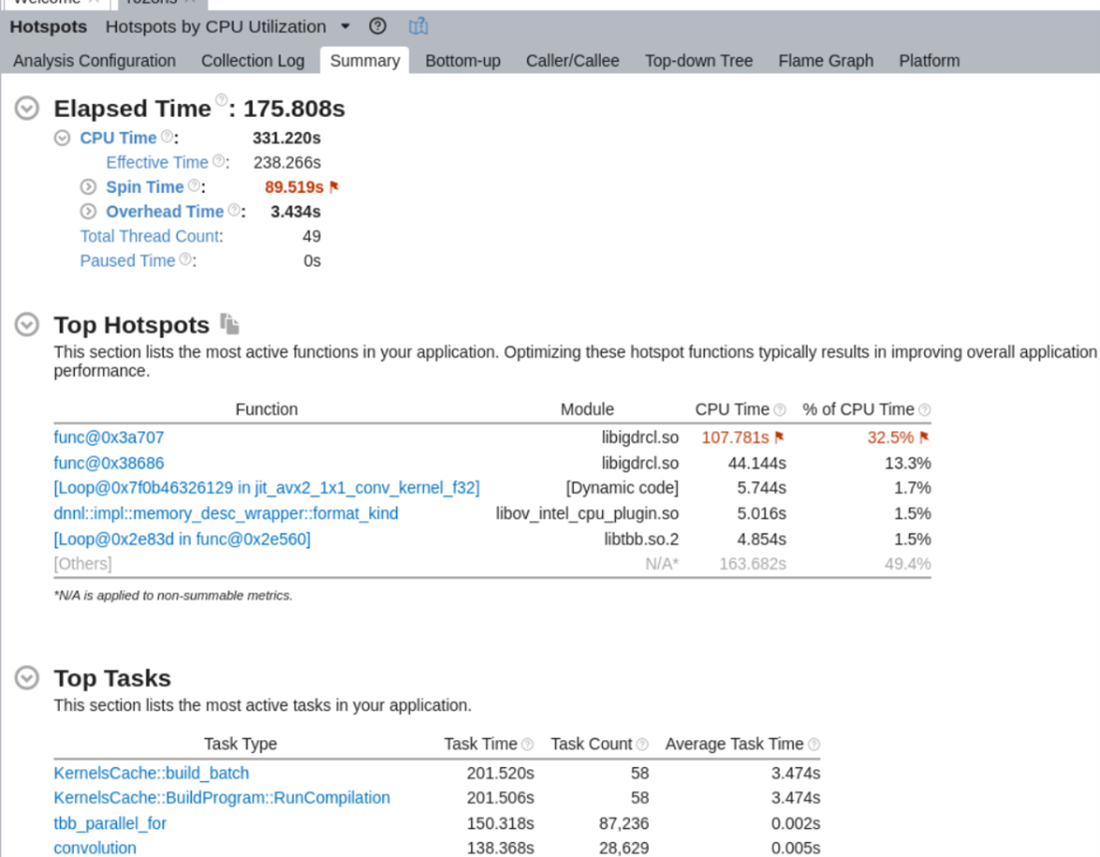
- In the how pane, choose and configure the analysis type you want to perform, for example, Hotspots Analysis: identify the most time-consuming functions and drill down to see time spent on each line of source code. Focus optimization efforts on hot code for the greatest performance impact.
- Start the analysis by clicking the start button. When it is done, you will get a summary of the run, including top hotspots and top tasks in your application:
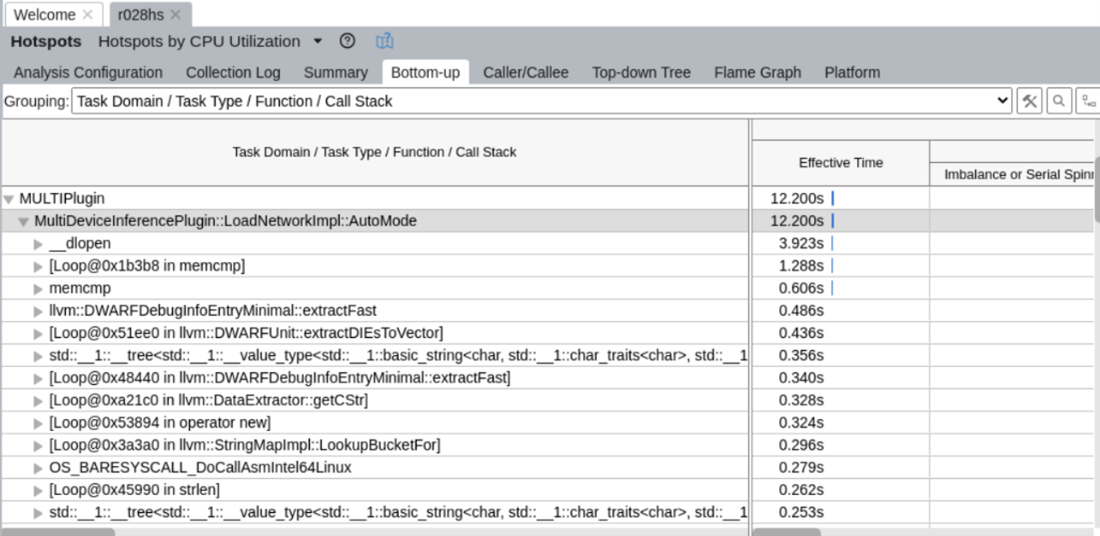
- To analyze ITT info related to the Auto plugin, click on the Bottom-up tab, choose the Task Domain/Task Type/Function/Call Stack from the dropdown list - Auto plugin-related ITT info is under the MULTIPlugin task domain: